


Early diagnosis of metabolic dysfunction-associated steatotic liver disease (MASLD), especially with advanced fibrosis, is crucial due to the increased risk of complications and mortality. Serum alanine aminotransferase (ALT) is commonly used; however, many patients have normal ranges (<55 U/L) who may remain undetected. We investigated the clinical implications of a lower ALT cut-off (>30 U/L) using intelligent liver function testing (iLFT) to identify MASLD patients with and without advanced fibrosis in primary care.
Materials and MethodsAll patients entering the iLFT diagnostic pathway had liver aetiological screening investigations if ALT >30 U/L. In those with MASLD the proportions with and without advanced fibrosis at different ALT thresholds: 31–41 U/L, 42–54 U/L and ≥55 U/L were compared.
Results16,373 patients underwent iLFT between March 2016 to April 2022. 762 (5 %) patients had MASLD with abnormal fibrosis scores, while 908 (6 %) had MASLD with normal fibrosis scores. 428 (56 %) patients were assessed in liver clinics, where 169 (39 %) had evidence of fibrosis. Of these, 22 (13 %) had ALT 31–41 U/L, 31 (18 %) had ALT 42–54 U/L and 116 (69 %) had ALT ≥55 U/L. 145 (86 %) patients had advanced fibrosis or cirrhosis, where 20 (14 %) had ALT 31–41 U/L, 28 (19 %) had ALT 42–54 U/L and 97 (67 %) had ALT ≥55 U/L.
Conclusions33 % of MASLD patients with advanced fibrosis or cirrhosis had ALT 31–54 U/L, who would have been missed using the conventional ALT range. This suggests that lowering the ALT cut-off improves diagnosis of MASLD with advanced fibrosis in primary care.
Metabolic dysfunction-associated steatotic liver disease (MASLD) is one of the most common drivers of chronic liver disease in the UK, with an estimated prevalence of 25–30 % in the adult population [1]. While most patients have simple steatosis and do not progress, about 5 % develop significant liver disease over a 10–20 year period [2]. With the high disease prevalence, this translates to a substantial number of patients at risk of liver-related mortality and morbidity. The severity of fibrosis is a key prognostic indicator and correlates with liver-related outcomes and mortality in MASLD [3,4]. However, detecting advanced liver disease remains challenging. Fibrotic liver disease progresses silently, and most patients remain asymptomatic until they present with bleeding varices, ascites and encephalopathy [5,6].
Serum ALT is routinely used to detect liver disease. However, its upper limit of normal (ULN) remains controversial, and its effectiveness in some diseases is debated, particularly in type 2 diabetes [7–9]. Different methodologies for the measurement of ALT have historically generated uncertainties about normal ranges where subclinical MASLD and hepatitis C were likely included in the reference populations [10–12]. This is further complicated by studies that demonstrated up to 22–33 % of MASLD patients with advanced fibrosis have normal ALT levels (<40 U/L), and that serum ALT levels do not correlate well with the histological severity of MASLD [13–18]. International standards have improved this with recent studies involving healthy individuals, which have suggested lower ALT ranges of 29–42 U/L for men and 19–30 U/L for women [12,19–22]. Using a lower ULN of ALT may allow the early detection of more MASLD patients with fibrosis who may benefit from lifestyle interventions and risk factor modifications.
The intelligent liver function testing (iLFT) platform was originally developed in Tayside, Scotland, to improve decision-making, diagnosis and management of abnormal LFTs in primary care. Utilising the availability of automated laboratory tracked analysers, minimal diagnostic criteria and non-invasive fibrosis scores, iLFT automatically investigates abnormal LFTs through a series of cascading aetiological tests to generate a liver disease diagnosis and management plan [10,23,24].
The reference range for ALT in NHS Tayside laboratories is 10–55 U/L. Within the iLFT algorithm, a lower ULN of 30 U/L was implemented as reflex trigger for additional testing and fibrosis assessment. In this analysis of consecutive prospectively tested patients who underwent iLFT analysis, we aim to compare the proportion of MASLD patients (with and without advanced fibrosis) with ALT 31–54 U/L relative to those ≥55 U/L. We also sought to compare iLFT-suggested MASLD diagnoses to the final clinic diagnosis in patients to investigate the effectiveness of iLFT in referring the appropriate patients for further assessment.
2Patients and Methods2.1iLT protocoliLFT was developed to improve the diagnosis of liver disease within primary care. The decision to perform iLFT is at the discretion of the GP and based on suspicion of undiagnosed liver disease. Referrers (GPs) provide information on the patient's BMI, alcohol consumption and the presence or absence of diabetes mellitus. Once requested, an initial sample of LFTs is tested first. In the case of abnormal LFT results, iLFT automatically cascades into performing all the recommended screening tests for the presence of liver disease; this includes: bilirubin, albumin, platelet count, hepatitis B surface antigen (HBsAg), hepatitis C antibody, ferritin, iron, transferrin, percentage saturation of transferrin, haptoglobin, caeruloplasmin, alpha-1-antitrypsin, anti-nuclear antibody, anti-mitochondrial antibody, anti-smooth muscle antibody, anti-liver kidney microsomal antibody and non-invasive fibrosis scores (NAFLD Fibrosis score [NFS], Fibrosis-4 [Fib-4] Index, Enhanced Liver Fibrosis [ELF]).
In real-time, these results, combined with the initial information provided, provide an automated diagnosis and recommended management plan for the GP. iLFT stratifies patients based on their probable liver disease diagnosis and non-invasive fibrosis scores, such that those with normal fibrosis scores can safely remain in primary care, while those with elevated fibrosis scores or specific liver disease (for example, autoimmune hepatitis) are referred to secondary care for specialist input.
The initial pilot study on iLFT conducted in Tayside, Scotland, reported a 43 % increase in the diagnosis of liver disease, compared to GPs' diagnosis, with >90 % diagnostic accuracy and was shown to be cost effective. More detailed protocols on the iLFT algorithm are described elsewhere[10,23].
2.2Study designAll patients who received an iLFT diagnostic cascade following a GP visit in NHS Tayside from 09/03/2016 to 29/04/2022 were retrospectively reviewed.
2.3SettingTayside is a geographic region in the East of Scotland. Its population is approximately 416,000 and residents' health needs are met by NHS Scotland, a publicly funded health service. The iLFT system was piloted in 2015 and implemented into routine care thereafter, becoming available to GPs throughout the region.
2.4ParticipantsAll adults (≥18 years) who received an iLFT diagnostic cascade and a diagnosis of MASLD between the dates previously specified were eligible for inclusion. Exclusion criteria were patients with: an iLFT diagnosis other than MASLD; isolated LFT abnormalities; missing data; no iLFT outcomes or final diagnosis; ALT values ≤30 U/L; or excessive alcohol intake (≥14 units per week).
2.5MeasuresThe following data were collected: patient demographics (age, sex, BMI); behavioural data (alcohol consumption); evidence of metabolic syndrome (type 2 diabetes, hypertension, hyperlipidaemia); biochemical test results (ALT, Aspartate transaminase [AST], alkaline phosphatase [ALP], gamma-glutamyl transferase [GGT], bilirubin, albumin, platelet count, hepatitis B surface antigen [HBsAg], HCV antibody, ferritin, iron, transferrin, percentage saturation of transferrin, haptoglobin, caeruloplasmin, alpha-1-antitrypsin); immunology results (anti-nuclear antibody, anti-mitochondrial antibody, anti-smooth muscle antibody, anti-liver kidney microsomal antibody); and serological fibrosis scores (NAFLD Fibrosis Score [NFS]; Fibrosis-4 score [Fib-4]; Enhanced Liver Fibrosis [ELF] score), where available. The iLFT algorithm may suggest two or more potential diagnoses based on aetiological test results, for example, an α1-antitrypsin deficiency and MASLD with normal fibrosis scores; all initial diagnoses were noted.
2.6DefinitionsThe diagnostic criteria for MASLD in iLFT are: elevated ALT (>30 U/L) and/or GGT (>73 U/L), BMI ≥25 kg/m2, a negative liver disease aetiology screen, and an alcohol intake of <14 units per week [24]. Patients fulfilling these criteria, combined with abnormal non-invasive fibrosis scores, are automatically referred to secondary care for further assessment. Liver biopsy was not routinely used to diagnose MASLD within Tayside. Instead, the final diagnosis of MASLD was made by a consultant hepatologist using information gathered from the clinical history, physical examination, laboratory results and transient elastography. Steatosis was graded using the following CAP scores: S0, <248 dB/m; S1, 248–267 dB/m; S2, 268–279 dB/m; S3, ≥280 dB/m. Advanced fibrosis was defined as either a liver stiffness measurement (LSM) reading of ≥8.0 kPa using Vibration-controlled Transient Elastography (VCTE) [25–27] or evidence of cirrhosis on CT or MRI. The following cut-off values for non-invasive fibrosis scores were considered normal and did not trigger a referral to secondary care: NAFLD Fibrosis Score (NFS), ≤−1.455 for <65 years and ≤0.12 for ≥65 years; Fib-4 score, ≤1.3 for <65 years and ≤2.0 for ≥65 years; Enhanced Liver Fibrosis (ELF) score, <9.8 [28]. Overweight was Body Mass Index (BMI) of 25–29 kg/m2 and obesity was BMI ≥30 kg/m2.
2.7Data sourceRoutinely collected administrative data were used. These were sourced from NHS Tayside laboratory systems and patients' Electronic Medical Record (EMR).
2.8Statistical analysisPatients were stratified into three ALT categories: ALT 31–41 U/L, ALT 42–54 U/L, and ALT ≥55 U/L [12,19,21]. The frequency of MASLD diagnoses with abnormal and normal NFS or Fib-4 score was determined and compared across ALT categories. Descriptive statistics were used to derive counts, proportions, and ranges. Mean ± standard deviation was reported for normally distributed data and median (1st quartile – 3rd quartile) for non-normally distributed data. For normally distributed continuous data, the one-way analysis of variance (ANOVA) with multiple pairwise comparison was performed to compare means among groups. For non-normally distributed data, the Kruskal-Wallis H test with multiple pairwise comparisons was used to compare medians among groups. The chi-squared test was performed to compare proportions between categorical variables. A p value of ≤0.05 was assumed to demonstrate statistically significant difference. Where required, the Bonferroni correction was applied to correct for multiple comparisons. Analyses were performed using the SPSS Statistics software Version 22 (SPSS Inc).
2.9Ethical statementThe initial iLFT pilot study was reviewed and approved by the East of Scotland Research Ethics Service [23]. Written informed consent was obtained from each patient included in the study and the study protocol conforms to the ethical guidelines of the 1975 Declaration of Helsinki as reflected in a priori approval by the East of Scotland Research Ethics Service (REC number: 15/ES/0147, IRAS number: 189,385). Additional Caldicott Guardian approval – a procedure that ensures the protection and appropriate use of patient-identifiable data – was obtained for retrospective review and analysis of the much larger standard care dataset.
3Results3.1Study populationBetween March 2016 and April 2022, a total of 16,373 patients had iLFT requested by their GPs, which generated 13,476 outcomes (Fig. 1). iLFT did not cascade in 3415 patients due to normal LFT results and no outcomes were generated. 1125 patients had missing laboratory biomarkers (AST, platelet count), preventing the calculation of non-invasive fibrosis scores and were also excluded. 3986 patients had non-MASLD diagnoses and 5996 patients had negative aetiological screens with descriptive LFT outcomes and were excluded. 181 patients with ALT ≤30 U/L were diagnosed with MASLD following abnormal ALP, GGT or bilirubin values and were also excluded. This resulted in 1670 patients with an iLFT diagnosis of MASLD who were included in the analysis. 762 patients had elevated non-invasive fibrosis scores and were referred to liver clinic for further assessment (Fig. 1). Another 908 patients had normal non-invasive fibrosis scores and remained in primary care.
 within each ALT category. The proportion of advanced fibrosis (F3) or cirrhosis (F4) within each ALT category is also shown. Abbreviations: iLFT, intelligent Liver Function Test; ALT, alanine aminotransferase; LFT, liver function test; MASLD, metabolic dysfunction-associated steatotic liver disease.")
iLFT diagnostic pathway for the detection and risk stratification of MASLD patients with and without fibrosis in primary care between March 2016 – April 2022. Results show the proportion of MASLD patients with abnormal NFS/Fib-4 score who were assessed in liver clinics and found to have fibrosis (F1-F4) within each ALT category. The proportion of advanced fibrosis (F3) or cirrhosis (F4) within each ALT category is also shown. Abbreviations: iLFT, intelligent Liver Function Test; ALT, alanine aminotransferase; LFT, liver function test; MASLD, metabolic dysfunction-associated steatotic liver disease.
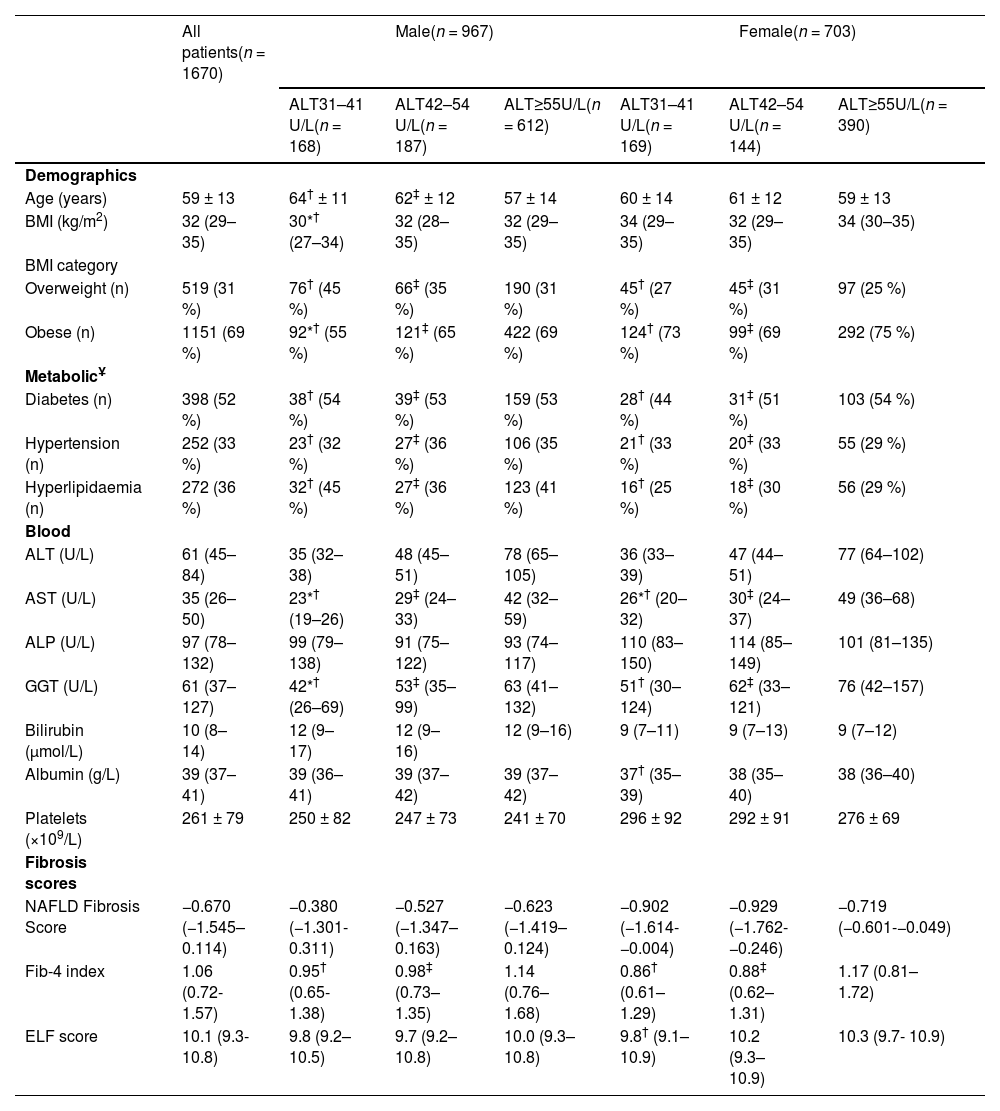
The clinical characteristics of all MASLD patients identified by iLFT are shown in Table 1. The mean age was 59 (±13) years and 967 (58 %) of patients were male. About one third of patients were overweight (31 %), whereas the remaining were obese (69 %). The median ALT level was 61 U/L (45–84 U/L). The cohort had a median NFS score of −0.670 (−1.545–0.114), a median Fib-4 score of 1.06 (0.72–1.57) and a median ELF score of 10.1 (9.3–10.8). Of the MASLD patients with elevated non-invasive fibrosis scores, more than half had type 2 diabetes (52 %) and one-third had essential hypertension (33 %) or hyperlipidaemia (36 %).
Clinical characteristics of patients with MASLD suggested by iLFT, stratified against sex and ALT category.
| All patients(n = 1670) | Male(n = 967) | Female(n = 703) | |||||
|---|---|---|---|---|---|---|---|
| ALT31–41 U/L(n = 168) | ALT42–54 U/L(n = 187) | ALT≥55U/L(n = 612) | ALT31–41 U/L(n = 169) | ALT42–54 U/L(n = 144) | ALT≥55U/L(n = 390) | ||
| Demographics | |||||||
| Age (years) | 59 ± 13 | 64† ± 11 | 62‡ ± 12 | 57 ± 14 | 60 ± 14 | 61 ± 12 | 59 ± 13 |
| BMI (kg/m2) | 32 (29–35) | 30*† (27–34) | 32 (28–35) | 32 (29–35) | 34 (29–35) | 32 (29–35) | 34 (30–35) |
| BMI category | |||||||
| Overweight (n) | 519 (31 %) | 76† (45 %) | 66‡ (35 %) | 190 (31 %) | 45† (27 %) | 45‡ (31 %) | 97 (25 %) |
| Obese (n) | 1151 (69 %) | 92*† (55 %) | 121‡ (65 %) | 422 (69 %) | 124† (73 %) | 99‡ (69 %) | 292 (75 %) |
| MetabolicҰ | |||||||
| Diabetes (n) | 398 (52 %) | 38† (54 %) | 39‡ (53 %) | 159 (53 %) | 28† (44 %) | 31‡ (51 %) | 103 (54 %) |
| Hypertension (n) | 252 (33 %) | 23† (32 %) | 27‡ (36 %) | 106 (35 %) | 21† (33 %) | 20‡ (33 %) | 55 (29 %) |
| Hyperlipidaemia (n) | 272 (36 %) | 32† (45 %) | 27‡ (36 %) | 123 (41 %) | 16† (25 %) | 18‡ (30 %) | 56 (29 %) |
| Blood | |||||||
| ALT (U/L) | 61 (45–84) | 35 (32–38) | 48 (45–51) | 78 (65–105) | 36 (33–39) | 47 (44–51) | 77 (64–102) |
| AST (U/L) | 35 (26–50) | 23*† (19–26) | 29‡ (24–33) | 42 (32–59) | 26*† (20–32) | 30‡ (24–37) | 49 (36–68) |
| ALP (U/L) | 97 (78–132) | 99 (79–138) | 91 (75–122) | 93 (74–117) | 110 (83–150) | 114 (85–149) | 101 (81–135) |
| GGT (U/L) | 61 (37–127) | 42*† (26–69) | 53‡ (35–99) | 63 (41–132) | 51† (30–124) | 62‡ (33–121) | 76 (42–157) |
| Bilirubin (μmol/L) | 10 (8–14) | 12 (9–17) | 12 (9–16) | 12 (9–16) | 9 (7–11) | 9 (7–13) | 9 (7–12) |
| Albumin (g/L) | 39 (37–41) | 39 (36–41) | 39 (37–42) | 39 (37–42) | 37† (35–39) | 38 (35–40) | 38 (36–40) |
| Platelets (×109/L) | 261 ± 79 | 250 ± 82 | 247 ± 73 | 241 ± 70 | 296 ± 92 | 292 ± 91 | 276 ± 69 |
| Fibrosis scores | |||||||
| NAFLD Fibrosis Score | −0.670 (−1.545–0.114) | −0.380 (−1.301- 0.311) | −0.527 (−1.347–0.163) | −0.623 (−1.419–0.124) | −0.902 (−1.614- −0.004) | −0.929 (−1.762- −0.246) | −0.719 (−0.601-−0.049) |
| Fib-4 index | 1.06 (0.72- 1.57) | 0.95† (0.65- 1.38) | 0.98‡ (0.73–1.35) | 1.14 (0.76–1.68) | 0.86† (0.61–1.29) | 0.88‡ (0.62–1.31) | 1.17 (0.81–1.72) |
| ELF score | 10.1 (9.3- 10.8) | 9.8 (9.2–10.5) | 9.7 (9.2–10.8) | 10.0 (9.3–10.8) | 9.8† (9.1–10.9) | 10.2 (9.3–10.9) | 10.3 (9.7- 10.9) |
Data are shown as frequency ( %) or median (1st quartile-3rd quartile).
ҰData only available for patients with MASLD and abnormal NFS/Fib-4 scores who were referred to liver clinic (n = 762).
762 patients had MASLD with elevated fibrosis scores diagnosed by iLFT; 134 (17 %) had ALT 31–41 U/L, 135 (18 %) had ALT 42–54 U/L, and 493 (65 %) had ALT ≥55 U/L (Fig. 2). In these patients, 48 (36 %), 68 (50 %) and 266 (54 %) patients with ALT 31–41 U/L, 42–54 U/L and ≥55 U/L had concurrent elevated ALP or GGT, respectively. Another 908 patients had MASLD with normal fibrosis scores on iLFT; 203 (22 %) had ALT 31–41 U/L, 196 (22 %) had ALT 42–54 U/L and 509 (56 %) had ALT ≥55 U/L. Of these, 67 (33 %), 58 (30 %) and 204 (40 %) patients with ALT 31–41 U/L, 42–54 U/L and ≥55 U/L had concurrent elevated GGT or ALP, respectively.
: >−1.455 for <65 years and >0.12 for ≥65 years; Fib-4 score: >1.3 for <65 years and >2.0 for ≥65 years.†Significant difference between ALT 31–41 U/L and ALT ≥55 U/L groups. ‡Significant difference between ALT 42–54 U/L and ALT ≥55 U/L groups.")
Proportion of patients with iLFT diagnosis of MASLD with normal or elevated NFS and Fib-4 score in each ALT category. Results are expressed as a proportion of MASLD diagnoses in each ALT category. Cut-off values: NAFLD Fibrosis Score (NFS): >−1.455 for <65 years and >0.12 for ≥65 years; Fib-4 score: >1.3 for <65 years and >2.0 for ≥65 years.†Significant difference between ALT 31–41 U/L and ALT ≥55 U/L groups. ‡Significant difference between ALT 42–54 U/L and ALT ≥55 U/L groups.
All patients with MASLD and elevated non-invasive fibrosis scores were referred to secondary care for further assessment (n = 762). 230 (30 %) did not attend or had incomplete data. 104 (14 %) patients had a sequential ELF score of <9.8, which safely excludes advanced fibrosis, and remained in primary care [29]. Therefore, 428 (56 %) patients were referred and assessed by a clinician in clinic (Fig. 1).
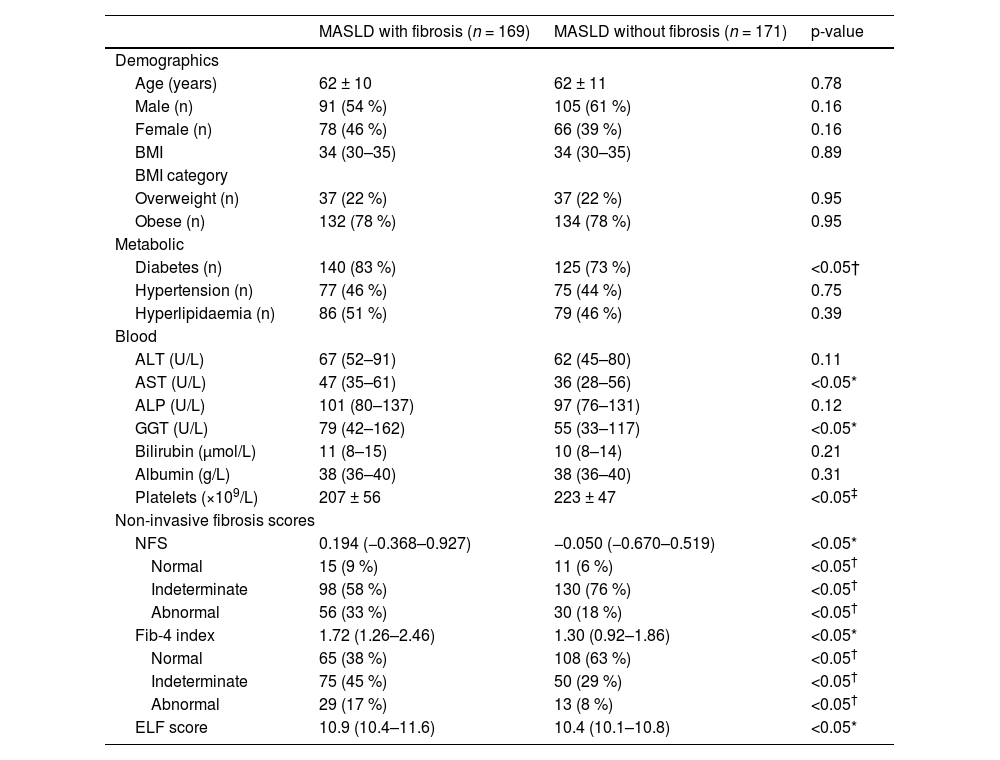
Among those assessed, 169 (39 %) patients had a diagnosis of MASLD with evidence of fibrosis (F1-F3) or cirrhosis (F4), while 171 (40 %) patients were diagnosed with MASLD without evidence of fibrosis (Fig. 1). The clinical characteristics of both cohorts are shown in Table 2. The MASLD and fibrosis cohort had significantly higher AST, GGT levels and significantly lower platelet count than the MASLD without fibrosis cohort (p < 0.05). A higher proportion of the MASLD with fibrosis group had diabetes compared to the MASLD without fibrosis group (83 % vs. 73 %, p < 0.05), while the proportion of hypertension and hyperlipidaemia in each group was similar.
Clinical characteristics of MASLD patients with and without fibrosis, diagnosed in secondary care.
| MASLD with fibrosis (n = 169) | MASLD without fibrosis (n = 171) | p-value | |
|---|---|---|---|
| Demographics | |||
| Age (years) | 62 ± 10 | 62 ± 11 | 0.78 |
| Male (n) | 91 (54 %) | 105 (61 %) | 0.16 |
| Female (n) | 78 (46 %) | 66 (39 %) | 0.16 |
| BMI | 34 (30–35) | 34 (30–35) | 0.89 |
| BMI category | |||
| Overweight (n) | 37 (22 %) | 37 (22 %) | 0.95 |
| Obese (n) | 132 (78 %) | 134 (78 %) | 0.95 |
| Metabolic | |||
| Diabetes (n) | 140 (83 %) | 125 (73 %) | <0.05† |
| Hypertension (n) | 77 (46 %) | 75 (44 %) | 0.75 |
| Hyperlipidaemia (n) | 86 (51 %) | 79 (46 %) | 0.39 |
| Blood | |||
| ALT (U/L) | 67 (52–91) | 62 (45–80) | 0.11 |
| AST (U/L) | 47 (35–61) | 36 (28–56) | <0.05* |
| ALP (U/L) | 101 (80–137) | 97 (76–131) | 0.12 |
| GGT (U/L) | 79 (42–162) | 55 (33–117) | <0.05* |
| Bilirubin (μmol/L) | 11 (8–15) | 10 (8–14) | 0.21 |
| Albumin (g/L) | 38 (36–40) | 38 (36–40) | 0.31 |
| Platelets (×109/L) | 207 ± 56 | 223 ± 47 | <0.05‡ |
| Non-invasive fibrosis scores | |||
| NFS | 0.194 (−0.368–0.927) | −0.050 (−0.670–0.519) | <0.05* |
| Normal | 15 (9 %) | 11 (6 %) | <0.05† |
| Indeterminate | 98 (58 %) | 130 (76 %) | <0.05† |
| Abnormal | 56 (33 %) | 30 (18 %) | <0.05† |
| Fib-4 index | 1.72 (1.26–2.46) | 1.30 (0.92–1.86) | <0.05* |
| Normal | 65 (38 %) | 108 (63 %) | <0.05† |
| Indeterminate | 75 (45 %) | 50 (29 %) | <0.05† |
| Abnormal | 29 (17 %) | 13 (8 %) | <0.05† |
| ELF score | 10.9 (10.4–11.6) | 10.4 (10.1–10.8) | <0.05* |
Data are shown as frequency ( %) or median (1st quartile-3rd quartile).
Non-invasive fibrosis test scores (NFS, Fib-4 and ELF) were significantly higher in the MASLD with fibrosis cohort compared to the MASLD without fibrosis cohort. In both groups, most patients had indeterminate NFS score (58 % and 76 %), however, a higher proportion of the MASLD with fibrosis group had abnormal NFS scores suggestive of advanced fibrosis, compared to the MASLD without fibrosis group (NFS >0.676, 33 % vs. 18 %, p < 0.05).
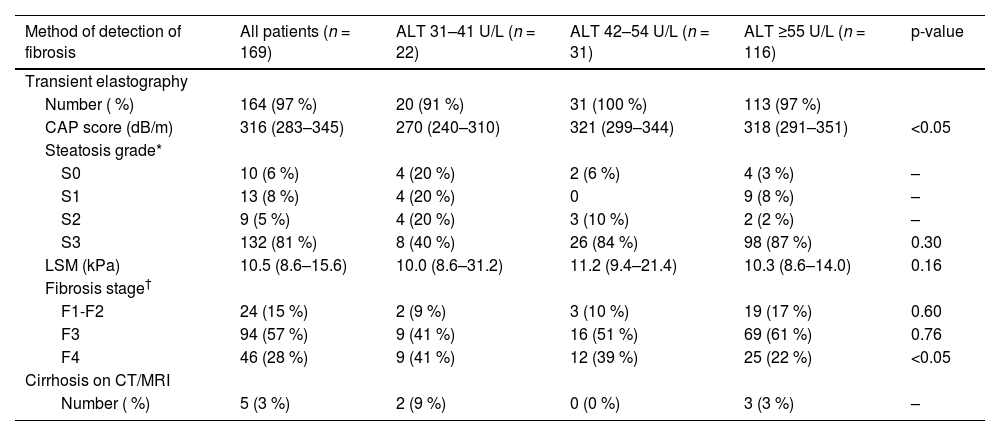
3.5Proportion of advanced fibrosis (F3) and cirrhosis (F4) at different ALT thresholdsWithin the MASLD with fibrosis cohort (n = 169), 164 (97 %) patients had transient elastography performed and 5 (3 %) patients had cirrhosis on CT or MRI. The results of transient elastography are shown in Table 3. The median CAP score was 316 dB/m (283–345) with most patients having steatosis grade S3 (n = 132, 81 %). The median CAP score in both ALT 42–54 U/L and ALT ≥55 U/L groups were significantly higher than that in the ALT 31–41 U/L group (p < 0.05). The median liver stiffness measurement was 10.5 kPa (8.6–15.6) without any significant difference in the median LSM among the ALT groups (p = 0.16).
Imaging findings and fibrosis stage in MASLD patients stratified to ALT level.
| Method of detection of fibrosis | All patients (n = 169) | ALT 31–41 U/L (n = 22) | ALT 42–54 U/L (n = 31) | ALT ≥55 U/L (n = 116) | p-value |
|---|---|---|---|---|---|
| Transient elastography | |||||
| Number ( %) | 164 (97 %) | 20 (91 %) | 31 (100 %) | 113 (97 %) | |
| CAP score (dB/m) | 316 (283–345) | 270 (240–310) | 321 (299–344) | 318 (291–351) | <0.05 |
| Steatosis grade* | |||||
| S0 | 10 (6 %) | 4 (20 %) | 2 (6 %) | 4 (3 %) | – |
| S1 | 13 (8 %) | 4 (20 %) | 0 | 9 (8 %) | – |
| S2 | 9 (5 %) | 4 (20 %) | 3 (10 %) | 2 (2 %) | – |
| S3 | 132 (81 %) | 8 (40 %) | 26 (84 %) | 98 (87 %) | 0.30 |
| LSM (kPa) | 10.5 (8.6–15.6) | 10.0 (8.6–31.2) | 11.2 (9.4–21.4) | 10.3 (8.6–14.0) | 0.16 |
| Fibrosis stage† | |||||
| F1-F2 | 24 (15 %) | 2 (9 %) | 3 (10 %) | 19 (17 %) | 0.60 |
| F3 | 94 (57 %) | 9 (41 %) | 16 (51 %) | 69 (61 %) | 0.76 |
| F4 | 46 (28 %) | 9 (41 %) | 12 (39 %) | 25 (22 %) | <0.05 |
| Cirrhosis on CT/MRI | |||||
| Number ( %) | 5 (3 %) | 2 (9 %) | 0 (0 %) | 3 (3 %) | – |
Results are shown as frequency ( %) and median (1st quartile-3rd quartile).
Of the 169 MASLD patients with evidence of fibrosis of any stage (F1-F4), 22 (13 %) patients had ALT 31–41 U/L and 31 (19 %) patients had ALT 42–54 U/L, while the remaining 116 (69 %) patients had ALT ≥55 U/L (Fig. 3). Advanced fibrosis (F3) or cirrhosis (F4) was present in 145 (86 %) patients; the proportions were similar in each ALT category: 91 % in the ALT 31–41 U/L group, 90 % in the ALT 42–54 U/L group and 84 % in the ALT ≥55 U/L group (p = 0.50) (Table 3). This corresponds to 20 (14 %) patients with ALT 31–41 U/L, 28 (19 %) with ALT 42–54 U/L and 97 (67 %) with ALT ≥55 U/L (p < 0.001) (Fig. 3). With a lower ALT threshold of 30 U/L, iLFT detected an additional 48 patients with MASLD and advanced fibrosis or cirrhosis across a 6-year period within the primary care setting.
 at different ALT thresholds. The bar on the right shows a subset of patients with advanced fibrosis (F3) or cirrhosis (F4). †Significant difference in proportions between ALT 31–41 U/L and ALT ≥55 U/L groups. ‡Significant difference in proportions between ALT 42–54 U/L and ALT ≥55 U/L groups.")
Proportion of MASLD diagnoses with fibrosis (F1-F4) at different ALT thresholds. The bar on the right shows a subset of patients with advanced fibrosis (F3) or cirrhosis (F4). †Significant difference in proportions between ALT 31–41 U/L and ALT ≥55 U/L groups. ‡Significant difference in proportions between ALT 42–54 U/L and ALT ≥55 U/L groups.
Of the MASLD without fibrosis cohort (n = 171), 32 (19 %) had ALT 31–41 U/L, 29 (17 %) had ALT 42–54 U/L and 110 (64 %) had ALT ≥55 U/L. A further 88 (20 %) patients had a non-MASLD diagnosis at liver clinic. ARLD was the most common alternative diagnosis (n = 27, 31 %), however, 24 (27 %) patients still had a MASLD diagnosis in conjunction with another liver disease diagnosis. 12 (2 %) patients did not have a definitive diagnosis at liver clinic. Reasons for this include non-specific fatty infiltration of liver and deranged liver enzymes, awaiting further characterisation.
4DiscussionIn this analysis on using a lower ALT threshold to diagnose liver disease, we found a substantial proportion of MASLD patients with advanced disease having ALT values lower than the conventional upper limit of normal. Had the conventional limit been used in the iLFT algorithm, these patients – particularly the proportion with advanced fibrosis and cirrhosis – may have remained undiagnosed with the risk of progressive fibrogenesis and related sequelae of chronic liver disease.
Prior work has demonstrated similar findings in those with lower 'normal' ALT levels. A prospective study investigating the prevalence of histological NASH in patients with metabolic syndrome and normal ALT <40 U/L demonstrated 33 % of patients had fibrosis, while 10 % had cirrhosis [17]. Similarly, a study examining patients with biopsy-proven NASH showed no significant differences in the frequency of advanced fibrosis in patients with ALT<40 U/L relative to those with elevated ALT levels [16]. Comparable findings have been reported demonstrating that 22 % of patients with ALT <40 U/L had advanced fibrosis, compared to 18 % of patients with elevated ALT [30]. These data, taken together with the results of this study, imply that conventional ALT reference thresholds may be redundant, with a substantial proportion of patients having underlying fibrosis despite falsely reassuring ALT results. When a lower ALT threshold was implemented into real-life clinical practice within Tayside, we found a substantial improvement in the identification of patients with MASLD and advanced fibrosis or cirrhosis.
It is crucial to identify such patients, due to a higher risk of mortality and cirrhosis-related complications. MASLD with advanced fibrosis is associated with an increase in all-cause mortality and death from cardiovascular disease and liver disease, compared to the general population [3,4]. In our cohort, among patients with ALT 31–54 U/L, more than half were obese and had type 2 diabetes, while about one-third had hypertension and/or hyperlipidaemia. Had they remained undetected, these patients would likely present with liver decompensation events, cardiovascular diseases, or malignancies in the future. Scalable early detection, through automated systems such as iLFT, with a lower ULN for ALT, can allow appropriate multi-disciplinary intervention to achieve sufficient lifestyle and dietary changes – as well as managing co-morbidities and surveillance programmes – to reduce future risk for negative outcomes. This also allows the identification of patient populations suitable for NASH-modifying drugs that are in development.
Other studies and guidelines have suggested an ULN for ALT of around 30 U/L, similar to our approach [12,22,31]. Prati et al. suggested that the ULN of ALT should be 30 U/L in men and 19 U/L in women at lowest risk for MASLD, while the American Association for the Study of Liver disease (AASLD) recommend an ALT ULN of 29 U/L in men and 19 U/L in women for diagnosing MASLD [12,31]. Using the standardised International Federation of Clinical Chemistry (IFCC) methodology to measure ALT, Valenti et al. have proposed true normal ALT ranges of 30 U/L for females and 42 U/L for males [22].
Notwithstanding this, lowering the ULN of ALT in clinical practice to diagnose liver disease remains controversial. A common contention is that doing so increases the proportion of individuals with an abnormal ALT value, giving rise to diagnostic uncertainties since the cost-effectiveness and clinical implications of further investigations in these patients have yet to be established [32]. In our study, using an ALT cut-off of 30 U/L resulted in an additional 668 patients who received a MASLD diagnosis by iLFT, compared to if the cut-off had remained at 55 U/L (Table 1). Whilst the number of patients diagnosed with MASLD has increased, our results demonstrated that a third of these patients with abnormal NFS/Fib-4 scores had ALT 31–54 U/L (Fig. 2). More importantly, a similar proportion of patients within this ALT range had advanced fibrosis or cirrhosis (Fig. 3); these constitute the patient population most at risk of progression to cirrhosis and decompensation and who will benefit most from interventions and surveillance programmes. Despite the increased throughput of patients with abnormal ALT values, iLFT was effective as a first-line screening platform that allowed risk stratification of MASLD patients with possible advanced fibrosis for further assessment, while patients with normal fibrosis scores remained in primary care so as not to overwhelm secondary care services. Such first-line screening mechanisms, rooted in the primary care setting, are critical to ensuring that patients who are seen in clinic require to be seen in clinic.
Our study also demonstrates the need for a lower and standardised ULN of ALT among laboratories both nationwide and worldwide. In the UK, higher-than-normal ALT thresholds are still routinely used, usually between 40 and 55 U/L [10,33]. Another study involving 11 clinical laboratories from the NASH Clinical Research Network (CRN) reported a significant range of ALT ULN values between 35 and 79 U/L in men and 31–55 U/L in women, mainly due to differences in clinical characteristics of the local reference population [11]. Particularly in the context of MASLD where an abnormal ALT may be the only clinical clue in an otherwise asymptomatic individual, the substantial variability and higher-than-normal cut-off values may result in falsely reassuring ALT results in a significant proportion of patients who may have underlying advanced fibrosis and cirrhosis [34]. This highlights the need to advocate for laboratories across regions to adopt the true normal value of ALT for a more consistent reference value to detect MASLD and trigger further assessment.
The accuracy of iLFT is designed to be limited so that it "fails safe": whereby patients are automatically referred if doubt exists about diagnosis or staging. This is particularly relevant for disease staging using blood-based testing, where a large number can safely be left in primary care, but of those referred only a proportion may have fibrosis necessitating further follow-up. Of the 428 patients referred for clinic assessment, 40 % were correctly diagnosed as MASLD with fibrosis, while another 40 % had MASLD with no fibrosis and a further one-fifth had non-MASLD disease. iLFT accurately diagnosed 80 % of referred patients with the minimal information supplied by GPs when requesting testing. The other non-MASLD diseases, such as ARLD, are mainly due to information either inaccurately entered by the patients' GP or commonly under reported alcohol consumption.
To our knowledge, this is the first study to investigate the impact of a lower ULN of ALT on the diagnosis of MASLD in primary care patients without clinically apparent liver disease using an automated, reflex-based approach. While most observational studies investigating the prevalence of MASLD and NASH within the normal ranges of ALT have been performed on patients with underlying liver disease, risk factors or raised liver enzymes, this study compared the prevalence of MASLD and advanced fibrosis at different ALT thresholds from a primary care cohort with no pre-existing liver disease that is socioeconomically diverse [16,17,30]. Lastly, the diagnostic criteria for MASLD within the iLFT algorithm includes a BMI of ≥25 kg/m2 and a negative liver aetiology screen which makes our cohort consistent with the definition of the most recent MASLD nomenclature [24,35]. Therefore, our results will remain relevant to previously published NAFLD studies but also generalisable to future studies involving MASLD patients [36,37].
4.1LimitationsOur study has several limitations. Currently the iLFT algorithm has a very strict definition of MASLD so many patients with MASLD currently would only have a descriptive LFT outcome i.e., abnormal ALT with negative aetiology screen, however such patients do have fibrosis scores performed and similar proportions have fibrosis, suggesting our findings are generalisable across a more relaxed MASLD diagnostic criterion.
From our results, 181 patients had ALT <30 U/L who cascaded and were given a MASLD diagnosis by iLFT. Despite the normal ALT levels, iLFT cascaded in these patients due to abnormal GGT values which also formed part of the diagnostic criteria for MASLD. We did not include these patients in our analysis as they did not meet the objectives of the current study and the iLFT diagnostic algorithm was not validated for ALT cut-offs below 30 U/L. Nevertheless, these patients were properly stratified by iLFT and referred to secondary care if needed. Despite a lower ALT threshold, many MASLD patients still have normal ALT levels, which means that there is a reservoir of MALSD patients who will be missed. Conversely, not all patients with elevated ALT have liver disease which limits its utility. Several community pathways within the UK have focused on identification of risk factor, such as type 2 diabetes and obesity for the detection of MASLD, rather than relying on singular LFT abnormalities. For example, the Nottingham liver disease stratification pathway that screens for risk factors such as harmful alcohol use, obesity, type 2 diabetes, and an elevated AST/ALT ratio for referral to TE clinics. This eliminates the need for LFTs, and the authors reported a 38.7 % increase in identification of advanced chronic liver disease, compared to guidelines established by the British Society of Gastroenterology which focuses on investigating abnormal LFTs [38]. Another population-based study in Barcelona proposed an algorithm focusing on risk factor identification (components of the metabolic syndrome, excessive alcohol consumption) for screening of advanced liver disease within the community [39]. Taken together, these studies indicate a shift towards risk factor identification for detecting chronic liver disease in the community rather than sole reliance on abnormal LFTs. In the case of iLFT, this may mean the introduction of risk factor screening into the algorithm.
Our patient cohort is also likely to be subjected to selection bias, since the decision to undertake iLFT investigation is based on suspicion of liver disease and may not be representative of the Tayside population. Lastly, we did not perform a health economic analysis on determine the cost-effectiveness of using a lower ULN of ALT to diagnose MASLD using iLFT, compared to the conventional diagnostic pathway. However, as iLFT was shown to be cost effective in the initial pilot study, it is likely that the additional costs incurred for automated reflex testing of abnormal LFTs and subsequent improved early detection of MASLD with advanced fibrosis will be significantly lower than the costs of medical treatment required if fibrotic liver disease and its complications develop.
5ConclusionsMASLD is one of the commonest global causes of chronic liver diseases, and advanced fibrosis and cirrhosis are associated with poor outcomes and increased mortality. This underscores the importance of early diagnosis for interventions and surveillance. We demonstrated that a significant proportion of patients with advanced fibrosis or cirrhosis have ALT levels within the conventional reference range, all of whom are at high risk of progressive disease. This may progress without overt clinical signs and symptoms, ultimately resulting in acute decompensation, which represents significant mortality and morbidity. A lower ULN of ALT in iLFT appears to be appropriate as part of a strategy to trigger further liver aetiological tests, resulting in a substantial increase in the positive diagnosis of MASLD patients with advanced fibrosis or cirrhosis in primary care, without adversely affecting clinical workloads in secondary care.
Data availability statementThe data supporting this study were obtained from routinely updated NHS health records in line with approval granted by the NHS Caldicott Guardian. The individuals to whom the data pertains did not explicitly consent to its use for research purposes. Therefore, it is not possible for the authors to share this data. Nevertheless, interested parties may submit requests for relevant data to NHS Tayside Information Governance by email on: informationgovernance.tayside@nhs.scot.
FundingThis research did not receive any specific grant from funding agencies in the public, commercial or not-for-profit sectors.
JL, CJB, PB and JFD designed the study. JL contributed to data collection. JL, CJB, PB and JFD contributed to data analysis and interpretation. All authors contributed to writing and editing of the final manuscript.


