


Background. Diagnosis of non-alcoholic fatty liver disease (NAFLD) is limited by the need for liver biopsies. Serum cytokeratin 18 (CK-18) levels have been investigated as potential biomarkers for the presence of NAFLD and non-alcoholic steatohepatitis (NASH). Herein, we assessed the correlation between CK-18 levels and NAFLD progression.
Material and methods. Serum CK-18 levels were estimated using the M30 antibody enzyme-linked immunosorbent assay in 147 patients diagnosed with NAFLD. In 72 patients, disease progression was evaluated by repeated liver biopsy, which was conducted after 4.3 ± 2.6 years. The relationship between the CK-18 levels and liver histological findings was assessed.
Results. The CK-18 levels were useful for identifying NAFLD patients with NAFLD activity scores (NAS) ≥ 5 (NAS ≥ 5 vs. < 4: 675.1 U/L vs. 348.7 U/L; p < 0.0001). A cut-off value of 375 U/L was calculated using the receiver operating characteristic curve approach, with a specificity and sensitivity of 81.5 and 65%, respectively, for the diagnosis of NASH. Among the 72 patients who underwent repeated liver biopsy, 11 patients with a progressed NAS also had significantly increased serum CK-18 levels (p < 0.01); in 30 patients with an improved NAS, there was a significant improvement in the mean CK-18 levels (p < 0.0001). The 31 patients with static NAS had static CK-18 levels.
Conclusions. In conclusion, serum CK-18 levels can predict NAS ≥ 5 in NAFLD patients. In NAFLD patients, serum CK-18 levels reflect NAS values and correlate with histological changes, and they appear to be useful indicators of progression and improvement.
Non-alcoholic fatty liver disease (NAFLD) is the most common chronic liver disease, recently reported to affect 30% of adults in Japan and the West.1,2 Based on histological disease activity, NAFLD is divided into non-alcoholic fatty liver (NAFL) and non-alcoholic steatohepatitis (NASH), with the former having a relatively good prognosis. However, NASH may progress to cirrhosis, and in some cases, hepatocellular carcinoma (HCC).3–5 Although liver biopsies are the current gold standard for diagnosing NASH, the procedure is invasive and cannot be ethically performed in all NAFLD patients. Recent studies have reported that serum cytokeratin (CK)-18 is useful for diagnosing NASH and NAFLD.6–11 However, the diagnosis and management of NAFLD practice guidelines established by the American Association for the Study of Liver Diseases, American College of Gastroenterology, and American Gastroenterological Association state that although serum/plasma CK-18 is a promising biomarker for identifying steatohepatitis, its use in routine clinical practice is premature.12
CK-18 is an intermediate filament protein present in large quantities in the liver, accounting for 5% of liver proteins. During cellular apoptosis, CK-18 is cleaved at Asp396, and the CK-18 fragments are recognized by an M30 antibody specific for the liberated C-terminus. Thus, CK-18 is a marker of hepatocyte apoptosis.13 The present study examined the significance of serum CK-18 as a non-invasive biomarker in NAFLD patients undergoing liver biopsies. Additionally, we investigated the relationship between serum CK-18 levels and liver histological assessments, as well as the corresponding changes in serum CK-18 levels and liver histological assessments over time.
Experimental ProceduresPatientsA total of 147 patients with NAFLD [mean age, 56.5 years (range, 19-78 years); 69 (47.2%) males] were enrolled in this study. All the patients underwent a liver biopsy at Kawasaki Hospital in Okayama, Japan, between 2007 and 2012. After a mean follow-up period of 4.3 ± 2.6 years, 72 patients underwent a repeated liver biopsy to determine any pathologic change. The study protocol was approved by the local ethics committee, and all patients provided written informed consent.
Diagnostic criteriaA diagnosis of NAFLD was made according to the following criteria:
- •
Alcohol intake of ≤ 20 g/day;
- •
The absence of detectable hepatitis B surface antigen or hepatitis C virus ribonucleic acid, and the exclusion of autoimmune liver disease, drug-induced liver injury, or metabolic liver disease (e.g., Wilson’s disease, hemochromatosis); and
- •
The presence of steatosis (> 30%) or steatohepatitis.
Biopsies were evaluated by two expert pathologists, and the liver biopsy features were also graded according to the NAFLD activity score (NAS) system proposed by Kleiner, et al.14 NAFLD patients were divided into two groups: NAS ≥ 5 or NAS ≤ 4. Furthermore, the individual NAFLD histological features were scored for lobular inflammation (0-3), portal inflammation (0-3), steatosis (0-3), hepatocellular ballooning (0-2), Mallory bodies (0-1), and fibrosis [0-4 (1:1A, 1B, and 1C)], as described by the NASH Clinical Research Network.14 Serum CK-18 levels were examined in terms of their relationship to the NAS score, fibrosis stage, lobular inflammation, portal inflammation, steatosis, hepatocellular ballooning, and the presence of Mallory bodies. In addition, in the 72 patients who underwent repeated liver biopsies, a two-point decrease in the NAS values was considered improved, a two-point increase was considered progressed; and other score changes were considered static.15
CK-18 level measurementsBlood samples were taken from all the patients at the time of liver biopsy, and they were stored at -80°C Serum CK-18 levels were measured using an M30-apoptosis enzyme-linked immunosorbent assay kit (Pivka, Bromma, Sweden).
Statistical analysisContinuous variables were expressed as a mean ± standard deviation or a median (interquartile range [IQR]), as appropriate. Changes in the continuous variables were assessed using the paired t-test or Wilcoxon rank-sum test. Variables between patients with and without an increased NAS were compared using an unpaired t-test and Wilcoxon rank-sum test. In addition, the Wilcoxon rank-sum test and Bonferroni correlation coefficients were used to assess associations between the CK-18 levels and histological features. A receiver operating characteristics analysis was used to determine the role of CK-18 levels in the diagnosis of NAS ≥ 5. The area under the receiver operating characteristics curve (AUC) was assessed, and internal validation was performed using bootstrap resampling to calculate an optimism factor; the bias-corrected AUC was obtained by subtracting this optimism value from the AUC, which was directly measured from the original dataset. A p-value < 0.05 was considered statistically significant. All the statistical analyses were performed using SAS software (SAS Institute, Tokyo, Japan).
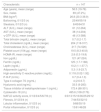
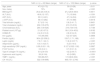
ResultsThe patients’ demographics and serology results are shown in table 1. The characteristics of the patients, after being grouped according to their NAS values, are shown in table 2. This table shows the comparative values between a NAS ≤ 4 and a NAS ≥ 5 in NAFLD patients. Changes in the patients’ characteristics for individuals who underwent repeat biopsies are shown in table 3.
Clinical and histological characteristics of 146 patients with non-alcoholic fatty liver disease (NAFLD).
| Characteristic | n = 147 |
|---|---|
| Age (years), mean (range) | 56.5 (19-78) |
| Sex, males | 69 (47.2%) |
| BMI (kg/m2) | 26.8 (20.3-38.9) |
| Ballooning, 0/1/2/3 (n) | 23/49/55/19 |
| Steatosis, 0/1/2/3 (n) | 6/45/64/31 |
| ALT (IU/L), mean (range) | 61 (12-264) |
| AST (IU/L), mean (range) | 38 (14-204) |
| γ-GTP (IU/L), mean (range) | 46 (13-388) |
| Total bilirubin (mg/dL), mean (range) | 0.7 (0.2-1.7) |
| Total cholesterol (ng/dL), mean (range) | 204 (118-317) |
| Cholinesterase (IU/L), mean (range) | 217 (74-526) |
| Platelet count (104/μg), mean (range) | 19.5 (8.3-40.8) |
| HOMA-IR, mean (range) | 2.8 (0.3-19.8) |
| Iron (µg/dL) | 121 (47-224) |
| Ferritin (ng/dL) | 125 (1.7-1188) |
| Leptin (ng/dL) | 10.2 (1.1-37.7) |
| Adiponectin (μg/mL) | 5.3 (1.9-23.7) |
| High-sensitivity C-reactive protein (mg/dL) | 0.118 (0.02-1.92) |
| P-III-P (U/mL) | 0.7 (0.4-1.3) |
| Type 4 collagen 7S (ng/mL) | 4 (2.6-6.7) |
| Hyaluronic acid (ng/mL) | 33.5 (9-283) |
| Tissue inhibitor of metalloproteinase-1 (ng/mL) | 172.4 (88-301) |
| Cytokeratin-18 (U/L) | 495.6 (108-2176) |
| NAFLD activity score, 0/1/2/3/4/5/6/7/8 (n) | 0/0/13/15/16/36/25/29/12 |
| Fibrosis, 0/1/2/3/4 (n) | 7/44/53/32/10 |
| Lobular inflammation, 0/1/2/3 (n) | 9/68/50/19 |
| Portal inflammation, 0/1/2/3 (n) | 13/61/46/26 |
BMI: body mass index. ALT: alanine aminotransferase. AST: aspartate aminotransferase. γ-GTP: gamma-glutamyl transpeptidase. HOMA-IR: homeostasis model assessment-estimated insulin resistance. P-III-P: procollagen peptide type III.
Patients classified with non-alcoholic fatty liver disease (NAFLD) activity score (NAS) values ≤ 4 or ≥ 5.
| NAS ≤ 4 (n = 43) Mean (range) | NAS ≥ 5 (n = 103) Mean (range) | p-value | |
|---|---|---|---|
| Age, years | 47.9 (21-72) | 59 (19-28) | < 0.01 |
| Sex, males | 70% | 38% | < 0.001 |
| BMI (kg/m2) | 26.2 (20.3-35.4) | 27.2 (20.6-38.9) | 0.0611 |
| ALT (IU/L) | 48.9 (12-137) | 71 (13-264) | < 0.001 |
| AST (IU/L) | 30.3 (14-81) | 47 (14-204) | < 0.0001 |
| γ-GTP (lU/L) | 68 (13-282) | 47 (13-388) | 0.6418 |
| Total bilirubin (mg/dL) | 0.7 (0.2-1.4) | 0.8 (0.4-1.7) | 0.9431 |
| Total cholesterol (ng/dL) | 202 (135-275) | 219 (74-519) | 0.6337 |
| Cholinesterase (IU/L) | 264 (139-526) | 219 (104-519) | 0.7184 |
| Platelet count (104/μg) | 21 (8.3-37.5) | 19.6 (10.4-40.8) | 0.9162 |
| HOMA-IR | 2.4 (0.3-10.2) | 2.8 (2.5-4.5) | 0.1359 |
| Iron (μg/dL) | 115 (48-208) | 122 (47-224) | 0.3866 |
| Ferritin (ng/dL) | 96.4 (22-358.2) | 159.7 (1.7-1,188) | < 0.01 |
| Leptin (ng/dL) | 7.9 (1.1-24.1) | 11.8 (2.3-37.7) | < 0.001 |
| Adiponectin (µg/mL) | 6.0 (1.9-23.7) | 5 (2.5-14.5) | 0.2747 |
| High-sensitivity CRP (mg/dL) | 0.09 (0.02-1.19) | 0.127 (0.022-1.92) | 0.0997 |
| P-III-P (U/mL) | 0.6 (0.4-1) | 0.7 (0.5-1.3) | < 0.001 |
| Type 4 collagen 7S (ng/mL) | 3.6 (2.6-5.9) | 4.2 (2.8-6.7) | < 0.0001 |
| Hyaluronic acid (ng/mL) | 26 (9-104) | 43 (9-283) | < 0.001 |
| TIMP-1 (ng/mL) | 158 (88-257) | 174 (96.8-302) | < 0.001 |
| CK-18 (U/L) | 322 (108-898) | 605 (151-2,746) | < 0.001 |
NASH: non-alcoholic steatohepatitis. BMI: body mass index. ALT: alanine aminotransferase. AST: aspartate aminotransferase. γ-GTP: gamma-glutamyl transpeptidase. HOMA-IR: homeostasis model assessment-estimated insulin resistance. P-III-P: procollagen peptide type III. CRP: C-reactive peptide. TIMP: tissue inhibitor of metalloproteinase. CK: cytokeratin.
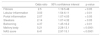
Clinical characteristics and biomarkers for 72 non-alcoholic fatty liver disease patients who underwent repeated liver biopsies 4.3 ± 2.6 years (mean) after the first biopsy.
| First biopsy Mean (range) | Repeated biopsy Mean (range) | p-value | |
|---|---|---|---|
| Age, years | 54 (19-74) | 59 (21-78) | 0.1375 |
| Sex, males | 47% | 47% | 1 |
| BMI (kg/m2) | 27 (20.7-38.9) | 26 (20.3-36.2) | 0.1679 |
| ALT (IU/L) | 82 (18-264) | 37 (12-229) | < 0.0001 |
| AST (IU/L) | 51 (18-264) | 31 (14-110) | < 0.0001 |
| γ-GTP (IU/L) | 59 (20-282) | 33 (13-338) | < 0.0001 |
| Total bilirubin (mg/dL) | 0.7 (0.2-1.7) | 0.8 (0.3-1.5) | 0.8725 |
| Total cholesterol (ng/dL) | 208 (118-299) | 200 (121-317) | 0.0643 |
| Cholinesterase (IU/L) | 203 (74-506) | 302 (108-526) | 0.0003 |
| Platelet count (104/µg) | 19.5 (10.4-39.4) | 20 (8.3-40.8) | 0.6909 |
| HOMA-IR | 3 (0.3-19.8) | 2.7 (0.3-7.6) | 0.0545 |
| Iron (µg/dL) | 121 (47-224) | 121 (48-222) | 0.8526 |
| Ferritin (ng/dL) | 230 (18-950) | 103 (1.7-1188) | < 0.0001 |
| Leptin (ng/dL) | 11.7 (2.2-27.4) | 8.9 (1.1-37.7) | 0.0423 |
| Adiponectin (μg/mL) | 5.3 (1.9-13.9) | 5.3 (2.4-23.7) | 0.9222 |
| High-sensitivity CRP (mg/dL) | 0.136 (0.03-0.75) | 0.143 (0.02-0.19) | 0.0063 |
| P-III-P (U/mL) | 0.7 (0.4-1.3) | 0.6 (0.4-1.1) | < 0.0001 |
| Type 4 collagen 7S (ng/mL) | 4.2 (2.6-6.7) | 3.7 (2.8-5.9) | 0.0052 |
| Hyaluronic acid (ng/mL) | 32 (9-283) | 34.5 (10-215) | 0.3447 |
| TIMP-1 (ng/mL) | 182 (88-301) | 156 (112-243) | 0.0002 |
| CK-18 (U/L) | 495.6 (88-301) | 435 (109-2663) | 0.0072 |
BMI: body mass index. ALT: alanine aminotransferase. AST: aspartate aminotransferase. γ-GTP: gamma-glutamyl transpeptidase. HOMA-IR: homeostasis model assessment-estimated insulin resistance. P-III-P: procollagen peptide type III. CRP: C-reactive peptide. TIMP: tissue inhibitor of metalloproteinase. CK: cytokeratin.
Among the study population, the mean serum CK-18 levels increased as the NAS values increased (p < 0.0001) (Figure 1A). When comparing the NAS ≥ 5 and NAS ≤ 4 groups, the NAS ≥ 5 group showed significantly higher serum CK-18 levels (675.1 U/L vs. 348.7 U/L; p < 0.0001). As a result, CK-18 was determined to have a cut-off value of 375 U/L, and an AUC of 0.79 (95% confidence interval [CI]: 1.1 [65–81.5], P < 0.001) (p < 0.0001) (Figure 1B). The cut-off value had a sensitivity of 81.5%, specificity of 65%, positive predictive value of 80.8%, and a negative predictive value of 43.1%. Therefore, serum CK-18 levels were determined to be useful for diagnosing NASH (Figure 2).
 levels and the non-alcoholic fatty liver disease activity score (NAS) values show that serum CK-18 levels increase as the mean NAS increases (A). In addition, the NAS ≥ 5 group shows significantly higher serum CK-18 levels (675.1 U/L) than the NAS ≤ 4 group (348.7 U/L). The box plot shows the median, first and third quartiles, and standard deviations of the values.")
A comparison of serum cytokeratin 18 (CK-18) levels and the non-alcoholic fatty liver disease activity score (NAS) values show that serum CK-18 levels increase as the mean NAS increases (A). In addition, the NAS ≥ 5 group shows significantly higher serum CK-18 levels (675.1 U/L) than the NAS ≤ 4 group (348.7 U/L). The box plot shows the median, first and third quartiles, and standard deviations of the values.
 for the diagnosis of NAS ≥ 5. A receiver-operating characteristic curve shows the accuracy of the serum CK-18 levels for predicting the presence of non-alcoholic steatohepatitis in liver biopsies (n = 146) and validation patients (n = 72). The ideal area under the curve is 1.00.")
Use of cytokeratin-18 (CK-18) for the diagnosis of NAS ≥ 5. A receiver-operating characteristic curve shows the accuracy of the serum CK-18 levels for predicting the presence of non-alcoholic steatohepatitis in liver biopsies (n = 146) and validation patients (n = 72). The ideal area under the curve is 1.00.
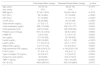
In a comparative examination of serum CK-18 levels and the histology assessment, serum CK-18 levels increased significantly with an increased evidence of fibrosis (Figure 3A), as well as with an increased lobular inflammation, portal inflammation, and steatosis (Figures 3B-3D). Serum CK-18 levels also correlated with hepatocellular ballooning and the presence of Mallory bodies (Figures 3E-3F). The correlations between the liver histology assessments and serum CK-18 levels are summarized in table 4. Serum CK-18 levels correlated with fibrosis, inflammation, steatosis, Mallory bodies, and NAS. The odds ratio for a correlation between serum CK-18 levels and Mallory bodies was particularly high.
 levels. A. Mean serum CK-18 levels increase as the fibrosis stage progresses (p < 0.05). B. Mean serum CK-18 levels increase as lobular inflammation increases (p < 0.01). C. Mean serum CK-18 levels increase as portal inflammation increases (p < 0.05). D. There is no correlation between steatosis and mean serum CK-18 levels < 0.01. E. Mean serum CK-18 levels increase as hepatocellular ballooning increases (p < 0.0001). F. A strong correlation is observed between serum CK-18 levels and the presence of Mallory bodies (p < 0.0001).")
Histology and serum cytokeratin-18 (CK-18) levels. A. Mean serum CK-18 levels increase as the fibrosis stage progresses (p < 0.05). B. Mean serum CK-18 levels increase as lobular inflammation increases (p < 0.01). C. Mean serum CK-18 levels increase as portal inflammation increases (p < 0.05). D. There is no correlation between steatosis and mean serum CK-18 levels < 0.01. E. Mean serum CK-18 levels increase as hepatocellular ballooning increases (p < 0.0001). F. A strong correlation is observed between serum CK-18 levels and the presence of Mallory bodies (p < 0.0001).
Correlation between cyrokeratin-18 in the plasma and the histologic characteristics.
| Odds ratio | 95% confidence interval | p-value | |
|---|---|---|---|
| Fibrosis | 2.5 | 1.19-5.48 | < 0.05 |
| Lobular inflammation | 3.03 | 1.54-6.11 | < 0.01 |
| Portal inflammation | 2.07 | 1.07-4.05 | < 0.05 |
| Steatosis | 2.14 | 1.07-4.32 | < 0.05 |
| Ballooning | 4.37 | 1.45-16.2 | < 0.01 |
| Mallory body | 5.21 | 2.28-13.1 | < 0.0001 |
| NAS score | 6.41 | 2.97-15.1 | < 0.0001 |
NAS: non-alcoholic fatty liver disease activity score.
In the 72 NAFLD patients who underwent repeated biopsies, the clinical characteristics and biomarker data for both biopsies are shown in table 3. Overall, alanine aminotransferase, aspartate aminotransferase, gamma-glutamyl transpeptidase, ferritin, fibrosis markers, and serum CK-18 levels reduced.
Correlation between changes in the NAS scores and serum CK-18 levelsChanges in the NAS and serum CK-18 levels were examined in the 72 NAFLD patients, and in 11 patients with a higher NAS, serum CK-18 levels significantly increased upon re-biopsy (p < 0.01) (Figure 4A). Those with a static NAS did not demonstrate changes in the CK-18 level (Figure 4B), and 30 patients with an improved NAS showed improved CK-18 levels (p < 0.0001) (Figure 4C). These results indicate the possibility that serum CK-18 levels reflect NAS more than they reflect fibrosis staging.
 levels and the non-alcoholic fatty liver disease activity score (NAS) values are examined in patients who underwent repeated biopsies. The mean serum CK-18 level increases in cases in which the NAS increases (A), whereas the mean serum CK-18 level is static in patients in which the NAS value is also static (B). The mean serum CK-18 level declines in patients in which the NAS is improved (C). The individual data points are shown.")
Changes in mean serum cytokeratin 18 (CK-18) levels and the non-alcoholic fatty liver disease activity score (NAS) values are examined in patients who underwent repeated biopsies. The mean serum CK-18 level increases in cases in which the NAS increases (A), whereas the mean serum CK-18 level is static in patients in which the NAS value is also static (B). The mean serum CK-18 level declines in patients in which the NAS is improved (C). The individual data points are shown.
The diagnosis of NASH, which has rapidly improved in recent years, currently requires an invasive liver biopsy. From safety and economic standpoints, liver biopsies are not feasible in all NAFLD patients. Therefore, an increasing number of studies are investigating potentially useful diagnostic biomarkers.16–18 The current American guidelines for the diagnosis and management of NAFLD indicate that serum CK-18 levels may be useful for distinguishing steatohepatitis; however, their recommended use in routine clinical practice has been suggested to be premature.11
Cells are composed of fine fibers, microtubules, and intermediate filaments. Intermediate filaments are composed of a 1:1 ratio of CK-18 and CK-8, with CK-18 accounting for 5% of the total liver protein. During apoptosis, caspase-3 cleaves and degrades CK-18, resulting in the release of the degradation product, M30. Antibodies to M30 are known to reflect epithelial cell apoptosis.13 In addition, as a component of Mallory bodies, which develop in various hepatic diseases (including alcoholic liver disease, NASH, primary biliary cirrhosis, and hepatoma), CK-18 reportedly contributes to the progression and activity of various hepatic diseases.19 Histologically, Mallory bodies are frequently observed in NASH patients. In the present study, serum CK-18 levels were highly correlated with the presence or absence of Mallory bodies.
Serum CK-18 levels, in 44 NAFLD patients who underwent biopsies, were reported by Wieckowska, et al. to be significantly higher in NASH patients (765.7 U/L) than in NAFLD patients (202.4 U/L) or healthy individuals (215.5 U/L).12 In a multicenter study by the United States NASH Clinical Research Network, serum CK-18 levels were analyzed in 139 NAFLD patients, and they were highly correlated with steatosis, hepatocellular ballooning, inflammatory cell infiltration, and hepatic fibrosis. A cut-off value of 216-287 U/L was determined, as well as a sensitivity and specificity of 65-77% and 65-92%, respectively, demonstrating a high accuracy for distinguishing between NASH and NAFLD.20 In a meta-analysis on NAFLD, the area under the receiver operator characteristic curve was 0.82, with sensitivity and specificity values of 78 and 87%, respectively, further demonstrating that CK-18 is a useful marker for detecting NASH.21 Recently, a combination of adipocyte fatty acid binding protein, apoptosis marker soluble Fas ligand,7 computed tomography findings,9 and serum CK-18 levels were reported to further improve the ability to diagnose NASH. In our study, serum CK-18 levels increased in NAFLD patients in conjunction with the NAS, making these levels useful for distinguishing between a NAS ≥ 5 and a NAS ≤ 4 in individuals with NAFLD.
In the past, we reported that serum CK-18 levels in NAFLD patients correlate with alanine aminotransferase, aspartate aminotransferase, and gamma-glutamyl transpeptidase levels, as well as homeostasis model assessment-estimated insulin resistance, ferritin levels, fibrosis markers, the tissue inhibitor of metalloproteinase-1, and the procollagen peptide type III.17 In the present study, a histological examination of the liver revealed that serum CK-18 levels correlated with the fibrosis stage, lobular inflammation, portal inflammation, steatosis, hepatocellular ballooning, and presence of Mallory bodies; the correlation with the presence of Mallory bodies was particularly strong. Other reports have also described similar correlations between the CK-18 levels and histological observations,21, 22 including in children.20
Changes in serum CK-18 levels in NAFLD patients who have undergone repeated biopsies have only been previously reported in small numbers of patients, and the investigations were not detailed.8,23 In 10 patients progressing from non-NASH to NASH, between consecutive biopsies, Shen, et al. reported increased CK-18 levels in 8 patients; among 8 patients regressing from NASH to non-NASH, they reported a decrease in CK-18 levels in 7.8 For the 72 NASH cases in our study, changes in serum CK-18 levels were examined in conjunction with changes in the liver histology assessments and NAS values. NAS progression accompanied worsening CK-18 levels, remained static when the NAS values remained stationary, and improved when the CK-18 levels improved. Improvements in hepatic inflammation and steatosis resulted in improved hepatic fibrosis, whereas progressive hepatic inflammation and steatosis led to fibrosis progression. The aforementioned findings indicated that changes in serum CK-18 levels reflect changes in the presence of Mallory bodies and NAS values better than they reflect changes in fibrosis.
In conclusion, the findings of our study demonstrate that serum CK-18 is a non-invasive, simple, and reliable biomarker for NAS ≥ 5 within the spectrum of NAFLD. In addition, serum CK-18 levels reflect the mean patient NAS values, and they appear to be useful indicators of NAFLD progression and improvement, suggesting that they are also useful for monitoring disease status and assessing treatment response in patients with NAFLD. However, examination of the long-term prognosis of NASH, using CK-18 levels, and the further examination of CK-18 levels in NAFLD patients are necessary in clinical practice.
Abbreviations- •
CK-18: cytokeratin 18.
- •
NAFLD: non-alcoholic fatty liver disease.
- •
NASH: non-alcoholic steatohepatitis.
- •
NAS: non-alcoholic fatty liver disease activity score.
All authors declare no conflicts of interest.


