


Edited by: Brij B. Gupta, Kwok Tai Chui
More infoThe agricultural ecological environment is the premise and foundation of rural economic development and the rural economy is an important manifestation of the vitality of the agricultural ecological environment. Taking 14 prefecture-level cities in Guangxi as the research object, this paper collects and sorts out the relevant data indicators of rural economy and agricultural ecological environment of them from 2007 to 2019, constructs the evaluation index system, calculates the development index by using the comprehensive index function, and finally uses an innovative digitization evaluation scheme to further evaluate the spatiotemporal coupling and coordination relationship between the rural economy and agricultural ecological environment. The following conclusions are ultimately drawn. First, the comprehensive level index of the rural economy shows linear growth with unbalanced regional development (values from 0.306 to 0.598). Second, the comprehensive index of the agricultural ecological environment shows fluctuating growth with obvious regional differences (values from 0.264 to 0.483). Third, the development of rural economy and agricultural ecological environment is not synchronized, and there is mutual influence. Fourth, the coordination level of the rural economy and agricultural ecological environment is low (coupling values from 0.369 to 0.513). Then, policy inspirations are proposed. First, the investment in agricultural science and technology innovation should be increased and the modern agricultural technology system. Second, agricultural industrial structure should be optimized and the agricultural industrial chain. Third, the construction of agricultural infrastructure should be improved, and the high-quality development of agriculture should be promoted. Fourth, the education of ecological civilization should be strengthened, and awareness of ecological and environmental protection should be established. Fifth, they should strengthen education and training and cultivate new professional farmers. Sixth, they should improve the utilization rate of land and enhance the arable land production capacity.
China is essentially a large agricultural country. The rural economy is the lifeblood of China's national economy. The level of economic development in rural areas will directly affect the level of social development. Since the implementation of the Rural Revitalization policy, the reform of rural economic development has continuously liberated rural productivity, greatly improved farmers' enthusiasm, and continuously condensed into a powerful driving force to promote agricultural production and rural economic development. The acceleration of rural economic construction and the continuous expansion of agricultural production activities, not only improve people's living standards but also bring a series of ecological and environmental problems, which seriously affect the harmonious development of man and nature. The alarming state of the environment in many countries has aroused growing interest in addressing current problems without compromising future generations (Méndez-Picazo, Galindo-Martín & Castaño-Martínez, 2021) .
Rural ecological environmentThe agricultural ecological environment refers to the various elements that can directly or indirectly affect human agricultural development. These elements are the necessary conditions for agricultural development and important material wealth for human agricultural production. The process of human agricultural production will lead to some agricultural ecological environment problems, resulting in various negative effects endangering human survival. For example, agricultural ecological environment damage and pollution caused by agricultural production activities, soil erosion, ecosystem imbalance, land desertification, etc. (Yang, Zhang & Jia, 2019;Liu, Sun & Wang, 2020). Currently, the reasonable development and utilization of agricultural ecological resources and the realization of sustainable agriculture has attracted great attention. Australia is exploring urban agriculture as a nature-based solution to mitigate the impact of extreme climate change (Kingsley, Egerer & Nuttman, 2021) . When navigating the COVID-19 pandemic, India explored the impact of climate factors such as relative humidity, pressure and temperature on economic vulnerability (Jha, Goyal & Gupta, 2021).The EU has implemented the supervision and incentive plan for individual farms to control agricultural diffusion pollution (Laurence, Amblard,2021;Ariken, Zhang & Chan, 2021). The Ministry of Agriculture and Rural Areas of China has issued technical guidance on green agricultural development (2018–2030) to promote green agricultural development and solve major development problems such as the reduction of agricultural resources, prominent environmental problems, and ecosystem degradation (Hong, M.Y.&Zheng, L.N., 2020).
Coupling modelThe term "coupling" is a professional term in physics. It is used to describe the motion system composed of different elements or objects. Each element or object in the system has an interactive relationship, which affects each other's motion state(Jie, Xiao & Lan, 2021). We use this to a analyze the evolutionary relationship between different systems through the space-time dimension(Ruan, W. & Li, Y.,2019). Our economic system is highly dependent on the environment; traditional business activities in response to market demands can affect the consumption of natural resources and damage environmental systems (M.T. Majeed &, I. Ozturk,2020;Yang Ye & Hongfei Qiu, 2021). The coupling and coordination development of the environment and economy (CC2E) is one of the most vital issues facing sustainable development (Deng, Chen & Tao, 2022) . A coupling relationship refers to the dependence, promotion, and coordination relationship between two or more systems (Yang et al., 2019) . The relationship between the economy and the ecological environment is highly correlated, and the internal factors are closely combined to form an interactive coupling system. This paper reveals the coupling relationship between urbanization and the ecological environment from a theoretical point of view, and holds that coordinating the relationship between economic development and the ecological environment brought about by urbanization has become a global strategic and scientific problem (Fang, Cui & Deng, 2020) . Wang, Wang and Li (2019) studied the coupled and coordinated development of energy, the economy, and the ecological environment in Australia and found that these three systems form a complex system that can jointly promote the sustainable development of society through appropriate coordination.Hou, Chen and Long (2021) from the perspective of green production analyzed and measured the coupling coordination among the economy, ecological environment and health system of green production in China from 2009 to 2016 to clarify the internal relationship and coupling coordination mechanism of the coordinated development of the economy, ecological environment and health system. Yang, Wang and Tan (2021) based on data from China's tourism industry and ecological environment from 2005 to 2018, used the entropy method and coupling coordination degree model to prove that active economic policies are needed to promote the coordinated development of the two. Qian, Chen (2021) proposed a study on the coordination degree of regional economy-ecological environment coupling in the Yangtze River Economic Belt. Comprehensive analysis found that only sustainable development of ecological environment protection and long-term economic development can continuously optimize the Yangtze River Economic Belt. Zhang, Dawei &Cao, Xinghua (2021) took the ecological economic zone of Aba Prefecture in western China as the research object, and they used the coupled coordinated development model to evaluate the ecological environment and economic coupling coordination of Aba Prefecture from 2008 to 2017. Cheng, Luo and Xiang (2021) took nine cities in Fujian Province as examples, analyzing the development level and overall coordination of the tea industry, tourism economy and ecological environment in Fujian Province. The interaction between the subsystems of the tourism-eco-environment composite (TI-EE) system was analysed by Li, Weiyun (2021) , and an EIS was constructed to assess the CCD quality of the TI-EE system.
Therefore, according to the current situation of China's economic and environmental development, Tan, Liu and Han (2021)) proposed that land development and resource and environmental protection should be combined to promote regional coordinated development. Wu, Zhou and Niu (2021) suggested that decision-makers should pay attention to coordinating with the ecological environment while seeking resource exploitation to improve economic development. Guo, Lifeng (2021) , taking Northwestern China's Shaanxi Province as the object, constructed a comprehensive evaluation system (CES) for new urbanization and a CES for the eco-environment. The coordinated development between the two systems is largely driven by per capita gross domestic product (GDP) in the new urbanization system and the park area in the eco-environment system. He, Luo and Guo (2021) believes that the green coverage rate of built-up areas is the most important indicator affecting coordinated development. Economic development is coordinated with environmental development, and the main problem to be solved is population urbanization and social urbanization. Xu, Xueguo and Zhou, Yanfei (2021) aim to find a method to realize regional coordinated development from the perspectives of technological innovation (TI), industrial upgrading (IU) and ecological environment (EE) as well as their interactions. Yu, Jiangbo (2021) propose a model for the coupling of the total control of pollutants in the water environment of the Yellow River basin and urban economic development to improve the water environment of the Yellow River basin and increase the economic level of the city. Huang, Jinghan and Li, Fei (2021) proposed that the construction of the Green Belt and Road is an important part of the transformation of the regional economy to green development, so the formulation of policies to promote green and coordinated development should be based on differentiated strategies to adapt to local conditions. Li, Yuan and Qin (2022))) believed that public demand for urban green growth varies greatly due to climatic conditions, resource endowment, geographical location and other factors. Therefore, understanding public demand is of great significance to optimize the relationship between the environment and economy. Dong, Shang and Ali (2021) and Fang, Chuanglin et al. (2021) based on the current situation of the coordinated development of new urbanization and the ecological environment in provinces, regions and cities; have suggested the promotion of a coordinated development of urbanization and the ecological environment according to local conditions, as well as the bolstering of the market mechanism of urbanization and the optimization of the industrial layout.
Generally, there are many studies on the economy and ecological environment, but there are also some omissions. There are few cross studies on rural economy and agricultural ecological environment. The coupling model is mostly used for the overall social economy and environmental evaluation and is rarely used to analyze the relationship between the rural economy and the agricultural ecological environment system. The research mainly focuses on a unilateral time or space and lacks research on different perspectives of time and space. Based on this, this paper will take 14 prefecture-level cities in Guangxi as an example to construct the quantitative evaluation index system of rural economy and agricultural ecological environment, use an innovative digitization evaluation scheme to evaluate and discuss the correlation between the rural economy and agricultural ecological environment in Guangxi from the perspective of time and space, and explore their coupling and coordinated development path. This paper will aim to accomplish several things. (1)It deeply understands the situation of rural economic development and agro-ecological environmental protection in Guangxi, explores the coupling and coordination between the two, and finds breakthroughs and entry points for the healthy development of the two systems. (2) The intrinsic coupling mechanism between the two is comprehensively and systematically explored to further deepen the theoretical knowledge of the coordinated development of rural economic development and the agricultural ecological environment and enrich the theoretical system in related fields. (3)Based on the research results, we propose relevant countermeasures to provide guidance and reference for promoting economic and social development in Guangxi, promoting high-quality agricultural development and rural ecological civilization construction, improving the effectiveness and science of agricultural and rural ecological environmental protection work, and realizing the harmonious coexistence of humans and nature.
The structure of the paper is as follows: Section 2 introduces the general situation and research framework of the study area. Section 3 introduces the entropy method, index system, and data sources and measures and analyses the comprehensive level of the rural economy and agricultural ecological environment in Guangxi. Section 4 introduces the innovative digitization evaluation scheme and analyses the coupling development of the rural economy and agricultural ecological environment in Guangxi. Section 5 summarizes the analysis results and proposes countermeasures.
Materials and methodsOverview of the study areaGuangxi is located in the western part of South China. It is the only coastal autonomous region in China and the only province in China connected with ASEAN by sea and land. Its strategic position and unique role in advancing the “Belt and Road” and the building of a China-ASEAN community with a shared future have become increasingly prominent. Guangxi has a subtropical monsoon climate, with abundant rain water, abundant sunlight and abundant heat resources, suitable for the growth of various animals and plants. The advantageous geographical location, abundant natural resourceos and sufficient labor force provide important conditions for Guangxi's agricultural development. In recent years, relying on geographical advantages, Guangxi has opened up and cooperated with ASEAN to vigorously develop agriculture. The rapid economic development, various constructions consume a lot of natural resources, and the external negative effects of disturbance to the ecological environment are significant.
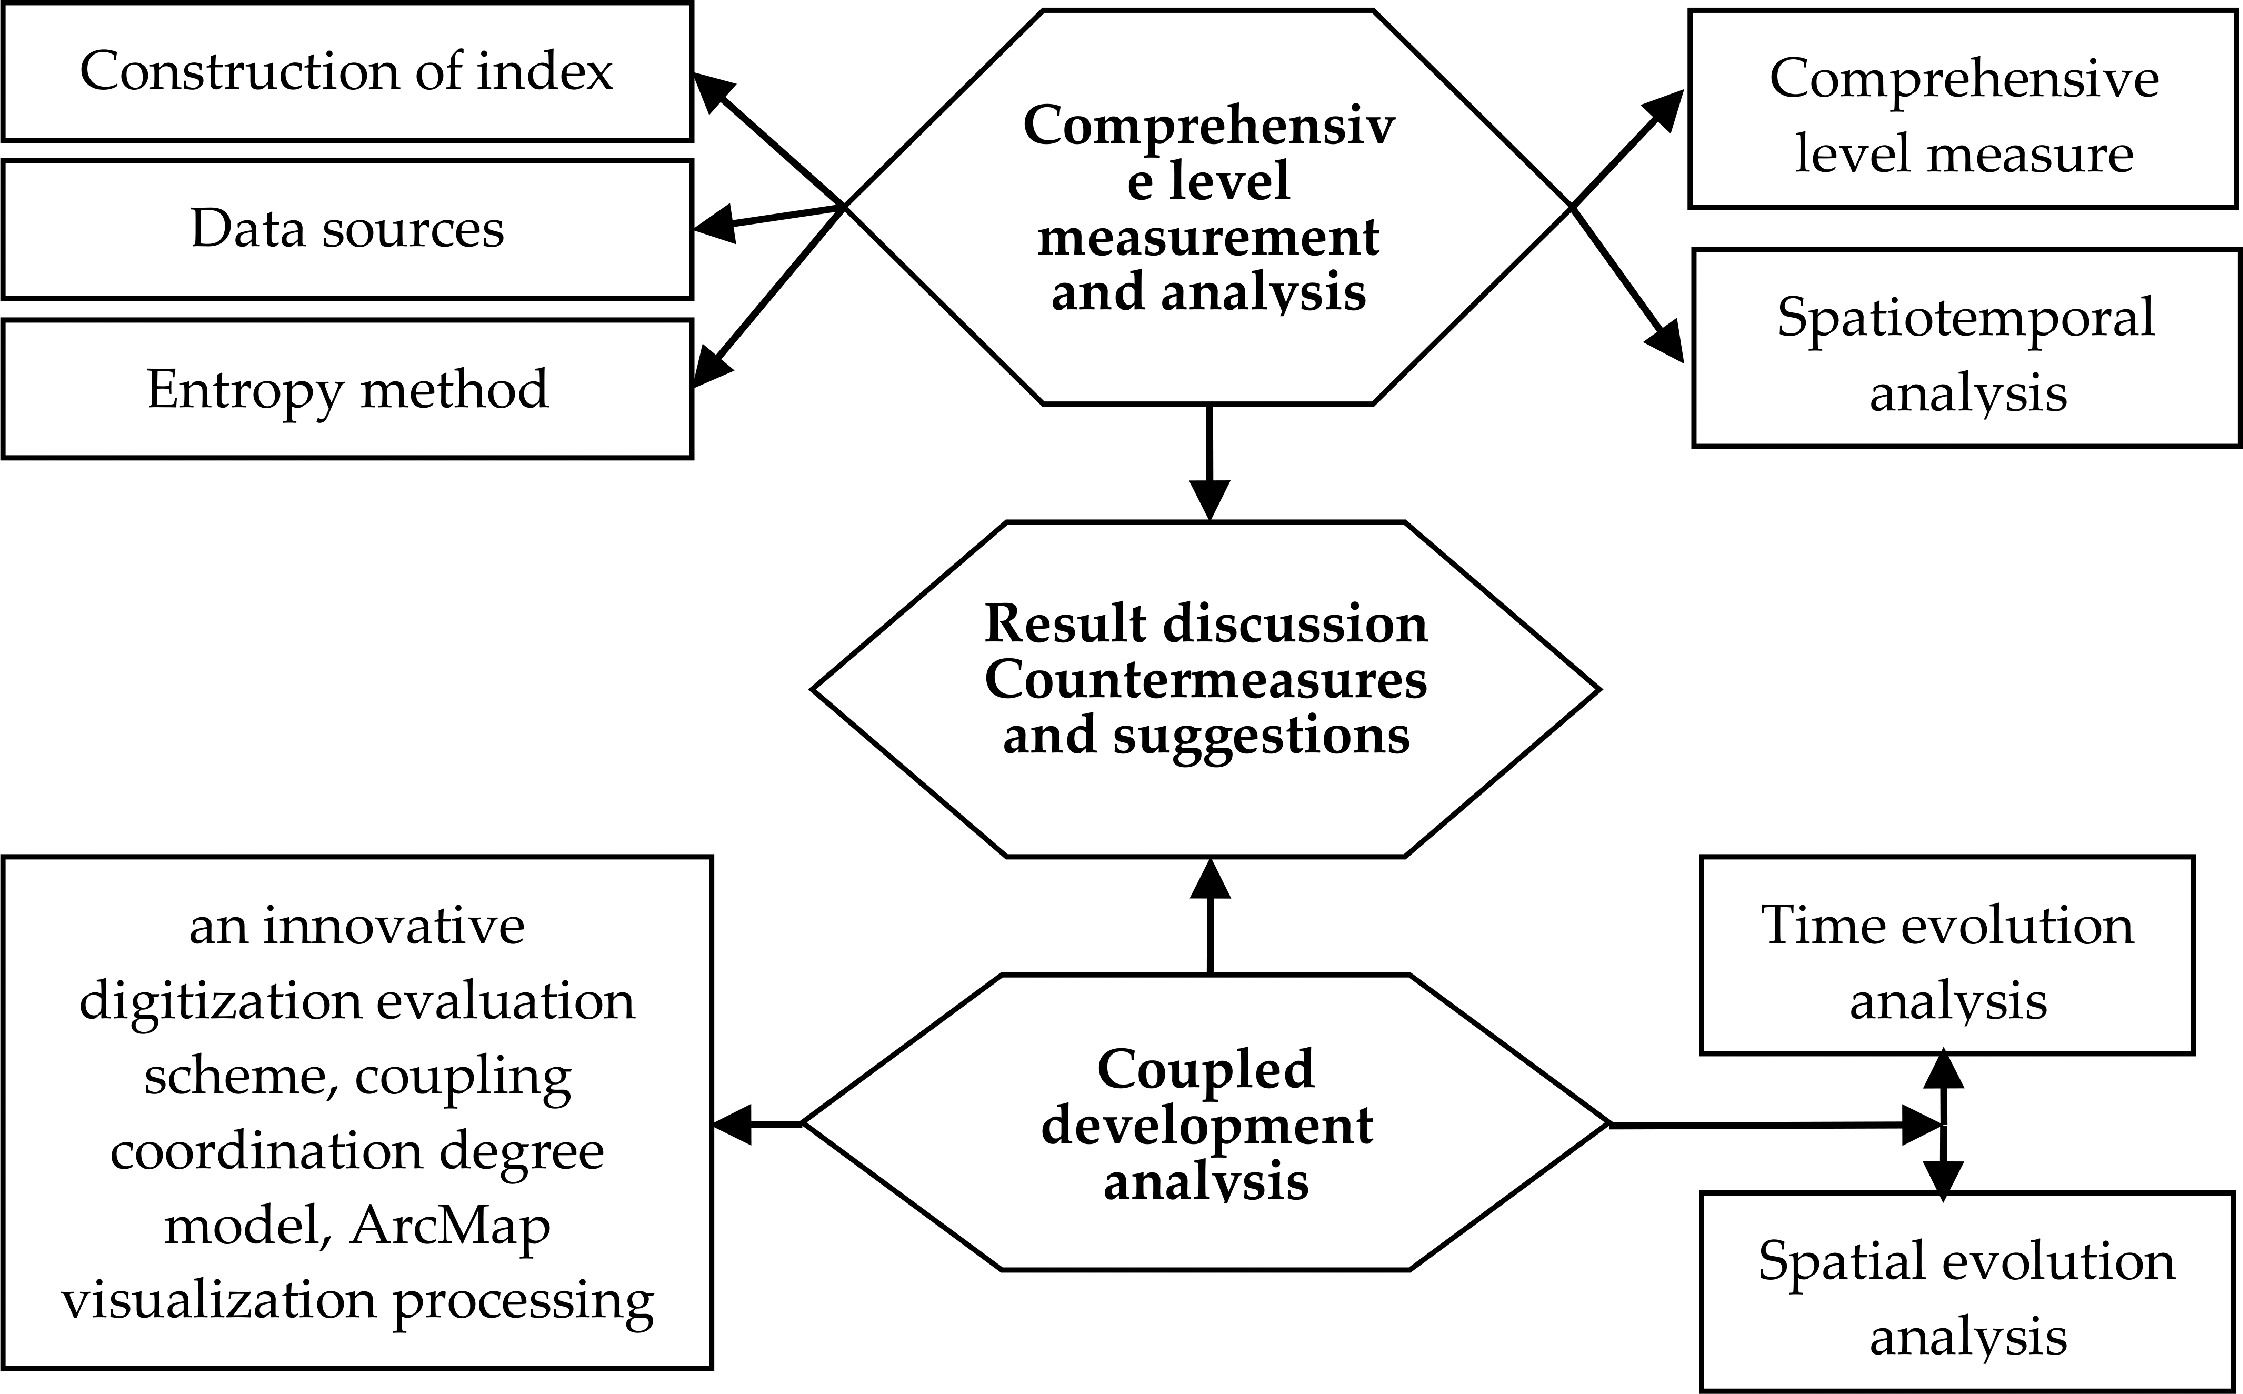
Research frameworkThis paper aims to study the coupling and coordinated development of rural economy and agricultural ecological environment. The main research methods and ideas are shown in Fig. 1.The technical path chart is generated according to the overall framework logic of the paper, which is divided into three parts, including comprehensive level measure analysis, coupled development analysis, results discussion and countermeasures and suggestions. Through the technical path diagram can directly understand the general idea of the article.
Comprehensive level measurement and analysisEntropy method model
The weight assignment of the evaluation index is a common method to deal with the comprehensive evaluation index. In order to avoid the subjective influence, this paper adopts the objective assignment method - the weight method. The calculation method of index weight is as follows (Chen, J., Liu, YP.,Wang, LJ.):
The first step is to standardize the original data.
Dimensionless is a data processing method to eliminate the influence of different dimensions of original indexes on comprehensive evaluation through mathematical transformation. Due to the different nature and measurement unit of each index, it often lacks comprehensiveness, so it is necessary to deal with each index dimensionless.
For positive indicators, that is, the larger the index value, the better. The larger the index value, the greater the corresponding evaluation value.

For the inverse index, the smaller the index value, the better. The smaller the index value, the smaller the corresponding evaluation value.

The second step is to calculate the entropy.
Calculate the weight of index b in year a.

Calculate the entropy of index b.


The third step is to calculate the redundancy.
Calculate the redundancy of index b.

The fourth step is to calculate the entropy weight.
Calculate the weight of index b.

Xab is the original value of the indicator, which represents the original data of indicator b in the year a, X’ab is the standardized value of the original value of the index, which represents the standardized data of item b in the year a, max(Xb) is the maximum value of item B, min(Xb) is the maximum value of item b.
The weight of the index is calculated by the entropy weight method, and then the standardized data are solved to construct the comprehensive evaluation function of rural economy and agricultural ecology function. It is assumed that the U and E represent rural economic system and agricultural ecological environment system respectively.
Establishing the comprehensive evaluation function of the rural economic system.

Establish the comprehensive evaluation function of agricultural ecological environment system.

Where, a and b are the number of indicators of the rural economic system and agricultural ecological environment system, Xa and Yb are the standardized values of indicators of rural economic system and agricultural ecological environment system respectively, Wa and Wb are the index weights of the rural economic system and agricultural ecological environment system. The higher the value of U(x), the better the degree of rural economic development, the higher the value of E(x), the higher the status of the agricultural ecological environment. Suppose that the variable Ui(i = 1,2) is the order parameter of the "rural economy agricultural ecological environment" system, Uij is the j-th index of the i th order parameter, its value is Xij(j = 1,2,…,m), and Uij is the standardized value of the j-th index of the i th subsystem. The specific process is as follows:

Where Uij is the contribution of variable Xij to the efficacy of the system, and the value range is (0,1). Since rural economy and agricultural ecological environment are two independent and related subsystems, the orderly contribution of each order parameter in the subsystem to the total system can be realized by the linear weighting method:

Where, m is the number of evaluation indexes and Ui is the orderly contribution of the subsystem to the total system; λij is the weight of each order parameter, which can be determined by the entropy weighting method.
Index system and data sourceAccording to the specific situation of the development of rural economy and agricultural ecological environment in Guangxi, these evaluation systems are divided into target layer and index layer. The target layer is mainly characterized by rural economy and agricultural ecological environment and aims to reflect their comprehensive development level. The formulation of index level should fully reflect and expand the connotation and significance of target level indicators. According to the significance of the development of rural economy and agricultural ecological environment, 6 primary standards are selected and 24 secondary standards are established, which constitute the evaluation standard system of rural economy and agricultural ecological environment. As shown in Table 1. Among them, agricultural machinery power per unit sowing area=total agricultural machinery power/cultivated land area, film use per unit sowing area=film use/cultivated land area, urban-rural residents' income ratio=urban residents' income/rural residents' income. Other index data can be obtained from Guangxi statistical yearbook, Guangxi Environmental Yearbook, Guangxi national economic and social statistics bulletin, and the bulletin of Guangxi ecological environment were obtained.
Index evaluation system for coordinated development of rural economy and agricultural ecological environment.
- (1)
Measurement of the comprehensive level of the rural economy
The weight values of each index layer are calculated according to the entropy weight method. Table 2 shows the weight values of 12 index layers of Guangxi's rural economic index system in 2007, 2009, 2014, and 2019 calculated by the entropy weight method. Because it is to analyze the spatial coupling and coordination of each prefecture-level city later, four meaningful years are selected. 2007 is the initial year of the study and 2019 is the last year of the study. The comparison of the two years can show the changes in the previous and subsequent 13 years. 2009 is the turning point from high to low, and 2014 is the turning point from low to high (table 3).
Secondary index weight of rural economic index system.
Comprehensive level index of rural economy in Guangxi cities.
Combined with the weights of 12 index layers of the rural economy, the three target layers of agricultural input level, agricultural output level, and agricultural living standard of the evaluation index system of the rural economy is calculated in different dimensions, to provide a data basis for the analysis of the following three target layers. Them, table 4 shows the scores of the three target levels of agricultural input level, agricultural output level, and farmers' living standard in Guangxi in the past 14 years from 2007 to 2019.
- (2)
Classification of the comprehensive level of the rural economy
Guangxi rural economic target level index.
Based on the classification of the rural economic level at home and abroad, this paper divides the level into three levels: low level, medium level, and high level. Table 5 shows the classification and characteristics of agricultural modernization.
Classification and characteristics of comprehensive level of agricultural modernization.
- (1)
Time measurement and analysis of the comprehensive level of the rural economy in Guangxi
Through the calculation of the comprehensive score of the rural economy in Guangxi from 2007 to 2019, the development trend changes on the time axis are displayed in the intuitive form of a cracked line chart. As shown in Fig. 2, the overall level of Guangxi's rural economy increased from 0.306 in 2007 to 0.598 in 2019, an increase of 0.292, and showed linear growth for 12 years, indicating that the rural economy of the whole region has developed rapidly during this period. But in these 13 years, the growth index is not uniform.

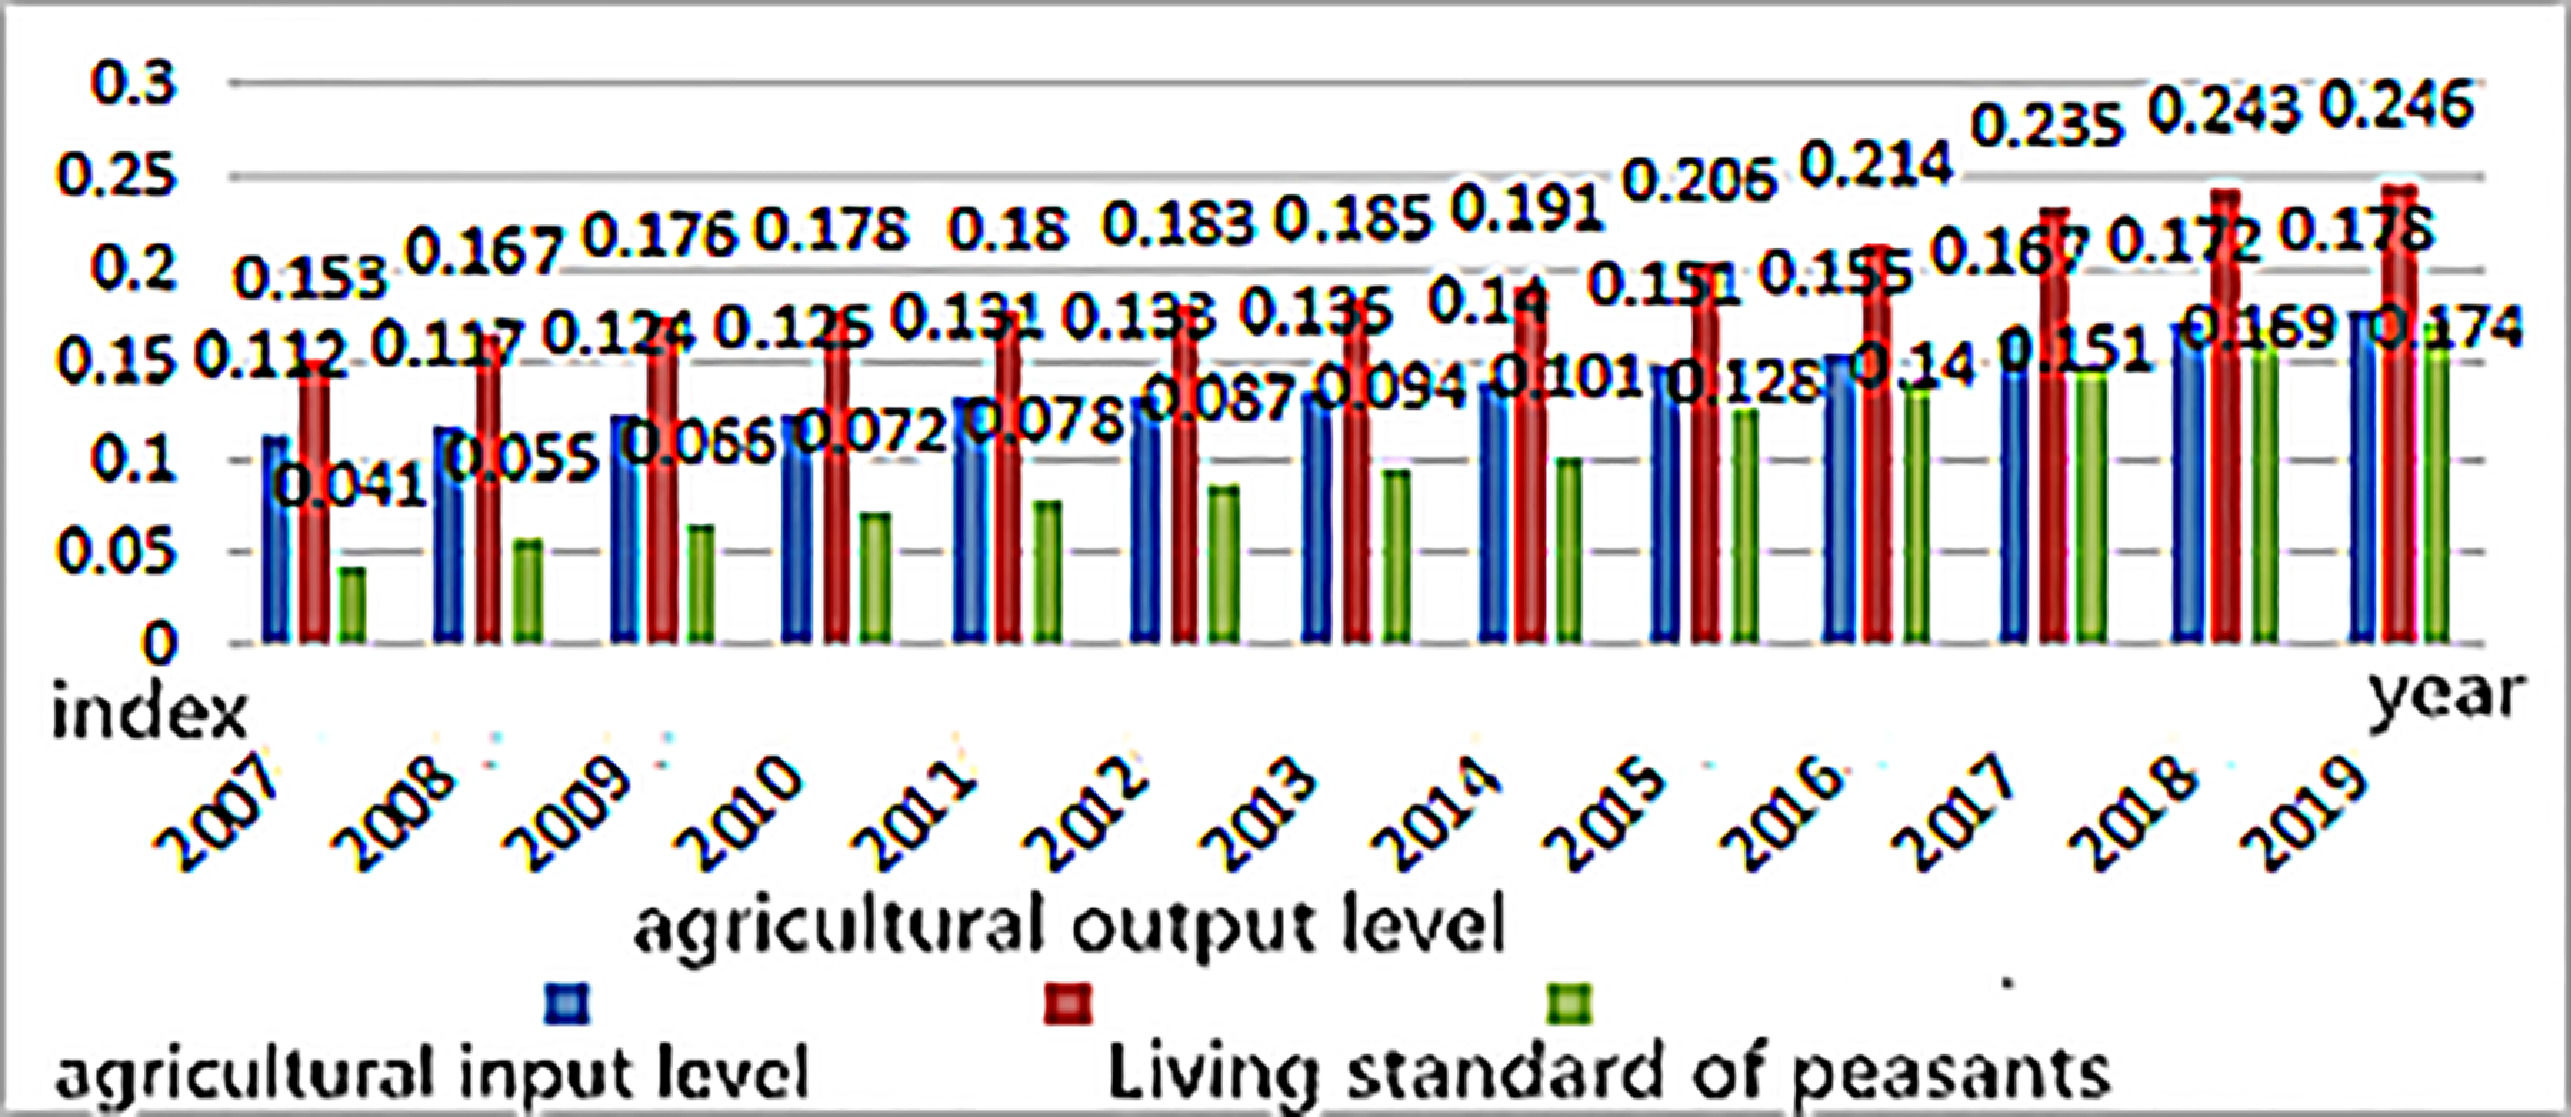
Analyzing from the comprehensive index alone is not enough to dig out the internal relationship between rural economic development. Therefore, the article also especially peels off the three subsystems and makes a detailed analysis of the index changes of the three subsystems (Fig.3). From the perspective of agricultural production input level, its increased year by year from 2007 to 2019, but the overall range changed little. The level index increased from 0.112 in 2007 to 0.178 in 2019. In terms of agricultural output level, the index also showed a linear growth from 2007 to 2019, from 0.153 in 2007 to 0.246 in 2019, with a growth rate of 60.7%. From the perspective of farmers' living standards from 2007 to 2019, it not only increased year by year but also changed greatly. From 2007 to 2019, it increased by 0.133, with a growth rate of 324.3%, which is the largest change among the three subsystems.
- (2)
Spatial measurement and analysis of the comprehensive level of the rural economy in Guangxi

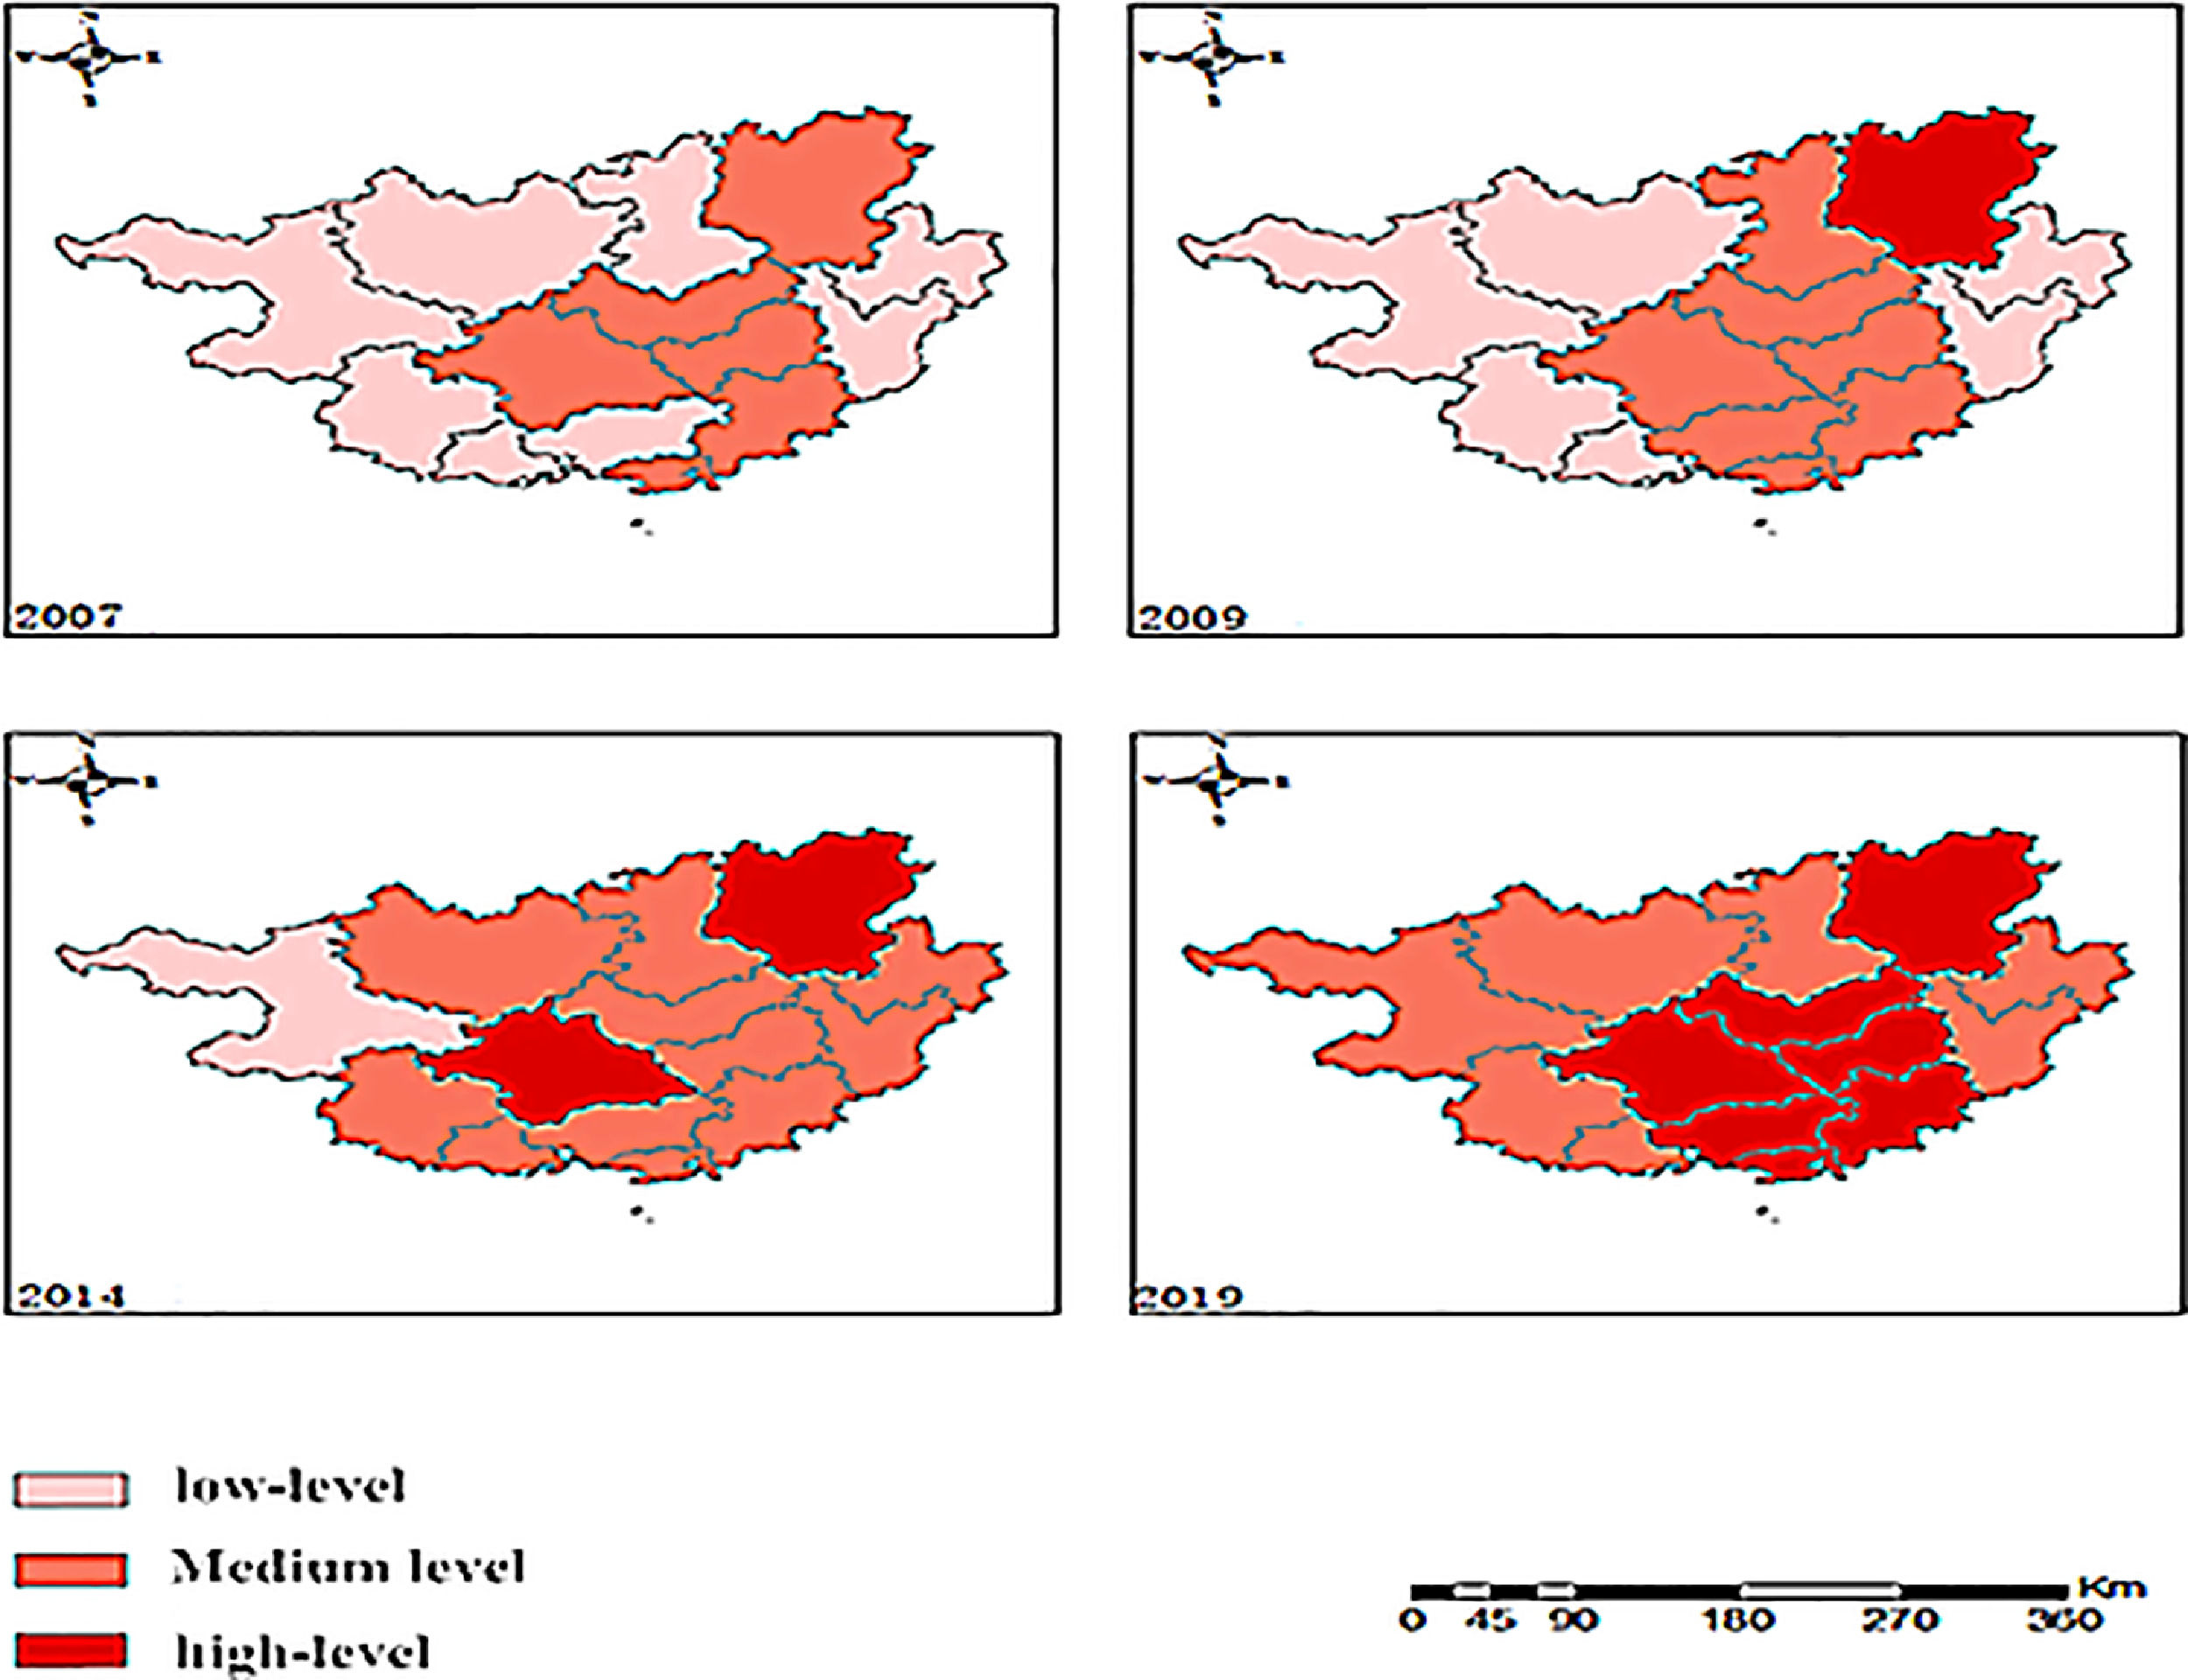
According to the grading standard of rural economic level, four years with important analytical significance, 2007, 2010, 2014, and 2019, are selected and visualized through arcgis10.3, to more intuitively visualize the spatial change of rural economic level in 14 prefecture-level cities in Guangxi. As can be seen from Fig. 4, in 2007, the level of rural economic development was not at a high level. There were 6 prefecture-level cities at a medium level and 8 prefecture-level cities at a low level. In 2009, the level of rural economic development reached a high level, with only one prefecture-level city in Guilin, seven prefecture-level cities at the medium level, and six in the low-level area. Compared to the two pictures in 2007 and 2009, there are slight changes, with dark red areas, while dark orange areas increase and light orange areas decrease, indicating that the rural economy of Guangxi is developing towards a good trend. In 2014, the level of rural economic development was at a high level. There were two prefecture-level cities, namely Nanning and Guilin. Baise was at a low level, and the remaining cities reached a medium level. Compared with 2009 and 2014, there are obvious changes. Among them, dark orange areas almost cover the whole region, and only a few dark red areas and light orange areas, indicating that medium-level prefecture-level cities are increasing. In 2019, rural economic development reached its peak. There are 7 prefecture-level cities in the high-level development area and medium-level areas, and the rest of the cities have reached the medium-level development level. Compared with the two pictures in 2014 and 2019, the dark red areas increased significantly. Further observation shows that dark orange and dark red account for half of the country respectively. On the whole, the agricultural economic development level of Nanning, Guilin, Liuzhou, Beihai, and Yulin has always been relatively high, while the lower development level is Hechi, Baise, and Chongzuo, which are unbalanced.
Agro-ecological environment comprehensive level measurement analysisMeasurement and classification of the comprehensive level of agricultural ecological environment
- (1)
Measurement of the comprehensive level of agricultural ecological environment
This part also evaluates the level of the agricultural ecological environment from two different levels of Guangxi region and prefecture-level city. Table 6 shows the weight values of 12 index layers of Guangxi agro-ecological environment index system in 2007, 2009, 2014, and 2019 calculated by entropy weight method.
Secondary index weight of agricultural ecological environment index system.
Combined with the weights of 12 index layers of agricultural ecological environment, and then through the comprehensive index function of agricultural ecological environment, the comprehensive level index of agricultural ecological environment is calculated. Table 7 shows the comprehensive level index of the agricultural ecological environment in Guangxi in 2007, 2009, 2014, and 2019.
Comprehensive level index of agro-ecological environment in Guangxi cities.
Combined with the weight of 12 index layers of agricultural ecological environment, the three target layers of agricultural natural resources, agricultural ecological environment pressure, and agricultural ecological environment governance of the evaluation index system of the agricultural ecological environment are calculated in different dimensions, to provide data basis for the analysis of the following three target layers. Them, table 8 shows the scores of the three target levels of agricultural natural resources, agrarian eco-environmental pressure, and agricultural eco-environmental governance in Guangxi in the past 14 years from 2007 to 2019.
- (2)
Classification of the comprehensive level of agricultural ecological environment
Level index of each target layer of agricultural ecological environment in Guangxi.
Based on the classification of the comprehensive level of the agricultural ecological environment at home and abroad, the development level of the agricultural ecological environment system in the study area is divided into five levels: excellent, good, general, poor, and poor. Table 9 shows the classification and meaning of the agricultural ecological environment level.
Classification and meaning of comprehensive level of agricultural ecological environment.
- (1)
Time measurement and analysis of agricultural ecological environment level in Guangxi
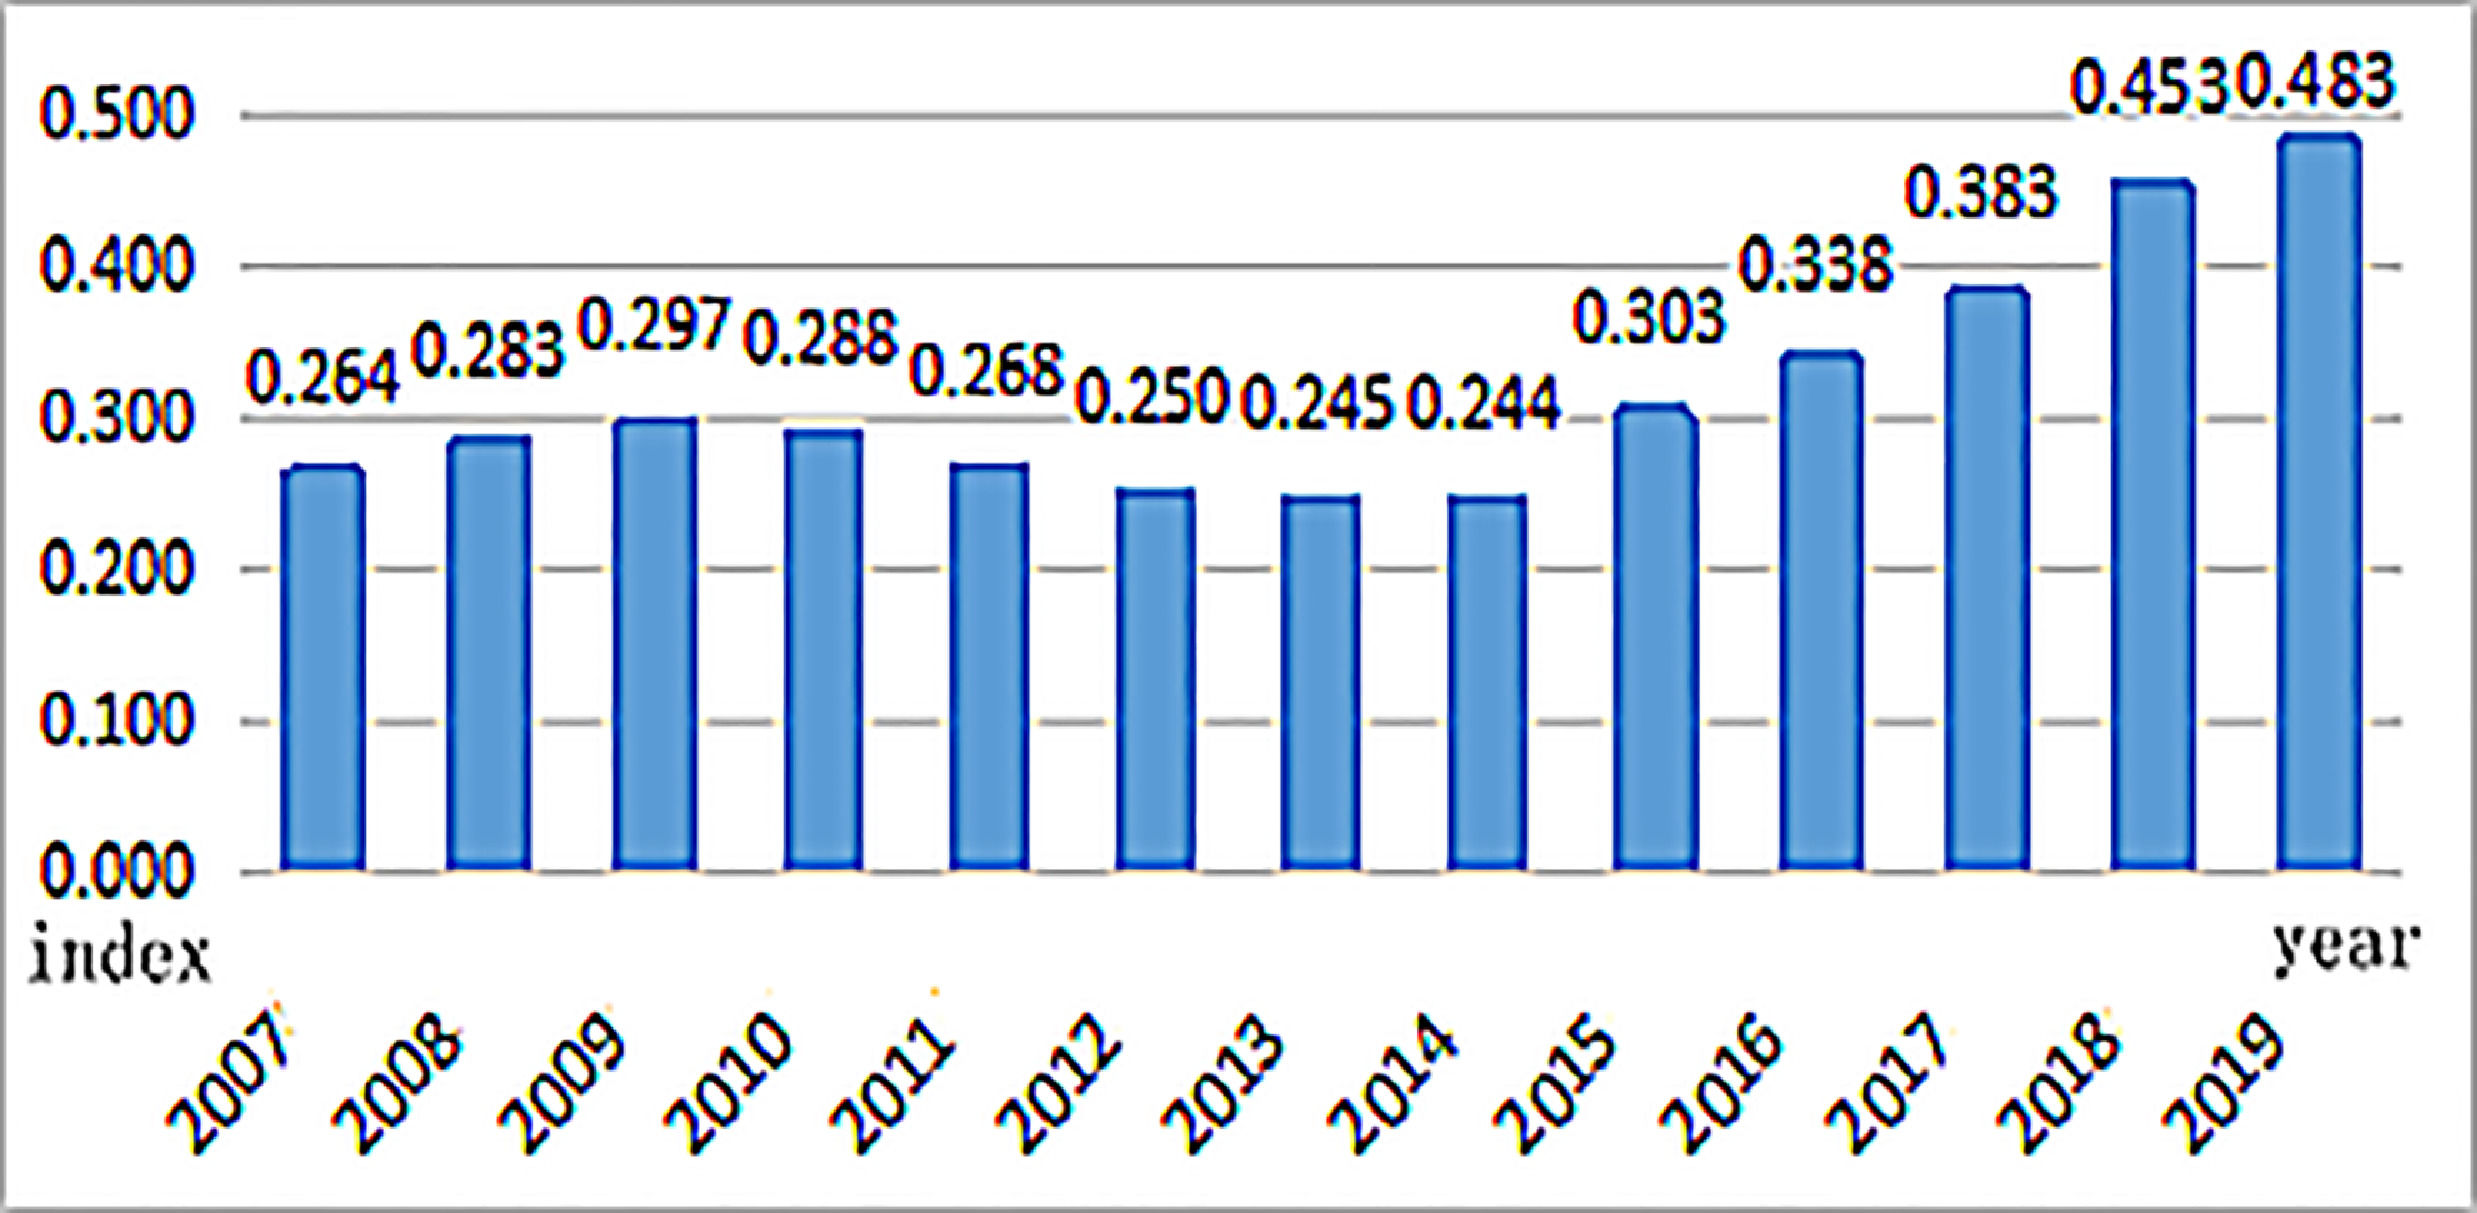
Through the calculation of the comprehensive level index of agricultural ecological environment in Guangxi from 2007 to 2019, the development trend of agricultural ecological environment level in Guangxi on the time axis is displayed in the intuitive form of the broken line chart. As shown in Fig. 5, the index increased from 2007 to 2019, showing an upward trend. However, during this period, it did not develop linearly but changed linearly from decline to rise, showing a slow upward trend.

As shown in Fig. 6, among the three subsystems of ecological environment, the change of agricultural ecological environment resources fluctuates little, ranging from 0.123 to 0.145, indicating that the endowment of agricultural natural resources in Guangxi cities is relatively stable. The pressure on the agricultural ecological environment increased from 0.081 in 2007 to 0.181 in 2019, with a growth index of 0.1. Although there were slight fluctuations during this period, it generally developed towards an upward trend; the agricultural ecological governance index increased from 0.060 to 0.159 in 2019, with a growth index of 0.099. It can be seen that cities still pay more attention to agricultural ecological environment governance and achieve important results. Based on the above analysis, the overall level of the agricultural ecological environment in Guangxi is developing towards a good trend, but the current development level is still low.
- (2)
Spatial measurement and analysis of the comprehensive level of agricultural ecological environment in Guangxi

According to the grading standard of agricultural ecological environment level, four years with important analytical significance, 2007, 2010, 2014, and 2019, are selected and visualized through arcgis10.3, to more intuitively visualize the spatial change of agricultural ecological environment level in 14 prefecture-level cities in Guangxi. As shown in Fig. 7, in 2007, none of the prefecture-level cities reached the "good" level, belonging to the "poor", "poor" and "average" levels; in 2009, none of the 14 prefecture-level cities reached the "good" level. Comparing the two spatial maps of 2007 and 2009, at this stage, the dark red areas decreased, the orange areas increased, and the spatial changes of local cities were small. Although it showed an upward trend, there was no obvious change in the level of agricultural ecological environment of each city compared with 2007. 2014 was the low point of the agricultural ecological environment development index, and most cities were at the lowest index in 13 years, the same as the previous 2007 and 2009. Compared with 2009 and 2014, there are obvious changes. Among them, the number of dark red areas increases from 2 to 5, the number of orange areas decreases from 10 to 8, and the number of light green areas decreases from 2 to 1, which is in a downward trend as a whole. 2019 is the best period of development in the past 13 years. Most prefecture-level cities have reached the peak of development, and two cities have reached the "good" level, which is an unprecedented level. All 14 prefecture-level cities have separated from the "poor" level, and the agricultural ecological environment level of the whole region has improved unprecedentedly
Analysis on the coupling development of rural economy and agricultural ecological environment in guangxiEstablishment of coupling degree and coupling coordination modelConstruction and criteria of a coupling degree model
With the help of coupling degree, the internal synergy mechanism of interaction and interaction between the rural economic system and agricultural ecological environment system can be displayed, and the following coupling degree model is established:

Where: C represents the coupling degree, and the closer C is to 1, the higher the relationship between the two systems. Referring to the existing research results, it is divided into five coupling levels according to the coupling degree. See table 10 for the specific division.
Classification and characteristics of coupling degree.
Coupling degree is an index to measure the degree of correlation between systems. It can only reflect the degree of interaction between systems, but not the level of each system. By using the coupling coordination degree, we can better reflect the interaction degree of each system and the level of each system.


D represents the coupled co-scheduling, T represents the comprehensive coordination index of the two subsystems of rural economy and agricultural ecological environment, and the closer D is to 1, the higher the coordination level of the two systems,D and T from 0 to 1; α and β indicates the importance of rural economic system and agricultural ecological environment subsystem. When analyzing the coupling relationship between the two subsystems, they are equally important, so α and β values are 0.5. Referring to the existing research results, according to the size of the coupled cooperative scheduling, it is divided into three coordination stages and eight coordination types. See Table 11 for the specific division.
Classification and classification of coupling coordination degree.
Based on the relevant data of the calculation results of the comprehensive level index of the rural economy and the comprehensive level index of agricultural ecological environment in Guangxi from 2007 to 2019, combined with the coupling degree and coupling coordination degree model, the overall coupling degree and coupling coordination dispatched of Guangxi in the 13 years from 2007 to 2019 are calculated. The specific values are shown in Table 12.
Coordinated operations of rural economy and agricultural ecological environment in Guangxi.
In the 13 years from 2007 to 2019, the rural economic level index of Guangxi increased from 0.306 in 2007 to 0.597 in 2019, an increase of 0.291; the comprehensive level index of the agricultural ecological environment increased from 0.264 in 2007 to 0.483 in 2019, an increase of 0.219; during this period, the coupling degree and coupling level of the rural economy and agricultural ecological environment is in a relatively stable development state, increasing from 0.489 in 2007 to 0.493 in 2019, showing an overall growth trend, but the growth rate is small. The coupling degree of the two systems is in the range of 0.4–0.5, which is in the antagonistic stage. During this period, the interaction between the rural economy and the agricultural ecological environment was strengthened, and the rural economic system showed advantages. The coupling degree can only reflect the interaction relationship between the two systems, not the level of the two systems. Therefore, it is necessary to use the coupling coordination degree to reflect the interaction level between the two systems.
In the 13 years from 2007 to 2019, the coupling and coordinated development type of Guangxi's overall rural economy and agricultural ecological environment is mild maladjustment most of the time, reluctantly coordinated and slightly coordinated in a small part of the time, and the agricultural ecological environment is a lagging stage, and the level of agricultural ecological environment lags behind the level of the rural economy. From 2007 to 2019, the degree of coupling and coordination between the rural economy and agricultural ecological environment fluctuated, neither towards a good trend nor a bad direction. According to Fig. 8, the evolution process of the coupling coordination degree of the rural economy and agricultural ecological environment in Guangxi can be roughly divided into three stages. The first stage is 2007–2009, the second stage is 2010–2014, and the third stage is 2015–2019. These three stages have different changing characteristics. In the three years of the first stage, the degree of coupling and coordination between the two increased year by year, from 0.369 to 0.399, showing a slight upward trend. During this period, the rural economy did not pose a threat to the agricultural ecological environment. In the five years of the second stage, the degree of coupled coordination between the two decreased from 0.399 in 2010 to 0.3972013 in 2013. During the four years of the third stage, it was the stage with the greatest change in 13 years. The coupling coordination degree of the two increased from 0.432 to 0.514, an increase of 18.9%. Throughout the 13 years from 2007 to 2019, the coupling and coordination degree of rural economy and agricultural ecological environment in Guangxi generally present a "V" type change form, the coupling and coordination degree between the two decreased first and then increased. During this period, although the two systems have entered the coordination stage, they are still in the stage of bare coordination. Generally speaking, the overall coupling coordination degree of the two systems cannot reach the situation of benign interaction.
Spatial evolution analysis of coupling coordination degree between the rural economy and agricultural ecological environment in guangxi
Based on the relevant data of the calculation results of rural economic comprehensive level index and agricultural ecological environment comprehensive level index of 14 prefecture-level cities in Guangxi from 2007 to 2019, and combined with the coupling degree, the coupling degree of 14 prefecture-level cities in Guangxi from 2007 to 2019 is calculated, as shown in table 13. The coupling degrees of 14 prefecture-level cities in Guangxi in 2007, 2009, 2014, and 2019 are shown in the following table.
Coupling degree of rural economy and agricultural ecological environment in Guangxi cities.
In the four representative years of 2007, 2009, 2014, and 2019, the coupling level of 14 prefecture-level cities in Guangxi is basically in the antagonistic stage, indicating that the coupling level of these 14 regions is not high, and there is little difference in the coupling coordination level among prefecture-level cities.
Based on the above data of the comprehensive index of the rural economy, the comprehensive index of agricultural ecological environment, and the calculation results of the coupling degree between the rural economy and agricultural ecological environment of 14 prefecture-level cities in Guangxi from 2007 to 2019, combined with the coupling coordination degree model, the coupling coordination dispatching of 14 prefecture-level cities in Guangxi from 2007 to 2019 is calculated, as shown in Table 14. The 14 prefecture-level cities in 2014 and 2019 are coupled and coordinated, and the specific values are shown below.
Coordinated dispatching of rural economy and agricultural ecological environment in Guangxi cities.
To better understand the development trend of rural economy and agricultural ecological environment of 14 prefecture-level cities in Guangxi and clarify the spatial distribution characteristics of their coordinated development, based on the regional differences in 2007, 2009, 2014, and 2019, combined with the above division of coordination degree and coordination types, arcgis10.3 tool is used to visualize the coupling coordination degree of 14 prefecture-level cities in Guangxi. As shown in Fig. 9, the degree of coupling and coordination between the rural economy and agricultural ecological environment in the whole region is not high, and there are still great differences in the development level among cities. Gray areas represent extreme imbalance, yellow areas represent mild imbalance, blue areas represent mild coordination, purple areas represent high coordination, orange areas represent high imbalance, green areas represent reluctant coordination, blue areas represent moderate coordination, and red areas represent extreme coordination.Among them, the coupling and coordination level of cities in the Middle East is high, and the coupling and coordination level of cities in the west is low. It can be seen that the coupling and coordination level of rural economy and agricultural ecological environment in all cities in the region generally presents a spatial distribution gradually decreasing from the East to the West. In 2007, the coupling and coordination degree of Guangxi Cities was not high, and most prefecture-level cities were in the stage of imbalance. In 2009, one prefecture-level city achieved mild coordination, five prefecture-level cities achieved barely coordination, and eight prefecture-level cities were in mild imbalance. Compared to the two pictures in 2007 and 2009, the biggest change is that one red area turns yellow, the original 10 yellow areas are reduced to 8, and the original 3 light blue areas are increased to 5, indicating that the coupling and coordination level of rural economy and agricultural ecological environment in Guangxi is developing in a good direction. In 2014, one prefecture-level city achieved mild coordination, five prefecture-level cities achieved barely coordination, and eight prefecture-level cities were in mild imbalance. Comparing the two maps in 2009 and 2014, there is no change. The coupling and coordination level of rural economy and agricultural ecological environment in Guangxi is basically at a standstill. In 2019, 7 prefecture-level cities achieved barely coordination, 6 prefecture-level cities achieved mildly coordination, and 1 prefecture-level city was in moderate imbalance. Compared to the two figures in 2014 and 2019, the biggest change is that 8 yellow areas are reduced to 0, the original 5 areas are increased to 7, the original 3 light blue areas are increased to 5, and one blue area appears at the same time, indicating that the coupling and coordination level of rural economy and agricultural ecological environment in Guangxi is developing in a good direction.
Results of the analysis and countermeasures
Based on 14 prefecture-level cities in Guangxi, this paper studies the coupling and coordination relationship between the rural economy and agricultural ecological environment in Guangxi from 2007 to 2019. The analysis of the data is expected to solve the imbalance between economy and ecology to promote the sustainable development of society.
Results of the analysisThe comprehensive level index of the rural economy increases linearly, and regional development is unbalancedThrough the calculation results of the comprehensive index of the rural economy, from the perspective of time evolution, it is concluded that the comprehensive level index of the rural economy in Guangxi has been rising linearly over the past 13 years (an increase of 0.292 from 2007 to 2019), but the growth rate is very different. According to the calculation data, it can be divided into three development stages: the first stage (2007–2009), the second stage (2010–2014), and the third stage (2015–2019); among them, the growth rate in the first stage is moderate, the growth rate in the second stage is the slowest, and the growth rate in the third stage is the fastest. From the perspective of spatial evolution, the development of local cities is unbalanced, and there are serious differences. According to the calculation results in 2007, 2009, 2014, and 2019, Nanning (0.5222,0.620,0.701,0.855) and Guilin (0.547,0.647,0.758,0.907) have always been at a high level, while Hechi (0.206,0.305,0.347,0.563) and Baise (0.212,0.231,0.357,0.381) have always been at a low level. There is a large gap among these. From the perspective of spatial location, there is a more obvious cluster effect. The index of eastern cities is higher and that of western cities is lower. Therefore, in the future development process, we should focus on optimizing the development speed and solving the impact of too slow or too fast of a development speed; at the same time, the imbalance of development between regions is still the main problem. We should narrow the regional gap and give full play to the development advantages of each city.
The comprehensive level index of the agricultural ecological environment fluctuates and increases, with obvious regional differentiationThrough the calculation results of the comprehensive level index of the agricultural ecological environment, from the perspective of temporal evolution, it is concluded that the comprehensive level index of agricultural modernization in Guangxi has been rising in a fluctuating trend over the past 13 years (an increase of 0.219 from 2007 to 2019). According to the calculation data, it can be divided into three development stages: the first stage (2007–2009), the second stage (2010–2014), and the third stage (2015–2019); of these, the first stage is the growth stage, but the growth rate is relatively gentle, the second stage is declining, and the third stage is the growth stage, during which the growth rate is high. From the perspective of spatial evolution, the development of local cities is unbalanced, and there are serious differences. According to the calculation results in 2007, 2009, 2014, and 2019, the comprehensive level index of the agricultural ecological environment in Nanning (0.421,0.448,0.463,0.648) and Liuzhou (0.415,0.451,0.465,0.641)has always been at a high level, while Baise(0.196,0.241,0.256,0.432) and Hechi(0.132,0.112,0.125,0.306) have always been at a low level. Observing the spatial distribution also has an aggregation effect with the results of the comprehensive level index of agricultural modernization. The comprehensive index of the agricultural ecological environment in eastern cities is higher, and the comprehensive level index of the agricultural ecological environment in western cities has obvious differentiation. Therefore, in the interest of protecting the agricultural ecological environment in the future, we should still follow the principles of sustainable development, strive to effectively solve the existing ecological problems, and create good conditions for rural economic development.
The development of the rural economy and agricultural ecological environment are not synchronized and have mutual influenceUsing the calculation results of the comprehensive level of rural economy and agricultural ecological environment, it can be concluded that the comprehensive level index of the rural economy has increased linearly over 13 years, while the comprehensive level index of the agricultural ecological environment has increased in a fluctuating manner. From the perspective of time evolution, taking out the data of one year arbitrarily, the comprehensive level index of the rural economy is higher than the comprehensive level index of the agricultural ecological environment, indicating that the development pace of the rural economy is faster than the protection of the agricultural ecological environment. From 2007 to 2009, the comprehensive level index of the rural economy and the comprehensive level index of the agricultural ecological environment showed growth; from 2010 to 2014, the comprehensive level index of the agricultural ecological environment showed a downwards trend, while the comprehensive level index of the rural economy increased, but the growth rate was not high; from 2015 to 2019, the comprehensive level index of the agricultural ecological environment rebounded strongly, and the comprehensive level index of the rural economy also rose rapidly. It can be seen that the rural economy and agricultural ecological environment are not independent systems. They promote and restrict each other. In the future development process, we should focus on balancing the development of the two systems to make them develop stably and synchronously.
The coordination level between the rural economy and the agricultural ecological environment is lowThrough the calculation results of the coupling degree and coupling coordination degree, it can be concluded that the rural economy and agricultural ecological environment in Guangxi are in the antagonistic stage year round, and the coupling coordination level of the two is low. From the perspective of time evolution, over the past 13 years, the overall coupling degree of Guangxi has fluctuated between 0.469–0.494, with a small range, and they were in the antagonistic stage. Therefore, the coupling coordination fluctuates from 0.369 to 0.513, but the overall coupling coordination level is still low, and it is in a state of imbalance most of the time. From the perspective of spatial evolution, the gap in coupling degrees among prefecture-level cities is not large; the difference between coupling and coordination is obvious. The coupling and coordination levels of Nanning, Liuzhou, and Yulin have always been relatively high, while the coupling and coordination levels of Baise and Hechi are relatively low, and the differentiation between regions is obvious. In the 13 years from 2007 to 2019, the overall coordination level of Guangxi has been developing towards a good trend, and the coordination level gap of various prefecture-level cities has narrowed to a certain extent, but there is still room for further optimization. In the future development process, while ensuring the development speed, it is necessary to improve the quality as a rigid index, avoid the problems caused by the single pursuit of development speed, and further promote the benign development of the rural economy and agricultural ecological environment.
Countermeasures and suggestionsThis paper takes 14 prefecture-level cities in Guangxi Province as the research object, adopts the entropy method, coupling degree and coupling coordination degree model to construct the coupling evaluation index system of rural economic development and the agricultural ecological environment, and empirically explores the original data from 2007 to 2019. Based on the above research, it is concluded that the level of coupling coordination between rural economic development and the agro-ecological environment is low, and the development of the two is not synchronized. Therefore, the following suggestions are put forward based on the results.
Increase investment in agricultural science and technology innovation and improve the modern agricultural technology systemFirst, we optimize the layout of agricultural science and technology and integrate agricultural science and technology innovation resources. Governments at all levels should establish and improve the industrial system of modern agricultural technology, carry out agricultural scientific and technological innovation cooperation and scientific and technological innovation projects, integrate agricultural scientific and technological innovation resources and stimulate the advantages of all parties. Second, we should improve the ability of independent innovation of agricultural science and technology, and strengthen the transformation, popularization, and application of agricultural scientific and technological achievements. We must first improve the welfare of scientific researchers and provide them with good scientific research conditions. Second, exchanges and cooperation between domestic scientific research institutions and foreign joint research institutes should be strengthened, and foreign agricultural science and technological innovation should be quickly tracked and understood. Finally, all departments should integrate industrial development plans, better sort out the needs of agricultural science and technology, and provide an important basis for the establishment of agricultural scientific research projects. Third, the fund management of agricultural science and technology projects should be strengthened to ensure the use efficiency of project funds. We must establish multichannel fund sources and improve the fund management system, strictly control the application of agricultural science and technology research funds, ensure the implementation of project funds, and give full play to the use efficiency of project funds.
Optimizing the agricultural industrial structure and innovating the agricultural industrial layoutFirst, we must innovate, adjust and optimize the agricultural industrial structure, and the development should be appropriate for the land. According to the local advantages, we will establish and develop characteristic planting agricultural bases and characteristic high-quality breeding bases, improve the agricultural regional structure, expand the industrial scale, and form an industrial base with high quality and high standards. Second, we must integrate local agricultural industrial resources and give play to local industrial advantages. Market orientation is a resource for participants in the value chain, which combines with other tangible and intangible resources to develop location advantages and improve the financial performance of the entire value chain (Khanh, Phi & Chau, 2019) . Therefore, integrating regional superior resources, eliminating backwards industrial structure, and increasing market orientation and location advantage is one of the ways to improve the safety bottom line of the agricultural industrial chain and promote the development of the industry to the high end. We must find the supporting resources of the local agricultural industry and ensure that all parts of the agricultural industry chain can cooperate, innovate and improve the integrated functions of the agricultural industry chain, such as production, marketing and RESEARCH and development. Third, leading agricultural enterprises should be built and introduced, and the advantages of the agricultural industry should be expanded. Consumer stickiness is considered one of the key determinants of success, and the formation of the brand effect is an important means of increasing consumer stickiness (Chen, Tsai & Ke, 2019). We must encourage and guide enterprises to establish their brands and improve the popularity of local agriculture through brand publicity. Then, we must establish a reasonable cooperation mechanism, guide innovative cooperation, make good use of market resources, broaden development space, and promote the high-quality development of leading agricultural enterprises.
Improve agricultural infrastructure construction and promote high-quality agricultural developmentFirst, we should focus on increasing the use of agricultural machinery and liberating labor productivity. Based on the coordinated development of man and nature, investment in agricultural infrastructure construction in Guangxi should be expanded, and the area of mechanization should be expanded. Second, we should formulate the management system of rural infrastructure construction and improve the efficiency of fund use. In the application and approval of rural infrastructure projects, project bidding, project construction, and supervision we will formulate a reasonable supervisory system to ensure the smooth progress of the project and the use efficiency of funds.
Strengthen the education of ecological knowledge and establish the consciousness of ecological environment protectionFirst, we must strengthen the publicity of ecological civilization and expand the influence of innovation publicity and education. Relying on the mainstream media to publicize environmental protection, popular science knowledge, and environmental protection laws and regulations, using daily public mobile phone software to carry out civilized publicity, we will expand its influence, cooperate with new media, and set up columns such as environmental protection news, policies, and regulations, environmental protection popular science and environmental protection law enforcement to improve the public's awareness of ecological civilization. Second, rural ecological civilization education should be carried out, and knowledge of ecological civilization education should be popularized. Ecological civilization education is an important part of school education, as it will improve the teaching plan and the popularization rate of ecological civilization education. Third, the supervision mechanism should be strengthened, and long-term breakthroughs in rural ecological civilization education should be promoted. We will regularly disclose relevant information and accept social supervision to ensure that agricultural ecological environment problems are effectively solved; give play to the role of public opinion supervision; further clarify the scope, handling process and follow-up supervision and management of public opinion supervision; build an environmental protection public opinion supervision system; and promote the continuous improvement of environmental quality.
Improve land utilization rate and cultivated land production capacityFirst, the production conditions of idle agricultural land should be improved and the circulation of agricultural land should be encouraged. For idle land resulting from the low output efficiency of agricultural land, on the premise of not damaging cultivated land, the infrastructure and production conditions can be improved by building agricultural irrigation canals, agricultural machinery, and cultivated land roads. The idle land caused by the transfer of rural labor force can be transferred to the greatest extent without changing the property right. Second, the farmland management system should be improved, and industrial land should be strictly controlled. We must formulate relevant policies to limit the supply of land within a reasonable range and prohibit the extension of industrial land. Third, we must strictly control cultivated land pollution and improve the protection level of cultivated land quality. Modern scientific and technological means were used for the real-time monitoring of cultivated land, including farmland ecosystem air, soil fertility, and the activity law of farmland microorganisms. The research and development of technologies for pollutant treatment and reuse should be strengthened to achieve low emissions and low pollution of agricultural waste. The development and popularization of agricultural chemicals such as chemical fertilizers, pesticides, and agricultural films with high energy efficiency and few side effects should be further expanded to comprehensively improve the quality of cultivated land.
ConclusionRural economic development and agricultural ecological environment system is a dynamic development process, both of which are composed of many complex factors, and they can interact with each other. In the process of rural economic development, the environmental problems caused by the increasing intensity of agricultural production machinery and chemical substances make the agricultural environment more and more pressure. In this process, agricultural economy can be rapidly improved, but at the same time, more resources and energy are consumed, increasing the pressure bearing value of agricultural ecological environment. But on the other hand, the increase of agricultural economic aggregate increases the ability of investment in agricultural environmental protection, which plays a positive role in solving agricultural ecological environment problems and alleviating agricultural ecological pressure. Therefore, there is a complex interaction and coupling relationship between the two systems. Rural economic development has a stress effect on the agricultural ecological environment, while the agricultural ecological environment has a constraint effect on the rural economic development. The two systems seek mutual adaptation and coordinated promotion.
Taking Guangxi as An example, this study uses an innovative digevaluation scheme to analyze the systematic coupling of rural economy and agricultural ecological environment, in order to have a profound understanding of the development of rural economy and the protection of agricultural ecological environment in Guangxi and explore the coupling and coordination between the two. For the healthy development of the two systems to find a breakthrough and entry point. The research shows that in order to promote guangxi economic and social development, promote high-quality agricultural development and rural ecological civilization construction. We should enhance the effectiveness and scientific nature of agricultural and rural ecological environment protection by intensifying agricultural scientific and technological innovation, optimizing industrial structure, and diversifying knowledge publicity and education, so as to achieve harmonious coexistence between man and nature.
Due to the limitations of objective resources, time and energy, professional knowledge, etc. The article only explores the coupling and coordination between both rural economic development and agroecological environment in Guangxi. Other variables can be further explored in depth in future work, instead of being limited to only a few selected variables in the current article. In addition, future work can also extend the scope of the study to the whole country and extend the time frame to the nearest point in time, then the study will be more representative and valuable.
This work was supported by Liu Wei OF National Social Science Fund "Research on risk prevention mechanism of intelligent grass-roots social governance" grant number 21BSH001, Hunan Social Science Fund Project "Research on Evaluation and construction of rural major emergency prevention and control capability"grant number 20JD037;