


Edited by: Abbas Mardari
More infoDigital technology policies beyond the traditional urban–rural dichotomy have become critical in economic and industrial integration. Few empirical studies examine the specific impact pathway of digital economy policy on urbanisation, especially urbanisation driven by the digital economy. This study attempts to reveal the linkage between urbanisation and digital technology policies to provide a reference for cities aiming to achieve urban transformation through upgrading their digital economies. Based on previous research, this work examines Chongqing, a major city in terms of the digital economy. This study develops a three-tier indicator system for digital technology policy, using the entropy-weighted technique for order of preference by similarity to ideal solution technique to generate the indicators, and proves the partially mediating role of urbanisation via regression modelling methods and Sobel–Goodman. The discoveries reveal that urbanisation mediates digital technology policy and economic development. Urbanisation driven by the digital economy is not merely the application of information technology and the expansion of cities but the synergy and interaction of knowledge, industrial structures and resource allocation.
With increasing technological innovation and diffusion, the world is experiencing a digital revolution that significantly impacts the global economy and livelihoods. On the one hand, as represented by artificial intelligence, digital technologies have a sustainable impact on global productivity, equality and inclusion (Vinuesa et al., 2020). Owners of digital platforms can avoid production and shaping while extracting profit from participants (Foster et al., 2018). On the other hand, technology spillover and information identification are effective channels for digital technology (DT) to develop (Fan & Liu, 2021); however, the digital economy has high requirements regarding infrastructure development, industrial base, labour quality and financial investment (Autor & Dorn, 2013). Therefore, the service sector's industrial structure must be effectively improved at the initial stage of DT application to effectively leverage the impact of the digital economy (Lee et al., 2020). Otherwise, the digital economy may widen the digital divide and the gap between labour productivity in the tertiary and secondary industries, rendering the economy unable to ensure sustained structural changes and technological upgrading (Fan & Liu, 2021; Lauridsen, 2010). Moreover, the government should promote the improvement and implementation of anti-monopoly measures to avoid market monopolies caused by unfair competition, such as data abuse and algorithm discrimination in DT development (Chen et al., 2022).
However, most developing economies have gaps in their industrial structure, often with export-oriented manufacturing as a critical part of their industrial development (Foster & Azmeh, 2020; Lee et al., 2020; Lee et al., 2020). As their products are at the lower and middle end of the market, there is a digital gap in the private sector, and research and development (R&D) investment is far lower than in industrialised countries. Under the DT policy, innovation output is the core driving force of enterprise performance improvement. Furthermore, applicable policy changes significantly impact enterprise performance (Peng & Tao, 2022). Digital capabilities can generate technological innovation faster than traditional capabilities, and developing countries could use this opportunity (Heredia et al., 2022). Therefore, it is crucial to analyse the forward-looking policies of developing countries in response to DT, which can increase rural resilience in the complex and challenging information age and help rural economies create new market opportunities. This paper combines DT and urban–rural linkages to analyse how governments, especially in developing countries, could formulate rational DT policy frameworks and identify forward-looking preparations for the Fourth Industrial Revolution (4IR).
First, the digital economy's development, whether digitalisation of industry or digital industrialisation, is essentially a reconfiguration of production methods (Bolwijn et al., 2018). Currently, the 4IR may subvert almost all industries in each emerging economy at an exponential rather than a linear rate (Gil, 2015; Xu et al., 2018). The policy has always been essential to upgrading industrial structures. In the background of the 4IR, the impact of DT policies on economic development is even more significant. A possible way to avoid increasing productivity dispersion and improve the compensatory employment effect's long-term weakness is to consider all possible technological complementarities. To achieve this objective, some public policies or managers must take reasonable action (Ballestar et al., 2021). From the 1970s to the present, the worldwide DT development has affected economic structures, contributed to the transformation of industrial technology systems in developing countries and influenced the future of the Fifth Industrial Revolution (5IR). The 5IR aims to create a people-centred society where products and services are readily available to meet various potential needs and reduce economic and social disparities, enabling all people to live comfortable and vibrant lives (Romero-Castro et al., 2022). A DT policy can facilitate the transition between the two stages.
Applying DT policies to achieve economic development and bridge the ‘digital gap’ and the ‘income inequality’ has gradually become fundamental to the strategies of global countries (Drori, 2010; Ferraz et al., 2020). Demand for digital products and services is expanding in emerging markets (Foster & Azmeh, 2020; Mayer, 2018), and critical elements of the existing economic structure, such as marketing models, operations, total factor productivity and supply chain management, will be challenged (Kim et al., 2018; Olsen & Tomlin, 2020; Schwab, 2017).
Second, China represents a developing country that is developing the digital economy through DT policies. Policies are frequently seen as significant to China's industrial concentration and urban growth (Barbieri et al., 2012; Lai, 2018). The government has altered the external development environment through policy-oriented governance and boosted business economic activity to promote industry agglomeration and urban growth. In practice, the Chinese government has been increasing its DT investment, issuing several major plans and policy guidelines for the digital economy and emphasising that the digital economy is the basis for developing a sustainable growth model (Jitao, 2021). DT, such as big data and cloud computing, has improved the capital use efficiency of small and medium-sized enterprises and promoted the operation efficiency of China's economy (Pan et al., 2021). Therefore, successful digital economy companies have become a development focus for local governments and are frequently subsidised to provide services for infrastructure development, such as online taxis and couriers (Foster & Azmeh, 2020). In this context, it has become an essential strategy for China's development to reduce inequality, promote knowledge creation, improve industrial structure optimisation and develop a scientifically sustainable economy through DT policies.
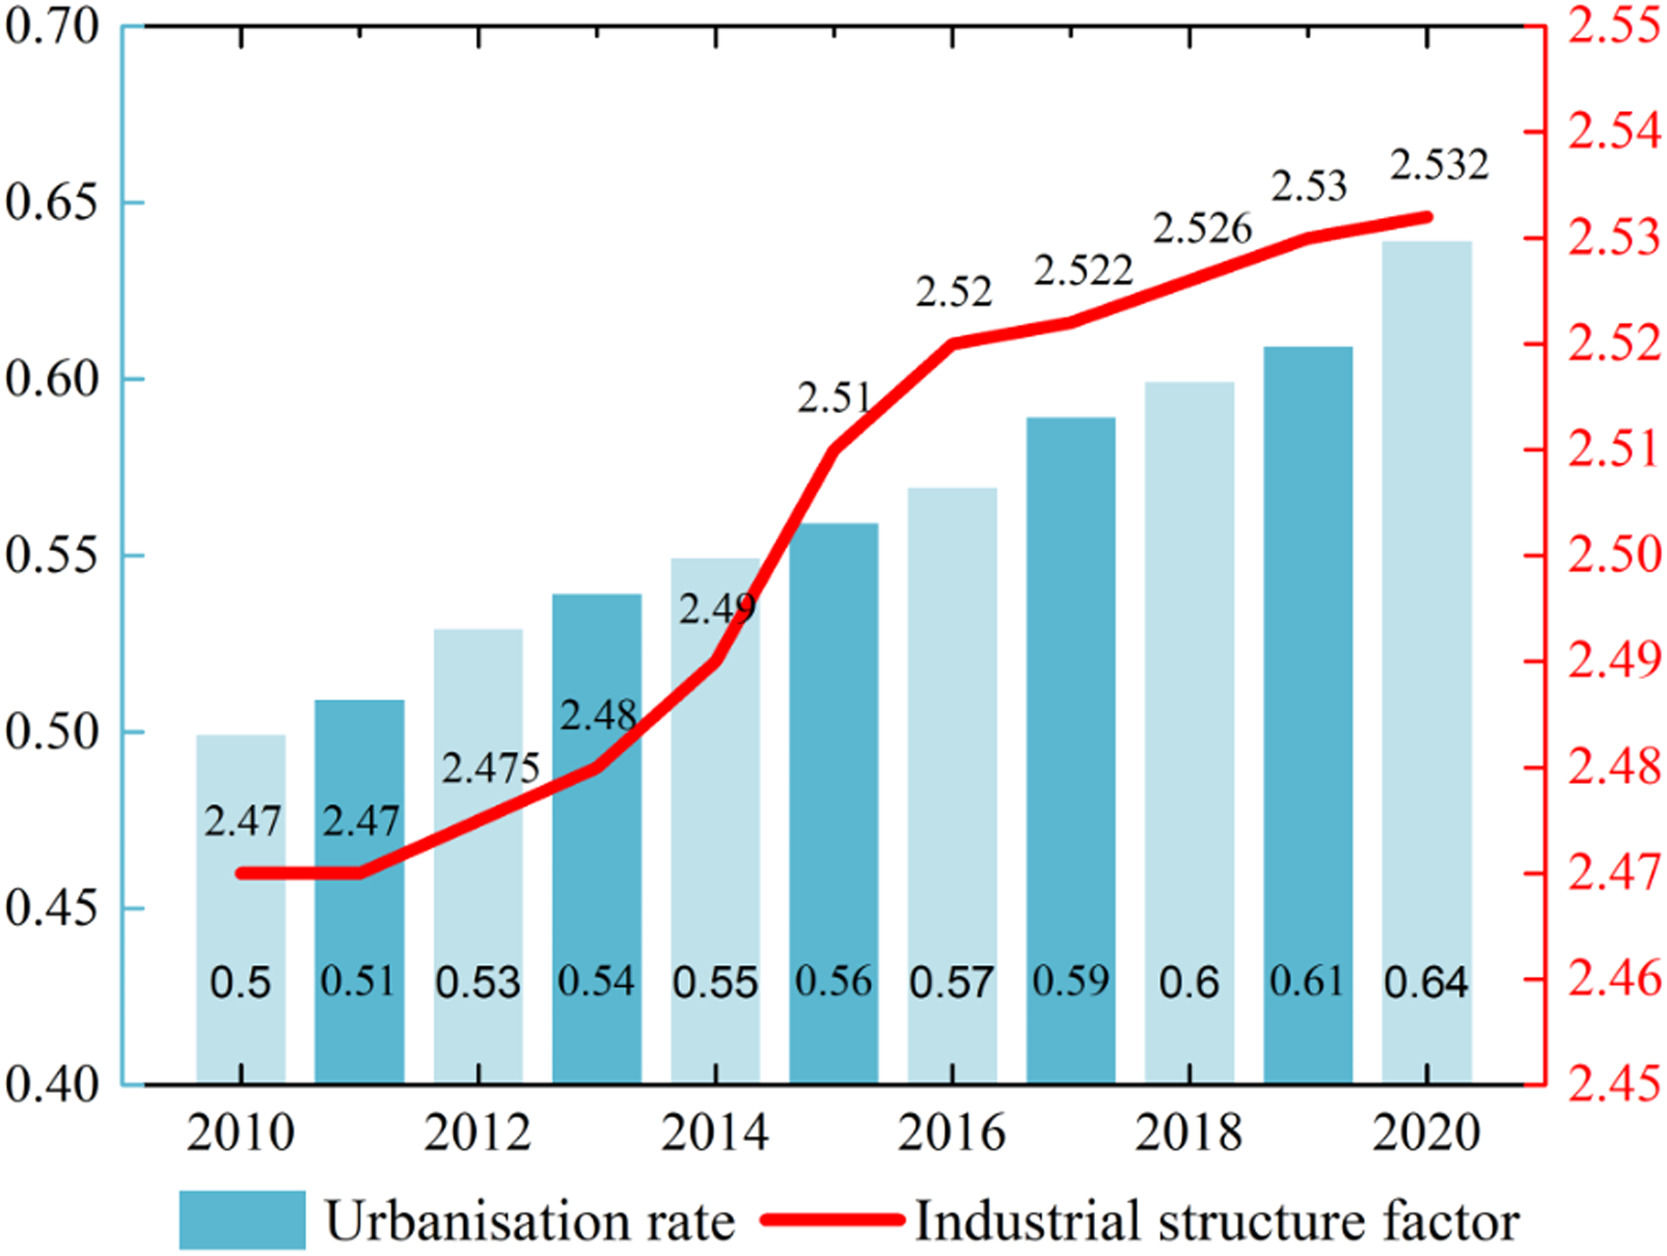
China is applying DT to improve urban–rural linkages, undoubtedly providing an extensive experience for other developing countries like India and Malaysia. As a developing country with a large population and geographic supermassive, China has developed employment difficulties and structural contradictions, such as the widening gap between urban–rural areas and between growth and the environment. Long-term urban policies have distorted urban–rural interaction and contributed to dilemmas in rural regions (Li et al., 2018). Traditional industrial restructuring has made sustainable economic growth challenging (see Fig. 1). Therefore, combining DT policies and urbanisation is an important trend in China's digital economy. While the digital economy affects China's urban and rural structure, it also develops with land support. The agglomeration effect of digital economic policies is generally more significant than urbanisation (Zhu & Chen, 2022). As a result, the demand for land in cities has increased.
.")
As shown in Fig. 1, all data sources are from China Statistical Yearbook (2010–2020). The urbanisation rate is the proportion of people in the urban population to the area's total population; the industry structure index is an indicator of the level of industrialisation and the quality of the industrial structure of a region. The industry structure index is expressed as ∑i=13i×YiY, where Y is the total output and Yi is the output of the primary, secondary and tertiary sectors.
The reshaping function of DT policy on economic activities and institutional arrangements is increasing. For developing countries like China, promoting the transformation of urban and rural structures is needed to achieve infrastructure development. The digital economy can impact the tendency and manner of urban and rural structural transformation; however, most existing research has focused on only a single aspect of the digital economy and social change. Few empirical studies examine urban development driven by the digital economy and urbanisation (Zhu & Chen, 2022).
Before the emergence of the digital economy, rural areas concentrated on traditional agriculture with poor quality. In contrast, cities focused on industry and services with high productivity. It has been established that the digital economy affects urban and rural structure transformation through product supply, factor allocation, income distribution and social governance; however, limited works analyse digital policy and urbanisation interactions. In addition to driving the growth of the digital economy, the change in the urban–rural structure can be significantly impacted by the DT policy in several ways, and several questions must be resolved. (1) What connections exist between urbanisation and the digital economy? (2) Can DT policies drive economic development while responding to the challenges of the urbanisation process? (3) What impact would urbanisation have on the digital economy development? This paper aims to demonstrate the relationship between urbanisation in moderating digital policy and local economic growth and explore DT policy's role beyond traditional urban–rural differences. This objective entails (1) constructing a composite index of DT policy based on available economic data to measure its role in urbanisation and the digital economy and (2) identifying urbanisation's function in the digital economy and economic development.
The remainder of the paper is structured as follows. The second part presents the theoretical mechanism and research hypothesis based on the review of relevant literature, the third part constructs the DT policy index and the fourth part is the research design, including data sources, variable selection and model construction. The fifth part shows the empirical tests and results, while the last part is the conclusion and enlightenment. This study extends previous research on the digital economy, urbanisation and economic growth, providing a foundation for establishing smart cities and other frontier sectors from a macro viewpoint.
Literature review and theoretical hypothesesPrevious studies have shown that the digital economy and economic development have a significant inverted ‘U-shaped’ relationship (Chen, 2021; Li et al., 2021; Yoon, 2008). The digital economy effectively promotes early-stage economic development in different regions. In later development stages, the digital economy can weaken the economy's sustainable development with the deepening of the digital divide, the widening income gap between urban and rural areas and the imbalance of regional development. This weakening can potentially fall into vicious circles (Fong, 2009; Torrent-Sellens et al., 2022; Zhang et al., 2021); however, supportive policies and infrastructure investments can be combined with removing barriers to urban–rural mobility to leverage broader economic gains (Turok & McGranahan, 2013; Wang et al., 2021), and the availability and accessibility of digital technologies make this combination possible (Drori, 2010). Gereffi (2001) argued that information and communication technologies have created new economic sectors and lowered industrial and commercial penetration barriers. For example, e-commerce has profoundly changed the structure of business-to-business (B2B) and business-to-consumer (B2C) transactions (Gereffi, 2001), enabling farmers to be employed locally and helping local governments increase their financial revenues (Wang et al., 2021).
Moreover, the digital economy's diffusion properties can facilitate the continuous absorption of new technologies by traditional industries, thereby increasing knowledge density and enhancing innovation capabilities (Hund et al., 2021). Several regions, such as Silicon Valley in the United States, the Scandinavian Peninsula and Bangalore in India, have evolved factor allocation and industrial upgrading through technology entrepreneurship programmes.
The emphasis on the deep integration of the digital economy with the real economy (mainly agriculture and industry) and urbanisation is an essential strategy for developing DT in the Chinese government (Xinhua News Agency, 2020). The government is now trying to develop urban technology parks and smart cities as an essential strategy to develop DT and alleviate severe regional disparities (China Telecom, 2019; Miao, 2013). This means that China's DT policy has two main directions: comprehensive digital transformation on a technical basis and production methods and promoting the industrial chain modernisation based on land (especially in suburban areas).
Furthermore, the transformation and upgrading of traditional industries require significant investment, and the development gap between many regions and urban and rural areas is still wide; the investment needs required for urban–rural and regional synergy, such as infrastructure improvement and industrial relocation, still require more attention. Based on previous literature, this paper summarises the following preconditions for DT development: infrastructure development, government financial investment and support, digital governance (regulation) and the practical impact of encouraging local businesses to innovate digitally (Flensburg & Lai, 2020; Skare & Soriano, 2021). In brief, policy attention is vital to developing the digital economy.
Thus, this paper puts forward hypothesis 1 as follows:
H1: DT policy has a direct positive effect on driving economic development.
Theoretically, the economies of scale represented by cities can spatially radiate to the surrounding towns and villages using population clusters and industrial agglomerations; however, in reality, the development gap between cities and towns under the urban–rural dual economic structure has widened. Large cities modernise rapidly, have more new businesses and are highly dynamic in innovation and entrepreneurship. In contrast, smaller towns face development difficulties with declining population densities and an ageing workforce. In China, urban classes are distributed in a stepped pattern, and the urban–rural divide is progressively more pronounced.
Smart cities are often cited as the best strategy for overcoming the adverse effects of urbanisation, and information and communication technologies (ICT) play the following fundamental roles (Noesselt, 2020). First, the application of DT policies could create employment opportunities for both urban and rural residents and drive innovation in digital underpinning technology, with rural residents having more opportunities to find work locally through the digital economy, reducing the barriers at the urban–rural border (Qi et al., 2019). Second, ICT has gradually changed, urban morphology and structure are gradually changing, and the concepts of mixed and sustainable land use and compact city have emerged (Bibri & Krogstie, 2017). Third, owing to DT's apparent advantages in technological innovation, industrial integration and market expansion, it provides a foundation for constructing a ‘resilient city’ and ‘sponge city’ (de Jong et al., 2015). Finally, the spatial spillover effect of ICT makes cooperation between different cities closer (Ding et al., 2022). Thus, the aggregation of the digital economy has also directly contributed to urbanisation. Therefore, this paper posits hypothesis 2 as follows:
H2: DT policy drives sustainable urbanisation.
Urbanisation could provide the human and social capital necessary for developing digital service industries and upgrading industrial structures and infrastructure to facilitate the development of the digital economy (Xu et al., 2022). An increase in the level of urbanisation also means an increase in the height of the industrial structure. When urbanisation reaches a certain level, the effectiveness of digital policy guidance becomes increasingly evident. The interaction evolution of the digital economy and urban development can show specific characteristics in the digital economy and urbanisation process. As a coordination mechanism of the digital economy and urban development, the DT policy may enhance the motivation of metropolitan peripheries beyond urban centrality.
Therefore, combining hypotheses 1 and 2 above, we propose hypothesis 3 as follows:
H3: Urbanisation can mediate DT policy and economic development, and its mediating role is partial.
According to the evolutionary economic theory (Perez, 1983), economic change is driven by the new technological revolution. Based on key elements, emerging technologies gradually replace traditional ones, changing old production methods and creating new market conditions, resulting in new or converging industrial models (Perez, 2010).
DT policies that focus solely on the formation and development of a techno-economic paradigm do not necessarily maximise the economic efficiency of high technology and may even lead to techno-feudalism. Therefore, it is necessary to consider social and political paradigms so that social members can share the dividends of technological progress (Lundvall, 2017). Moreover, DT necessitates changes in how governments see property rights and distribution. Otherwise, DT may cause the industrial structure to become overly financial, increasing the disparity in economic development across areas (Dosi and Virgillito, 2019). Consequently, DT's effects on working techniques and service delivery have the potential to influence rural communities significantly. Effective digitalisation in rural communities requires establishing the right conditions at the local level, including high-quality broadband civil infrastructure, education/skills and future-proofed regulations and policies (OECD, 2019).
This paper constructs an evaluation index system for the level of development of the digital economy based on the ‘foundation-technology-industry-society’ model from four standard layers: digital infrastructure, financial investment, digital industry development and digital governance.
First, developing the digital economy requires technical and economic support through digital infrastructure development to compensate for the industry chain's shortcomings.
Second, developing the digital economy is a long-term process, and the government needs to provide substantial economic support for the industrial reconfiguration of digital production methods.
Third, providing traditional enterprises with the impetus for digital transformation through technology policies can synergistically facilitate the proliferation of information technology and the related reorganisation of digital industries. The digital industrial system and capabilities are a solid foundation for the digital economy's new development pattern.
Finally, society's main contradictions and development goals are constantly shifting in the process of changing industrial systems. There is a need to ensure that the efficacy of economic growth resulting from digital technologies meets the minimum expectations of the overall society.
Although digital economic development has received increasing attention worldwide, the interaction between urbanisation and DT has been overlooked. A discrepancy exists between digital policy development and the digital economy. Therefore, this paper examines the impact of digital policy and urbanisation on regional economic development through a mediating effects model.
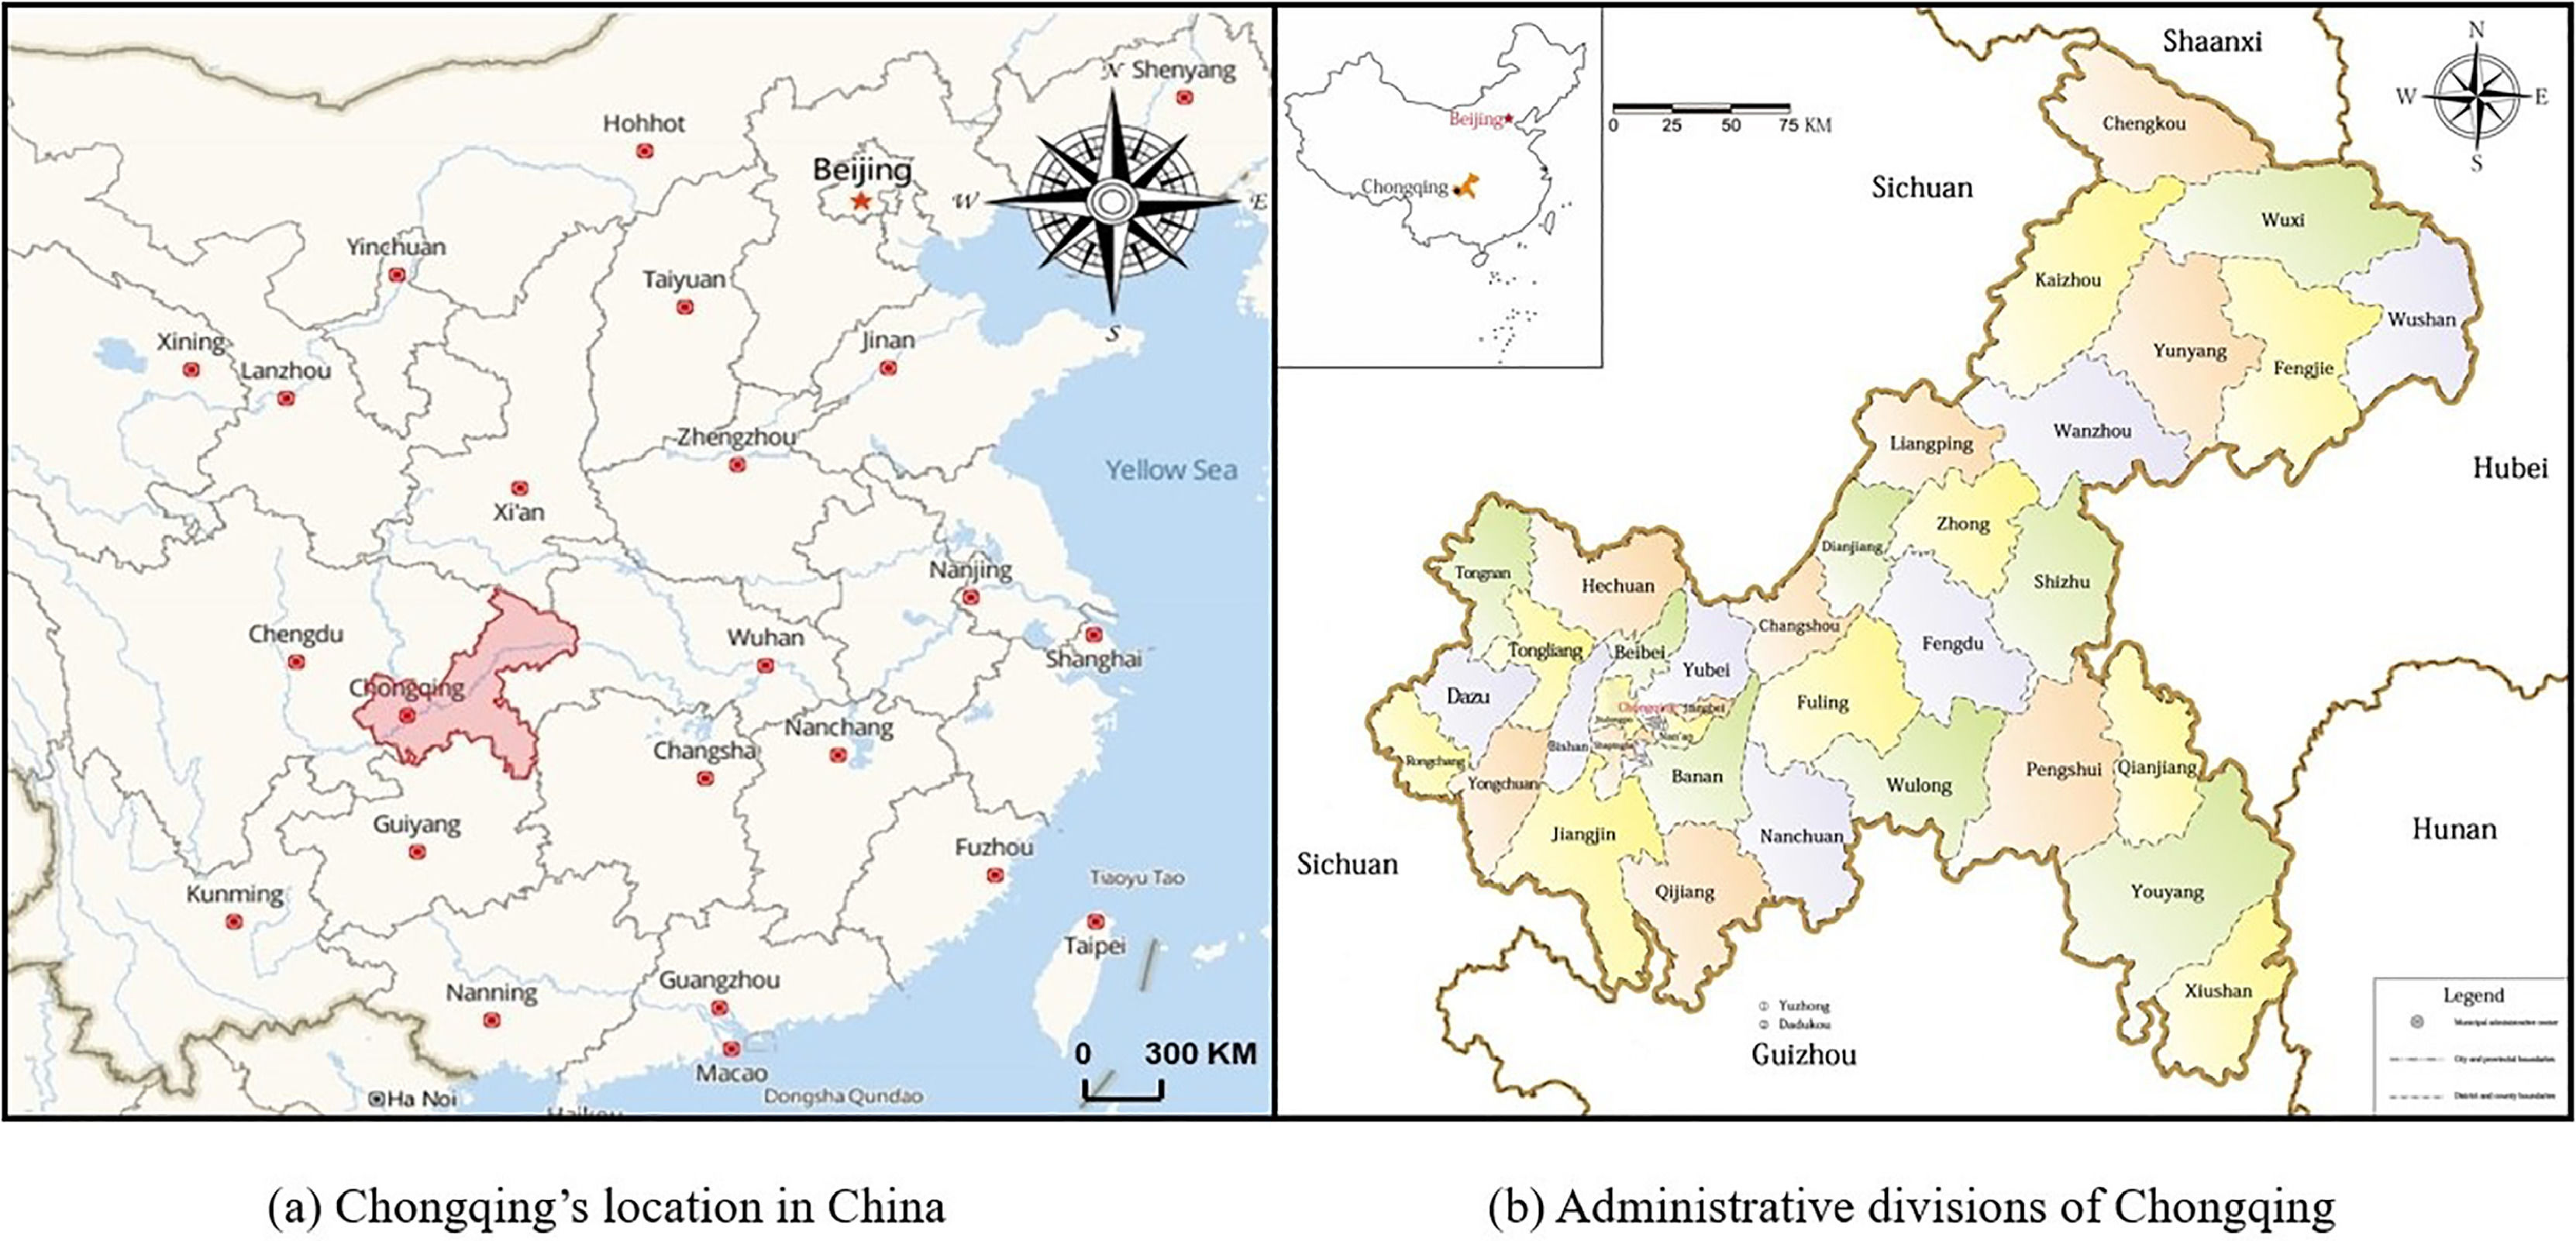
This study conducted a case study in Chongqing, China, located in western China. Chongqing is one of the four central municipalities directly under the central government (see Fig. 2) and is currently listed as a priority area for developing smart cities in China. It is a typical city for economic development through DT and has achieved explosive industrial growth, with big data and artificial intelligence as its core industries, through three central policies: fostering smart equipment industry clusters, implementing smart manufacturing projects and building a comprehensive public platform (Li & Woolrych, 2021).

In this context, the digital economy has become necessary to fuel Chongqing's economic development. Based on existing relevant research (Huang & He, 2013; Wang & Chen, 2021; Wu et al., 2022) and the reliability of data sources, we chose the initial DT policy indicator system; however, the relevant data may be biased due to the Corona Virus Disease 2019 (COVID-19) outbreak in 2020 and China's urban closure policy from 2020 to the present. Therefore, this paper selects the data from 2011 to 2019, as shown in Table 1, which has significant research implications. First, it has become the consensus that the pandemic has stabilised and most countries co-exist with COVID-19. Second, the DT advantage in China has not developed significantly until recently; therefore, prior retrospective policy and prospective preparation are crucial.
The initial DT policy indicator system.
Most data indicators are from the China Statistical Yearbook, Chongqing Statistical Yearbook and China Science and Technology Statistical Yearbook for the years. It should be noted that we have used interpolation to fill in the blanks because there are a few cases of omissions or errors in the data.
Based on the basic concepts of the techno-economic paradigm of the digital economy, we have constructed a preliminary system of evaluation indicators. The four guideline layers cover 21 indicators in total, which should be further filtered. Specifically, a Kaiser–Meyer–Olkin (KMO) value of less than 0.5 implies inadequate data for the underlying analysis. Furthermore, a p-value of less than 0.05 indicates that the data meet the standard and the variables are relatively independent. In this paper, factor analysis of the relevant indicator data was conducted with STATA software. The KMO and Bartlett tests for the four different attribute criterion layers were suitable for principal component analysis (see Table 2).
The remaining indicators were subjected to principal component analysis; the principal components with a value greater than one and a cumulative variance of 80% or more at each criterion level were selected. At the development of the digital industry criterion level, the first principal components were extracted, with a cumulative variance of 80.086%. The first and second principal components were extracted at the digital governance criterion level, with a cumulative variance of 93.688%. The first principal components were extracted at the digital infrastructure criterion level, with a cumulative variance of 94.804%. The first and second principal components were extracted at the financial input criterion level, with a cumulative variance of 88.509%.
Subsequently, indicators with a first component value coefficient greater than 0.8 were retained, along with the indicator with the highest absolute value of the second principal component factor value coefficient at each criterion level. Finally, we removed two indicators: the transaction of technology exchanges and amount of information the government actively disclosed (see Table 3).
Principal component factor weighting coefficients.
China is the world's largest telecommunications market; personal internet usage is higher than the global average, and ICT has penetrated urban and rural China (Wang et al., 2021). In recent years, China has introduced the concept of ‘New Infrastructure’, which aims to build information infrastructures, such as 5 G base stations, artificial intelligence, Internet of Things and others (Wu et al., 2021). Infrastructure construction is an essential prerequisite for China's DT policy. Given that the development of DT policy must consider the existing infrastructure, this paper has selected indicators that traditionally reflect China's digital information base. For example, the length of fibre optic cable lines and mobile phone base stations reflect the capacity of the telecommunication base, and mobile phone exchange capacity reflects the capacity of the network communication base.
Financial inputFinancial input is a core indicator of the strength of DT policy implementation, directly or indirectly reflecting the level of government support. For example, information transmission, computer services and software construction projects reflect the government's support for ICT enterprises. In contrast, government spending on science and technology reflects its commitment to DT diffusion, including, for example, the cost of making digital information available to the population. The above two indicators are essential for overcoming the digital divide and reducing regional imbalances (Wang et al., 2021).
Development of the digital industryThe development of digital industries is a critical indicator of the effectiveness of DT policies, representing the size of the local digital economy in terms of industry, employment and investment development. This component reflects the development of DT and the efficiency improvement of the whole industry.
Digital governanceDigital industrialisation alone cannot effectively measure the full impact of DT policies on the local economy. Zhang et al. (2021) argues that ‘digital economy + government’ and ‘digital economy + people's livelihood’ are two essential aspects of digital inclusion development. At the same time, digital governance also reflects the application of the digital economy in government (Zhang et al., 2021).
Entropy technique for order of preference by similarity to ideal solution (TOPSIS) method to calculate the indexBasic steps of the entropy-weighted TOPSIS methodThe TOPSIS is one of the most known and commonly used methods. Its usage spectrum is so broad that it is hard to find a problem that this method was not tried to solve (Behzadian et al., 2012). TOPSIS is also known as the ‘Approximation to Ideal Solution Ranking’ method, where the best object is the one that is closest to the optimal target and furthest from the worst target; best and worst are established by determining the positive and negative ideal values of the different evaluation units, thus deriving the closeness of the evaluation unit to the optimal solution (Deng et al., 2000). The entropy TOPSIS model uses the concept of information entropy to determine an indicator's weight based on the indicator itself and then uses the systems engineering multi-objective system decision-making TOPSIS analysis method to make a comprehensive assessment of policy effects (Kuang & Chen, 2007; Zhao & Yang, 2019). The weight vector must be specified with this method, and data normalisation is also required to obtain correct results (Paradowski et al., 2020). Based on the data from various fields, several other methods are later used for verification, confirming that the entropy TOPSIS method is the most suitable for this paper.
Construction of the decision matrixAssume that there are m evaluation indicators, n objects to be evaluated and Xij is the data corresponding to the jth object to be evaluated under the ith evaluation indicator (i=1,2,...,m;j=1,2,...,n). Thus, a matrix RXas Eq. (1) can be constructed:
Standardisation of indexes
Before the normalised decision matrix can be calculated, the indicators must be standardised. Data for individual indicators can vary in units and magnitudes; therefore, data collection should be dimensionless to prevent extraneous factors, such as magnitudes, from interfering with the accuracy of the DT policy and other indicator measurements. The indicators selected in this paper are all positive and are standardised by Eq. (2). Following the standardisation of indexes, the indicator of the standardised index matrix isYij.
Entropy weighting method to calculate the weights of indicators
After standardisation, a new matrix RY is obtained by Eq. (2), and the weights are determined by the entropy weighting method as Eq. (3).

Based on the new matrix RY, the weight of the jth object to be evaluated under the ith evaluation indicator Pijis calculated by Eq. (4).

We calculate the entropy value of the ith evaluation indicator eiby Eq. (5).

We calculate the entropyWiby Eq. (6).

In information theory, the entropy weight represents valuable evaluation index information. Therefore, the higher the entropy weight of the index is, the more useful its information is; the reverse is also true (Li et al., 2011).
Structure of the decision matrixBased on the original matrix RX, the TOPSIS method requires normalisation of the decision matrix to improve the comparability of data across indicators for calculation and analysis. As all data are positive, the matrix is normalised by Eq. (7).

Subsequently, normalised indicators Xij′ give the decision matrix RX′shown as Eq. (8)
Determination of the weighted decision matrix
Each vector in the normalised decision matrix is multiplied by the weight of the indicator corresponding to that vector to obtain the weighted normalisation index Vij by Eq. (9).

We calculate the weighted normalisation matrix Vshown as Eq. (10):
Determination of the ideal solution
Positive and negative ideal solutions are determined based on the optimal value of indicators for different attributes. We express the positive ideal solution V+ and the negative ideal solution V− in terms of number sets, as shown in Eqs. (11) and (12):
Calculation of the distance


The Euclidean distance between each evaluation object and the ideal and negative ideal solutions is calculated by Eqs. (13) and (14). The Euclidean distance from the evaluated object for the positive ideal solution V+ isDj+; the Euclidean distance from the object to be evaluated to the positive ideal solution V− isDj−.


Then, we calculate the relative closeness to the ideal solution by Eq. (15). The Euclidean distance is calculated for each object to be valued, and the relative posting progress is used as a comprehensive evaluation value for the object to be valued as Cj.
DT policy index in Chongqing
Following the improved entropy weighting method described earlier, each indicator's weighting coefficients can be obtained by substituting the relevant data into the corresponding formula; the results are shown below (Table 4).
The weighting of DT policy evaluation indicators.
The two distances, V+ and V−, were sorted in descending order for the calculated V+ distance and ascending order for the V− distance; the sorting results were consistent, verifying the reliability of the results. The weighted normalised decision matrix is derived from the weights of the DT policy indicators, and the distance to the positive ideal solution and the distance to the negative ideal solution are calculated; the DT policy index ideal Cj is obtained according to the Euclidean distance formula. This paper defines the ideal distance in the entropy-weighted TOPSIS method as the DT policy index to facilitate understanding. The distance of every feasible solution from the ideal solution and the negative ideal solution is obtained according to Eqs. (13) and (14). The relative degree of approximation is determined using Eq. (15). The results are shown in Table 5.
Relative distance and level of policy for digital technologies from 2011 to 2019.
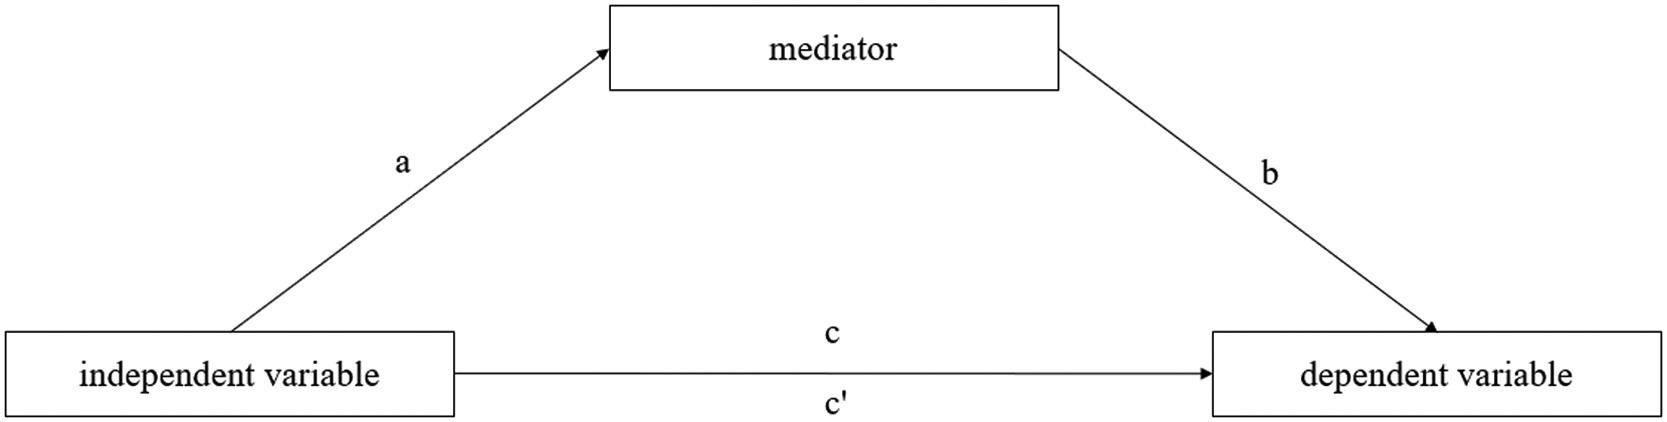
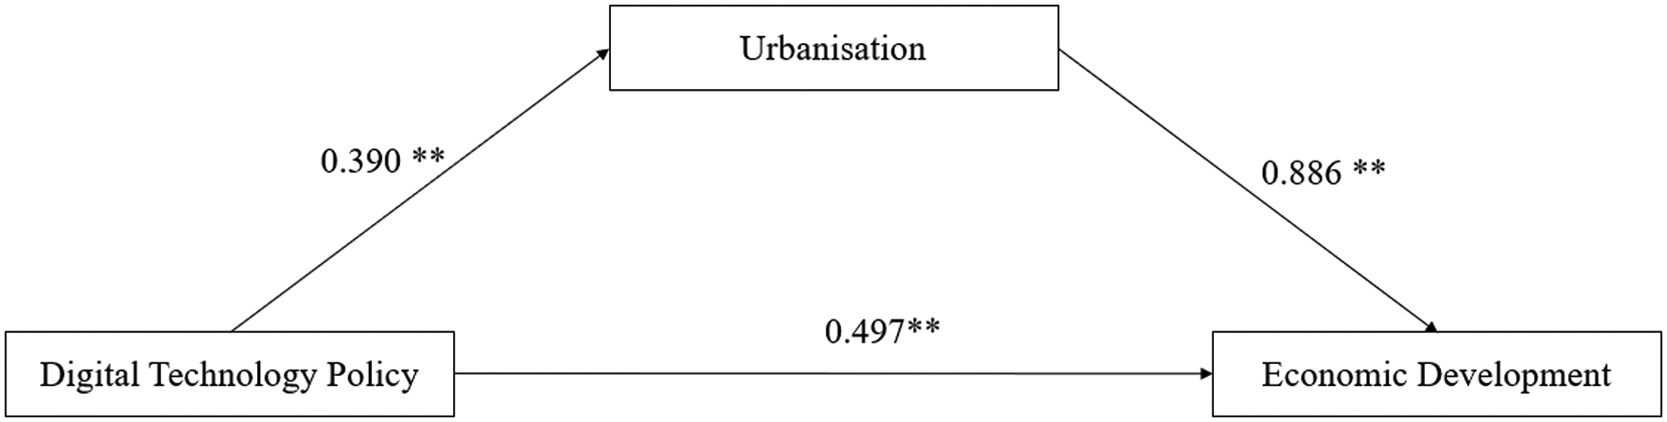
Reuben M provides a test method (Baron & Kenny, 1986). In Fig. 3, path a indicates that the independent variable influences the mediator, while path b denotes the effect of the mediator on the implicit variable. Path c indicates the total effect of the explanatory variable on the variable being explained. Finally, path c’ indicates the direct effect of the explanatory variable on the variable being explained when path a and path b are controlled simultaneously.

This paper draws on the bootstrap approach proposed by Preacher & Hayes (2004). Compared to the earliest causal stepwise regression methods, the bootstrap method has some improvements. First, the presence of mediating effects does not require a significant main effect. Second, partial mediation means that there are still mediating paths that have not been revealed. Finally, the bootstrap method reduces the probability of making a type of error and is easy to use (Wen & Ye, 2014).
Based on the above theory and mediating effects model constructed by Jin et al. (2017) and Lv et al. (2021), we build the following models. In these models, t represents the year, and ε is a random disturbance term; dtpt represents the level of the DT policy index, and gdptrepresents economic development indicators, reflecting the economic development of Chongqing. urbt represents the level of urbanisation development and is the mediating variable in this paper. contral_(j,t) is the control variable; superscripts 1 and 2 indicate different sets of control variables.
gdpt is expressed as Eq. (16):

a1measures the total impact of DT policy on economic development.
urbt is expressed as Eq. (17):

b1measures the impact of DT policy on urbanisation.
gdpt is expressed as Eq. (18):

c1measures the direct impact of DT policy on economic development.
Summing up the above Eqs. (16)–(18), we acquire Eq. (19):

The coefficient c2b1 represents the indirect impact of DT policy on economic development through the intermediary role of urbanisation. The magnitude of the direct, indirect and total impact of numerical DT policy on economic development can be obtained by using the above Eq. (19).
Data sources and variable selectionTo test our hypotheses, we used disaggregated data relating to DT policy and economic development in Chongqing from 2011 to 2019. The data comes from the Chongqing Statistical Yearbook, China Statistical Yearbook, China Economic Network Statistical Database and the compilation of statistical data for 60 years of the People's Republic of China.
Explanation of variablesThis paper considers the impact on the economic development index in two aspects: DT policy and urbanisation. The calculation of the above variables can be found in Table 6.
Definition of main variables.
Following existing research (Ambarwati et al., 2017; Pokharel et al., 2021; Xiao et al., 2021), this paper constructs a transaction efficiency index to measure transport development. This section's calculation procedure is partially omitted because the subsequent calculation procedure applies the same equations and techniques as the DT policy index above.
Several significant aspects of traffic facilities and transport capacity were initially selected for the transaction efficiency index. These included road mileage, number of road bridges, mileage of inland waterways, number of navigable cities, number of flight movements at airports, length of shoreline at ports and terminals and railway mileage. After further screening, a streamlined traffic indicator system and transport indicators with a KMO value of 0.676 and a p-value of 0.000 were obtained. Then, the weights of the traffic indicators were obtained by the entropy-weighted TOPSIS method above (see Table 7).
Transport indicator weighting.
The above indicators are dimensionless, and each year's traffic index is calculated according to the entropy-weighted TOPSIS method (see Table 8).
Transport index in Chongqing.
This paper used STATA 17.0 Parallel Edition to assist in the computation of statistical data. The outcomes given in Table 9 are the consequence of including the aforementioned factors in the regression equations.
Regression results*.
| Variable | M: Urb | Y: Gdp | ||||
|---|---|---|---|---|---|---|
| Coefficient | SE | 95%CI | Coefficient | SE | 95%CI | |
| constant | 0.3322083⁎⁎ | 0.0739743 | 0.0967889,0.5676276 | −0.0586755 | 0.0565819 | −0.3021278,0.1847767 |
| X: dtp | 0.3898659⁎⁎ | 0.0978773 | 0.0783766,0.7013552 | 0.1517488 | 0.0675578 | −0.1389289,0.4424265 |
| M: urb | None | none | none | 0.8859⁎⁎ | 0.158911 | 0.2021612,1.569639 |
| pgy | −0.442582⁎⁎ | 0.1015862 | −0.7658747,−0.1192892 | 0.0266084 | 0.0756854 | −0.2990395,0.3522562 |
| tra | 0.364977⁎⁎ | 0.0709893 | 0.1390573,0.5908967 | 0.0074909 | 0.0612017 | −0.2558388,0.2708205 |
| ulr | 0.1606613 | 0.0780079 | −0.0875947,0.4089174 | 0.0306367 | 0.0333591 | −0.112896,0.1741694 |
| lan | −0.0996352 | 0.0853868 | −0.3713741,0.1721038 | −0.0134396 | 0.0283378 | −0.1353675,0.1084882 |
| R-sq | 0.9930 | 0.9997 | ||||
| F-test | 84.99⁎⁎ | 977.47⁎⁎ | ||||
We then use the bootstrap of STATA software to test the mediating effect by repeating the sampling 5000 times and calculating at the 95% confidence interval (Fang et al., 2012). The results are shown in Table 10.
According to Tables 8 and 9, none of the confidence intervals for the indirect effects include 0, while the confidence intervals for the direct effects include 0, indicating a partial intermediation effect in the model. The total impact of the DT policy indicator on economic development is a1= 0.497, suggesting that for every unit increase in the DT policy indicator, economic development increases by 49.7%. The direct impact of the DT policy indicator on economic development is c1= 0.152; for every unit increase in the DT policy indicator, economic development is induced to increase by 15. 2%. The magnitude of the indirect effect of urbanisation on economic development is c2b1 = 0.345, showing that each unit increase in the DT policy indicator leads indirectly to an increase in the economic development of about 34.5% through urbanisation. The mediating effect of urbanisation is 0.695, accounting for 69.5% of the total impact of DT policies on economic development (see Fig. 4).
Robustness testSobel verification
The Sobel test divides the mediating effect estimate by the standard error of the mediating effect estimate to obtain a z value, which is compared with a critical z value based on a standard normal distribution. If the z value is greater than the critical z value, the mediating effect is present; if the z value is less than the critical z value, the mediating effect is not present (MacKinnon et al., 2002). According to the Sobel–Goodman mediation test result (see Table 11), P being less than 0.05 means that the original hypothesis is rejected. In addition, the mediating effect holds, and 69.5% of the total effect is mediated.
Retest with ‘science and technology expenditure’ as the independent variableThis paper also verifies the robustness of the model by replacing the independent variables to prove the scientific validity of the findings. Technology spending and DT policies influence each other and have a long-term correlation with regional economic growth (He, 2011). Therefore, this paper chooses technology expenditure as a replacement for the DT policy variable; we use the fiscal science and technology expenditure proportion to total fiscal expenditure for the year as a measure. As shown in Table 12, compared with the baseline regression results, the model's significance and the coefficients’ sign are consistent, except for a slight change in the magnitude of the coefficients, proving that this paper's conclusions are highly robust.
Result for the science and technology expenditure as an independent variable*.
| Variable | M: Urb | Y: Gdp | ||||
|---|---|---|---|---|---|---|
| Coefficient | SE | 95%CI | Coefficient | SE | 95%CI | |
| Constant | 0.322163⁎⁎ | 0.0914574 | 0.0311047,0.6132213 | −0.0798949 | 0.0355333 | −0.2327823,0.0729926 |
| X: ste | 0.4039748⁎⁎ | 0.1259587 | 0.003118,0.8048316 | 0.1492691 | 0.0454429 | −0.046256,0.3447942 |
| M: urb | None | none | none | 0.9271709⁎⁎ | 0.098978 | 0.5013029,1.353039 |
| pgy | −0.3931432 | 0.1317686 | −0.8124895,0.0262032 | 0.0678523 | 0.0449942 | −0.1257423,0.2614468 |
| tra | 0.3295436⁎⁎ | 0.0904466 | 0.0417023,0.6173849 | −0.023162 | 0.0361155 | −0.1785546,0.1322306 |
| ulr | 0.2573406 | 0.0843759 | −0.0111811,0.5258622 | 0.0567785 | 0.0292918 | −0.069254,0.182811 |
| lan | −0.2909257⁎⁎ | 0.0859963 | −0.5646042,−0.0172472 | −0.0760888 | 0.0323499 | −0.2152791,0.0631016 |
| R-sq | 0.9900 | 0.9998 | ||||
| F-test | 59.68⁎⁎ | 1774.69⁎⁎ | ||||
The digital economy's development is not simply about using information technology but about integrating knowledge and mechanical models with data models from past industrial enterprises to reinvent, reconfigure, reorganise and reengineer the business. In this process, digital policy, as well as a strategy and plan for developing the digital economy, has significantly impacted national urbanisation.
With the promotion of China's DT policy, DT's rapid development has played a critical driving role in industrial integration. Based on the objective of studying the relationship between DT and urbanisation, this paper takes the digital technology data of Chongqing, a typical city in China, as an example. We construct the measurement indicators of DT policy from the four aspects: digital infrastructure, financial input, development of digital industry and digital governance. This paper discusses the impact of DT policy on economic development through the mediation modelling analysis, and the following three points can be concluded.
(1) Formulating DT policies can effectively promote economic development. The digital economy reduces costs through knowledge spillover and integration with the primary industry to promote industrial innovation (Pan et al., 2021). China attaches great importance to digital policy, both an opportunity and a challenge for development. On the one hand, the policy could lead to more capital investment in digital service-oriented enterprises, promote the development of the digital economy and accelerate the digitisation process of cities. On the other hand, policy over-investment may bring a series of negative impacts. As the urbanisation of local populations increases, excessive government policies can weaken the role of urbanisation in promoting economic development and the positive role of expanding the scale of government spending, creating a vicious circle in local economic development. Regarding the empirical results of digital policy on local economic development, in addition to the need to continue to develop DT infrastructure, such as the establishment of industrial parks and policy support for related enterprises, it is also necessary to pay attention to aspects of talent development, such as professional teaching practices.
(2) In urbanisation, DT policies can mitigate some of the challenges caused by structural changes. While future predictions on how technological progress and automation can affect rural economies are difficult to make, many rural regions are still greatly influenced by digital policy. Technological progress can reach everywhere and lead to negative or positive outcomes at the local level. Rural regions must invest in local capacities to trigger long-term investments and policy foresight. In many ways, DT policies are compatible with the process of urbanisation. For example, the Chinese government is working to bridge the ‘‘digital divide’ between urban and rural areas, which can help farmers to receive and share information faster through more channels, reducing information asymmetry and increasing income. The Chinese government sees urbanisation as a vital component of its Rural Revitalisation Strategy, which intends to offer farmers a vast number of job changes, production and commercial prospects and enhances various sorts of property revenue. As a result, the digital policy provides new economic models to realise optimal resource allocation based on information technology, serving as a network platform for aggregation, optimisation and distribution of production factors. Promoting economic development can also help with resource allocation in urbanisation construction.
(3) Urbanisation partially mediates DT policies and regional economic development, revealing how urbanisation influences digital policy to drive local economic development. Digital policy-encouraged technology-oriented industries, based on the internet and data as a factor of production, incentivise urbanisation to drive economic growth. While increasing total factor productivity, urbanisation also breaks down the urban–rural divide, enhancing resource allocation efficiency in space. DT policies drive technological innovation while strengthening the economic interaction between urban and rural areas, such as the planning of Xiantao data Valley in Chongqing and the construction of information infrastructure. Moreover, DT policies could stimulate the creation of new economic sectors and thus promote the convergence of different industries, profoundly impacting the urban–rural divide (Gereffi, 2001; Ren & Chao, 2018).
The policy is crucial in digital technologies, which can play an essential function in sustainable economic development and overcoming the digital divide. Based on the results of the empirical study above, this paper makes the following recommendations.
(1) The government could improve human capital and adapt society and businesses to digitalisation, thereby promoting the practical application of digital technologies and reducing the urban–rural divide (Grigorescu et al., 2021). The interplay between digital policy and urbanisation is complex, and their contribution to economic development is only meaningful when a certain threshold is crossed. Urbanisation development is not about blindly expanding the land area of cities but about changing the original industrial structure of urban–rural isolation and increasing the productive capacity of the rural labour force. Therefore, it is a reasonable development direction to cultivate rural talent with transferable skills and make the digital industry a supplement to the rural economy.
(2) The government could use DT policies to promote the transformation of rural industries and economic development. In the context of the digital economy, the development and application of ICT have led to changes in resource allocations throughout society, which has essentially broken down urban–rural isolation. DT policies have boosted regional economic development and helped transform rural industries. For example, the development of ICT has enabled agricultural operators to implement more accurate and scientific field management, reduce the impact of natural disasters and increase the efficiency of agricultural production. By reducing transaction costs and improving transaction efficiency, traditional rural industries have obtained greater scope for development, which is consistent with the aims of urbanisation.
(3) The government must continue strengthening its infrastructure, including traditional infrastructures, such as transport facilities and logistics networks; it also requires IT infrastructure, such as big data centre platforms. The construction of the digital economy is somewhat the same as the construction of cities, meaning that the digital divide mainly comes from the lagging development of rural areas. Therefore, the digital policy could focus on improving digital infrastructure development in rural areas to provide a high-quality infrastructure for business development.
(4) DT could develop forward-looking policies and regulations with greater involvement of marginalised communities. New technologies can modify how people access public services and interact with society. Under reasonable supervision, the digital economy can effectively reduce transaction costs, form larger markets, accelerate commodity circulation and improve the radiation of central cities to surrounding areas, reflecting the intermediary role of urbanisation in DT policy and development.
The conclusions of the previous literature have tended to identify spatial differences (digital divides) in digital development at a regional level (Lucendo-Monedero et al., 2019; Song et al., 2022; Zhu & Chen, 2022) or analyse the impact of digital technologies on urbanisation at a legal level (Zhang & Zhou, 2022). Both approaches are confined to the traditional urban–rural dichotomy (Wang & Chen, 2021); however, researching the impact path of DT policies beyond the dichotomy is necessary because it has become an essential component of global urban construction. This study's results represent a novel contribution and enrich the literature on the industrial restructuring in cities driven by the digital economy. The study makes several contributions. (1) A three-level indicator system based on a practical DT strategy was constructed, which can be used to analyse different countries or geographical regions. (2) Benefiting from regression modelling methods and the Sobel–Goodman approach, the essential role and specific impact pathways of urbanisation in DT policy and economic development were analysed to provide a reference for digital economy-driven cities. (3) The direction of DT policy to adjust the urban–rural structure was analysed. In summary, this paper emphasises that the urbanisation driven by the digital economy is not simply the application of information technology and the expansion of cities but the synergy and interaction of knowledge, industrial structures and resource allocation.
There are several limitations to this study. First, this paper only uses GDP as an indicator to measure economic development. Although it is a crucial indicator of economic development, in practice, we could also consider factors such as the income gap, consumer price index and changes in industrial structure. Second, although the robustness test was conducted, the paper could have been extended to other global cities, especially those with economic development differing from Chongqing, to verify unique distinctions in the impacts of DT policies. Finally, further research is needed on how DT policies can use technological innovation and cooperation with local communities to support the structural transformation of industries in rural areas.
Funding statementThis work was supported by the General Project of National Social Science Found "Research on Legal Mechanisms for Promoting Green Building Development in Urban Renewal" (Approval No.: 21BFX136); And the Research Project of Humanities and Social Sciences of Chongqing Municipal Education Commission for the Year 2021: "Research on Public-Private Contracts of Nursing Institutions in the Context of Smart Elderly Care" (Approval No.: 21SKGH402); And the project of higher education scientific research program of China Association of Higher Education for the Year 2022″:Research on the legal protection system of university foundations"(Approval No. :22JJ0304)
Data availability statementThe data used to support the findings of this study are included within the article.