


This is the first attempt to examine empirically the effects of the implementation of digital public services (DPS) on the value of trade in green goods (TGG). By applying diverse econometric techniques to a sample of 25 European economies for the period 2012–2019, the results show that DPS captured by three indices (user-centricity, business mobility, and key enabler) has a modest influence on the level of TGG. The results are robust. A higher level of DPS implementation appears to drive up the export value of green goods, and there is evidence of the long-term cointegration of DPS and TGG. Furthermore, the nexus between DPS and TGG is evident in two subsamples of developing and developed economies, but the importance of DPS is more pronounced in the former. Finally, the effects of DPS on TGG value become more significant in the European economies with a well-developed institutional system.
In the latest Global Risks Report, environmental issues continue to be ranked as one of the top five global risks in terms of their likelihood and consequences, while emerging issues have posed new global challenges (Global Risks Report, 2021). Energy efficiency and reducing pollution are considered to be integral to the modern world and critical determinants of the sustainable growth of every economy (Lyu, Khan, Zakari & Bilal, 2021; Zahoor, Khan & Hou, 2021; Zakari & Khan, 2021a; Zakari, Khan, Tan, Alvarado & Dagar, 2022). Using a database of thirty International Energy Agency (IEA) member countries, Khan and Hou (2021) highlight the importance of environmental sustainability and pollution. Furthermore, environmental sustainability plays a critical role in the pursuit of sustainable development goals in every country (Zakari et al., 2022). In the literature, there are many empirical studies on the determinants of environmental sustainability, such as the role of green innovation (Zakari et al., 2022); economic growth, international trade, clean energy investment (Lyu et al., 2021); industrial value-added, capital formation, urbanization, population growth, biocapacity (Yang & Khan, 2021); energy consumption, tourism growth (Khan & Hou, 2021a); and partnerships between countries (Tawiah, Zakari & Khan, 2021). More recently, the role of green finance in promoting environmental performance has been highlighted (Zakari & Khan, 2021b). Although the determinants and influences of environmental sustainability have attracted a lot of attention from scholars, there are still unexplored dimensions of environmental sustainability that require further study.
Companies are increasingly aware of the importance of environmental protection in enhancing their reputation and achieving a sustainable competitive advantage, and so they consider environmental protection to be a condition of their operations (Farhadi, Ismail & Fooladi, 2012; Kim, 2018; Singh, Chen, Del Giudice & El-Kassar, 2019; Yadav & Iqbal, 2021). Some environmental issues, such as ecosystem conservation, air quality, sustainability of resources, and maintenance of a clean and healthy environment, are closely monitored by firms (Żelazna, Bojar & Bojar, 2020). Many corporate leaders recognize that business costs, reputation, comparative advantage, and profit, are all positively and significantly affected by the application of environmental standards to their operations (Liu, Koehler, Gailhofer, Gensch & Wolff, 2019). As a result, many firms have implemented effective solutions, such as recycling at work, encouraging green communities, establishing sustainability committees, and adopting new trends in digitalization. Environmental protection is becoming more important than ever in the current context of rapid industrialization and urbanization (Patnaik, 2018). Although European countries have made remarkable progress over the past two decades in reducing greenhouse gas emissions and strengthening protection of the natural environment, they face still significant environmental challenges; including loss of biodiversity, the effects of climate change, and exhaustion of natural resources.1
There is growing interest in the literature in the role of trade in green goods (TGG) as a means of reducing pollution while increasing economic growth, by transforming production from pollution-intensive to pro-environmental products, and encouraging technological innovation (Zugravu-Soilita, 2018). TGG tends to be more complex than trade in conventional goods, and there are few reports in the literature examining potential drivers of TGG. However, Cantore and Cheng (2018) and de Melo and Solleder (2020) are among a few exceptions, with the former focusing on the role of stringency in environmental regulation and the latter analyzing the removal of tariffs and non-tariff measures. It is still unknown which countries should specialize in exporting green goods. In this study, we focus on exploring the influences of digital transformation.
The explosion in the use of information technology has changed many aspects of human life, and digitalization has gradually transformed methods of information distribution. However, several issues arise from the misuse and abuse of digitalization if its characteristics are not clearly understood (Vial, 2019). Digitization is defined as automated processes and tasks, such as converting information from analog to digital. By contrast, digitalization represents the incorporation of digital components into products or services, and digital transformation is related to the comprehensive introduction of new business models and digital platforms (Feroz, Zo & Chiravuri, 2021). Both digitization and digitalization involve the utilization of a digital tool to scan an analog record into a digital record, which can be saved in PDF format (Brennen & Kreiss, 2016). However, digitization puts the PDF format in storage such as a hard disk on a computer, while digitalization synchronizes this PDF file to the Internet or a cloud service for unlimited access. This study ignores the differences between these definitions, and they are employed similarly to serve the main objective of considering the impact on the economy and the environment. Although digitalization in the European Union has been uneven, it is still the main driver of economic and social development (McKinsey Report, 2016). Furthermore, in a recent survey, 70% of directors from Austria, Germany, and Switzerland, confirmed that the pandemic could accelerate the speed of digital transformation (Ionescu, Iordache & Țițan, 2021; Pashkus, Bavina & Egorova, 2021).
The Covid-19 pandemic has changed some aspects of the perceived relationship between digitalization and different environmental issues. The pandemic has become a severe crisis for all global economies and societies (OECD, 2021). However, measures to limit person-to-person contact, as well as movement restrictions, have markedly improved air quality (Dobson & Semple, 2020). Further, pandemic measures such as social distancing and lockdowns have fueled an increase in the utilization of digital technology (De’, Pandey & Pal, 2020). However, people working and studying from home have increased demand for new electrical and electronic devices to replace older equipment, increasing e-waste and emissions. Similarly, working remotely can also devalue commercial real estate in the long term (Gilles, 2020) .2 These are considered to be the direct effects of Covid-19 on the environment in terms of waste management (UNEP, 2021) .3
Digitalization affects the environment through diverse transmission mechanisms. First, the application of technology improves the efficiency of e-waste collection and recycling and the reuse of materials, thus creating a circular economy (European Commission, 2019; European Green Deal, 2021) .4 Many scholars are analyzing the benefits of applying digitalization to solve pressing environmental problems, such as the disposal of solid waste, e-waste, food waste, and agricultural waste (Ferrari et al., 2020; Genuino, Bataller, Capareda & de Luna, 2017; Gu, Ma, Guo, Summers & Hall, 2017; Lu, Chen, Ho & Wang, 2016; Sharma, Yadav & Chopra, 2020; Wen, Lee & Song, 2021). A favorable perspective is that digital technology can be used in a way that helps to reduce pressure on the natural environment and biodiversity. According to Ran et al. (2019), information and communication technology increases the effectiveness of public policies and citizens' perceptions through the visualization and communication of biological data or viable digital business models that reduce the loss of biodiversity. In addition, digitalization enhances pollution control, sustainable production, and sustainable urbanization. Digital technology can enable granular and flexible management of air and water pollution in the chemical and heavy industries, and can even help play a key role in resolving environmental problems such as air pollution, carbon emissions, wastewater treatment, and climate change (Chen, Shao, Tian, Xie & Yin, 2017; Feroz et al., 2021; Honarvar & Sami, 2019; Idrees & Zheng, 2020). Companies are gaining better capabilities for predicting the benefits and outcomes of applying technology to their production and business, leading to sustainable development. Thanks to digitalization, companies can realize more innovative and more sustainable production in green energy, energy saving, or renewable energy consumption (Ran et al., 2019). Moreover, applying digitalization to harmful environmental activities reduces operational costs and improves worker safety (El-Haggar, 2007; Zhang, Ren, Liu & Si, 2017), while minimizing resource utilization and degradation (Roy & Singh, 2017). Based on the findings of Feroz et al. (2021), many researchers are interested in the impact of digitalization on the relationship between ecosystems and human well-being, because digitalization can be used to resolve problems of lack of resources, traffic congestion, and air pollution (Ha, 2022; Honarvar & Sami, 2019; Lu et al., 2016; Wu, Zhang, Shen, Mo & Peng, 2018).
The literature also highlights the effects of digitalization on trade performance (Alcácer, Cantwell & Piscitello, 2016; Azar & Ciabuschi, 2017; Bettiol, Capestro, Marchi & Maria, 2020; Laplume, Petersen & Pearce, 2016) and trade diversification (Chiarvesio & Romanello, 2018; Rehnberg & Ponte, 2018; Strange & Zucchella, 2017). However, prior studies only concentrate on the trade in conventional goods, and there are no studies investigating the impact of digitalization on the trade value of green (or environmental) goods. Given the importance of digitalization in augmenting sustainable development, we believe that digital transformation could influence TGG.
It is instructive to note that the influence of environmental sustainability and the impact of other factors on the environment may both be conditional on the quality of the institutional system. For example, Zakari and Khan (2021a) demonstrate that energy consumption in relation to economic growth depends on institutional quality and Chinese investment in Africa. Institutional quality is also important in the nexus between economic sanctions and environmental performance (Le & Hoang, 2021), and between economic complexity and energy security (Le, Hoang & To, 2022). Hence, it is reasonable to believe that the effects of digital public services (DPS) on TGG may also be conditional on the institutional quality.
To examine our belief, we use bilateral trade in the CLEG list obtained from the UN Comtrade database six-digit level of the 2007 version of the Harmonized System (HS 2007), along with economic complexity taken from MIT Media Lab's Observatory of Economic Complexity. Regarding digitalization, we employ three indices: user-centricity, business mobility, and a key enabler. Due to cross-sectional dependence, we use the panel-corrected standard error (PCSE) model and feasible generalized least squares (FGLS) model to examine the effects of digitalization on TGG, especially in the public sector. The two-step generalized method of moments (two-step GMM) is also applied to deal with the endogeneity. Furthermore, we examine the long-term cointegration between DPS and TGG. The autoregressive distributed lag (ARDL) method is applied to measure the short-run and long-run effects of DPS on TGG. The dynamic fixed-effects (DFE) estimator is employed to deal with time- and country-fixed effects (Canh & Thanh, 2020). Lastly, we investigate the moderating role of institutional quality on the DPS-TGG nexus. This study focuses on countries in the European region since data on digitalization is only available in this region.
We contribute to the existing literature in a number of ways. To our best knowledge, we are the first to analyze the relationship between DPS and TGG empirically. Using different measures to reflect the development of digital transformation in the public sector, we provide a comprehensive view of the influence of DPS on TGG, emphasizing the importance of DPS in the path toward sustainable development. The second novelty in this study is to distinguish between the short-run and long-run impacts of DPS and TGG. In other words, the development of TGG requires the long and persistent pursuit of digital transformation in the public sector. Our findings are critical to economists and policymakers seeking to select the strategic direction to pursue sustainable development through augmenting trade in environmental goods, or at least less environmentally harmful goods. Another contribution of this paper is to highlight the importance of institutional quality in enhancing the effects of DPS on TGG. We provide evidence to support the view that the impact of DPS on the value of TGG becomes more pronounced where economies have a well-developed institutional system. We confirm these conclusions by strictly following an empirical econometric approach and applying various techniques appropriate to data with cross-sectional dependence to control potential issues such as multicollinearity, heteroskedasticity, and endogeneity.
The rest of the study is organized as follows. Section 2 provides detailed reviews of relevant literature and develops hypotheses, while Section 3 introduces the model, data, and estimation method. Section 4 sets out the empirical results and discussion. We close the paper by providing conclusions in Section 5.
Literature review and hypothesis developmentDigitalization and exportTheoretical frameworkGlobalization has been presented as becoming a global fever since the appearance of digitalization. Small and medium-sized enterprises (SMEs) are no exception and have been shown to account for part of globalization, as theories highlight their integration. In exploring how digitalization and exporting correlate, our paper uses the resource-based view (RBV) proposed by Barney (1991) and Grant (1991), and the dynamic capability view suggested by Teece, Pisano and Shuen (1997). According to Lee and Falahat (2019), digitalization is a form of input similar to capital and labor, with the output being a competitive advantage in the global market. Therefore, under the assumption that digitalization, other resources, and capabilities are a company's input in a globalization context, we scrutinize the relationship between resources and capabilities.
Digitization has a complex definition, represented in the application of digital technology and infrastructure to diverse aspects of business, the economy, and society (Autio, Nambisan, Thomas & Wright, 2018). Digitization has dramatically changed many sectors of the economy since the start of the industrial revolution. Information technology is gradually becoming more common in production and industry. New business models have arisen, such as e-commerce, and are characterized by applying digital technology in processes from production to distribution. Based on the application of digital technology in their operations, SMEs can easily directly or indirectly gain a competitive advantage in the digital economy. Competitive advantage is crucial, especially when facing both domestic and foreign competitors. Competitive advantage, including price advantage (lower price), product advantage (better quality, more suitable design), and product copyright advantage (monopolistic products), plays a crucial role, enabling businesses to earn higher profits (Lee & Falahat, 2019). Porter (1980) identified three critical factors in increasing competitiveness: cheaper manufacture, better product design, and better shipping and after-sales support. In line with the RBV mentioned by Grant (1991), digitalization contributes significantly to the competitive advantage of internationalized firms. Hence, digitalization improves company competitiveness in the global market through its impact on competitive advantage in prices, products, and services.
To date, many studies have focused on issues faced by international businesses. However, the limitation to these studies is that they have looked at comparative advantage instead of focusing on operating effectiveness, profit margins, and brand coverage. Therefore, this paper sets out to overcome this limitation by examining how these advantages affect internationalizing enterprises in order to make recommendations on more rational resource allocation.
Digitalization and export performanceIn a competitive global economy, companies must improve production efficiency to compete, while also increasing revenue to enable better product development compared to competitors (Porter & Heppelmann, 2014), either by employing premium prices or reducing operating costs, or both. The Fourth Industrial Revolution has enabled a significant shift in the digital economy, with business models based on resources of greater value (Bettiol et al., 2020). Applying robotics, component manufacturing, the Internet, big data, and artificial intelligence, has gradually become the norm for enterprises when improving the efficiency of their production and business activities. Thus, cross-border business structures and processes are also significantly affected (Alcácer et al., 2016).
To a certain extent, digital transformation makes it easier for companies to operate internationally and expand their markets (Strange & Zucchella, 2017). Although internationalized processes strengthen competition between businesses, the development of advertising technology has helped businesses to market and promote their products to global customers and accumulate more data. Therefore, according to Azar and Ciabuschi (2017), companies must transform their technology to achieve good export performance. Enhancing innovation and digital transformation are prerequisites that enable exporting companies and their countries to reach higher growth levels. Industrialization can now not succeed without digitalization (Dalenogare, Benitez, Ayala & Frank, 2018), and productive enterprises can improve their efficiency by integrating the product manufacturing processes. Digital technology provides platforms for better communication and utilization of technology by exporting companies, enhancing corporate effectiveness. However, to accomplish optimal adaptation to international markets, enterprises should be innovative in their use of technology (Azar & Ciabuschi, 2017). In addition, the process of global specialization is gradually changing, with notable fragmentation since digital technology has been more widely applied to manufacturing (Laplume et al., 2016). Each production fragment takes advantage of diversity in capability around the world to be closer to purchasers and improve shipping and customer care, increasing competitiveness.
Digitalization and export diversificationDespite being the subject of controversial opinions among scholars, the impact of digitalization has not yet been examined (Chiarvesio & Romanello, 2018). From a favorable perspective, digital technology may facilitate expansion in terms of both scale and scope by removing limitations of time and geography (Rehnberg & Ponte, 2018). Likewise, big data and accumulated data about customers are closely linked to exporting (Strange & Zucchella, 2017), giving easier access to international markets and enabling companies to navigate these markets. Companies can gather information about new trends in other countries where their products are not yet sold, and exploit product design as a means of gaining competitive advantage, with the ability to identify markets and items suitable for different locations while streamlining production processes. The potential benefits that a company accumulates after analyzing customer data include the ability to take advantage of new business opportunities, particularly when looking to expand distribution to new markets. Where businesses in emerging and fast-growing countries are underperforming, digitalization is seen to have great potential for internationalized businesses intending to expand into new markets (Strange & Zucchella, 2017).
Digitalization and the environmentKhan and Hou (2021a) find that economic growth is often achieved at the cost of environmental sustainability; a higher level of economic development is accompanied by reduction in quality of the environment (Khan, Hou, Le & Ali, 2021). Khan, Hou, Irfan, Zakari, and Le (2021) report empirical evidence on the link between energy consumption and economic growth in both the short run and long run. The effects of natural resources, energy consumption, and some economic and social factors on environmental quality are explored by Khan, Hou and Le (2021). New evidence on the association between energy intensity, financial development, and environmental sustainability has been found recently in Asia Pacific Economic Cooperation countries by Khan, Hou, Zakari, Irfan and Ahmad (2022), and in OECD countries by Khan, Zakari, Ahmad, Irfan and Hou (2021). In general, although previous studies have examined both the causes and influences of environmental sustainability, they have not fully exploited the attendants of environmental sustainability. Furthermore, there are channels through which the effects of environmental sustainability, or the influence of other factors on the environment, can either be identified or mitigated. However, prior studies have not considered these channels. To our best knowledge, we are the first to examine the impact of digital transformation in the public sector on enhancing environmental sustainability. In general, previous studies contend that the Internet and technology improvement stemming from digitalization are positively associated with human capital and technological progress. Modern economic growth then shifts the quantity and quality of energy from conventional non-renewables to modern renewables, thus ensuring environmental sustainability (Khan et al., 2021).
Many controversies and discussions have revolved around the impact of digitization on environmental performance, with both negative and positive impacts reported (Liu et al., 2019). According to Feroz et al. (2021), digitalization affects environmental activities directly and indirectly through diverse transmission channels in many ways. The Internet underpins significant achievements in production and business activities in the economy; however, it also indirectly harms the environment (Salahuddin & Gow, 2016). Evidence for this argument is that electricity consumption has increased rapidly since the advent of digitization, leading to a scarcity of resources and the removal of green energy from the energy structure (Majeed & Tauqir, 2020). Despite these shortcomings, in general, digital technologies still contribute significantly to sustainable environmental development through applications and technologies for pollution control, waste management, and sustainable manufacturing and urbanization (Feroz et al., 2021).
To accomplish a circular economy and achieve environmental sustainability, recycling of e-waste and reuse of material still necessitates significant support from innovative, modern technology (Holger et al., 2020). Products with the ability to improve environmental sustainability can be advertised more widely using digital platforms (Feroz et al., 2021), while carbon emission reduction and other waste reduction can also be promoted thanks to the contribution of artificial intelligence (AI), the Internet of Things (IoT) and other technology-based data analytics (Melissa et al., 2019). Regarding uncertain, interactive, and dynamic environmental problems, AI is also considered to be an effective tool to help minimize complexity (Ye et al., 2020). In general, the demand for digital technologies to support environmental sustainability has been examined in different dimensions with different transformation tools. For instance, Weersink, Fraser, Pannell, Duncan and Rotz (2018) assert that food system traceability becomes more convenient and manageable based on big data and other best practices applied to production processes. Furthermore, we can expect that big data will help arrive at a turning point in control of CO2 emissions by enabling the large-scale deployment of next-generation green vehicles. In addition, Sharma et al. (2020) argue that AI and big data can be used with waste management, global warming, geographic information systems, and land-use planning problems. Esmaeilian et al. (2018) and Leng et al. (2020) favor the notion that blockchain plays a crucial role in sustainable manufacturing and business activities, including prolonging product life cycles, maximizing the efficiency of resource usage, and reducing carbon emissions. Gradually, digitalization is becoming key to greener and cleaner manufacturing processes and supply chains (Kerdlap, Low & Ramakrishna, 2019; Mao, Wang, Tang & Qian, 2019; Wang, Liang, Li & Cai, 2018). Substantial evidence demonstrates the effect of digitalization in encouraging green production by reducing the cost of renewable energy (Moyer & Hughes, 2012). In a recent trend, combining smart and sustainable cities, and promoting social welfare associated with ecosystems, has been found to result in sustainable urbanization (Bibri & Krogstie, 2017; Huang, Wu & Yan, 2015; Malik, Sam, Hussain & Abuarqoub, 2018). From the consumer perspective, digitalization stimulates and enhances the demand for non-fossil fuels and more environmentally friendly products (Pickl, 2019). Ultimately, the digital global socioeconomic system has significantly reduced transaction costs between spatially separated actors, eliminated asymmetric information, and further boosted green production and consumption through R&D spillover effects (Zafar, Ullah, Majeed & Yasmeen, 2020).
Empirical methodologyWe use both environmental and trade literature to develop a model to investigate the nexus between digital public services (DPS) and trade in green goods (TGG):
where subscripts i and t represent country i and year t, respectively.Trade in green goods
TGG represents the export value of green goods. Data on trade activities in APEC products were taken from the UN Comtrade database using the six-digit level of the 2007 version of the Harmonized System (HS 2007). Values are all expressed in current USD. To cover the years 1996 to 2019, the HS codes listed in APEC were converted from HS 2007 into HS 1996 using UN Trade Statistics.5 We take a natural logarithm of TGG (LnTGG) before incorporating it into the model.
Key explanatory variable: digital public servicesThe key independent variable, DPSi,t={DPS_UCi,t,DPS_BMi,t,DPS_KEi,t}, consists of three different indicators. DPS_UC denotes user-centricity that captures the extent to which (information about) public service is provided online, how the online journey is supported, and whether public websites are mobile-friendly. DPS_UC is calculated as the weighted average of indicators reflecting the level of online availability, usability, and mobile friendliness. DPS_BM is business mobility that captures the extent to which public services that are aimed at foreign businesses are available online, usable, and implemented with electronic identification (eID) and electronic document (eDocument) capabilities. This indicator is calculated as a weighted average of business mobility online, usability, eID cross-borders, and eDocuments cross-borders. DPS_KE is a key enabler that captures the extent to which technical pre-conditions for eGovernment service provision are used. The key enablers used for measuring the quality of the services to businesses and citizens include eID and eDocument, authentic sources, and digital posts. We take the data for DPS implementation from the eGovernment Benchmarking report and studies for digitalization conducted by Capgemini. The dataset is available from 2012 to 2019.
Control variablesRegarding other control variables, we use theories of international trade and empirical studies in the environment literature, such as Fu, Chen, Jang and Chang (2020), as well as in the trade literature, such as Agosin, Alvarez and Bravo-Ortega (2012), Cadot, Carrère and Strauss-Kahn (2011), Espoir (2020), Gnangnon (2019) and Parteka and Tamberi (2013), to select explanatory variables. The set of explanatory variables includes income level (INC) measured by real gross domestic product per capita at a constant 2010 price, as in Cadot et al. (2011), Parteka and Tamberi (2013), and many other studies. The other main macroeconomic indicators are savings (SAVE) as a share of GDP, inflation (INFLA) measured as the annual percentage change in GDP deflator,6 as in Ben Hammouda, Karingi, Njuguna and Sadni Jallab (2006). Also incorporated into the baseline model are population level (POPU), which is taken as the natural logarithm of the total population, and industrialization level (INDUS), which is the value added to GDP. These variables are available from the World Development Indicators (WDI). We follow Cabral and Veiga (2010) to consider the influence of political and institutional variables, including level of democratization (DEMO) from the democratization index taken from the World Bank Governance Indicator (WBGI).
To start a procedure of empirical estimation regression, we first merge data from different sources and clean the merged data to ensure there are no gaps in the panel data. The detailed descriptions of included variables; including definitions, measurements, data sources, and descriptive statistics, are shown in Table 1. The final sample consists of 208 observations covering 25 European countries, from 2012 to 2019. Detailed information on these countries is provided in Table A.1 in the Appendix. The correlation matrix between all variables is displayed in Table 2, which presents the correlation coefficients between the variables. The results show a positive correlation between lnTGG with DPS_UC and DPS_BM, but its association with DPS_KE is negative. Since our sample is characterized by a sample N and short T period, cross-sectional dependence (CD) tests are applied (Pesaran, 2021). The results of the CD test are displayed in Table 3, and show that most of the variables in the model have CD except for the DEMO variable. Hence, we apply the PCSE model to examine the association between TGG and DPS. According to Beck and Katz (1995), the PCSE method helps deal with issues arising from the simultaneous correlations between objects in a full N x N cross-sectional matrix. To address the possibility of multicollinearity with heteroskedasticity and endogeneity, we take the one-year lag of all the explanatory variables. As contended by Canh and Thanh (2020) and Schneider and Enste (2000), the simultaneity resulting from the possible feedback effect of TGG on other economic variables can be resolved in this way. For a robustness check, we also employ an FGLS model to minimize the variance of change, as recommended by Canh, Schinckus, Thanh and Hui Ling (2020) and Liao and Cao (2013). The two-step GMM is also applied to further deal with the endogeneity presented in Eq. (1), to ensure the accuracy of our findings, as Gala, Camargo, Magacho and Rocha (2018) and Sweet and Eterovic (2019). In addition, this study measures the short-term and long-term relationship between DPS and TGG. To serve this purpose, the ARDL method is employed. According to Pesaran and Smith (1995), this method helps to distinguish between long-run and short-run effects for exogenous and endogenous variables (Table 4). Furthermore, potential problems related to the existence of time- and country-specific fixed effects are also addressed through the dynamic fixed-effects estimator (DFE) employed in the ARDL model (Canh & Thanh, 2020). For further discussion, we examine the moderating effects of institutional quality in the relationship between DPS and TGG. Interaction between variables reflecting institutional quality and digitalization variables is incorporated in Eq. (1).
Description of variables.
Note: eGBR: eGovernment Benchmarking Report, WDI: World Development Indicator; FSSDA: Finnish Social Science Data Archive.
Correlation coefficients.
| LnTGG | DPS_UC | DPS_BM | DPS_KE | INC | SAVE | INFL | POPU | INDUS | DEMO | |
|---|---|---|---|---|---|---|---|---|---|---|
| lnTGG | 1 | |||||||||
| DPS_UC | 0.121 | 1 | ||||||||
| DPS_BM | 0.0854 | 0.562⁎⁎⁎ | 1 | |||||||
| DPS_KE | −0.0476 | 0.742⁎⁎⁎ | 0.408⁎⁎⁎ | 1 | ||||||
| INC | 0.209⁎⁎ | 0.463⁎⁎⁎ | 0.475⁎⁎⁎ | 0.196⁎⁎ | 1 | |||||
| SAVE | 0.217⁎⁎ | 0.219⁎⁎ | 0.133 | 0.0404 | 0.398⁎⁎⁎ | 1 | ||||
| INFLA | 0.113 | 0.149* | −0.352⁎⁎⁎ | 0.126 | −0.163* | 0.0635 | 1 | |||
| POPU | 0.838⁎⁎⁎ | −0.0382 | −0.129 | −0.245⁎⁎⁎ | 0.0376 | −0.0739 | 0.242⁎⁎⁎ | 1 | ||
| INDUS | 0.397⁎⁎⁎ | −0.143* | −0.323⁎⁎⁎ | −0.208⁎⁎ | −0.124 | 0.626⁎⁎⁎ | 0.213⁎⁎ | 0.202⁎⁎ | 1 | |
| DEMO | −0.227⁎⁎ | −0.367⁎⁎⁎ | −0.465⁎⁎⁎ | −0.150* | −0.798⁎⁎⁎ | −0.272⁎⁎⁎ | 0.327*** | 0.0110 | 0.0670 | 1 |
Cross-sectional dependence tests and stationary tests.
Note: Regarding the CD test, the null hypothesis is that the cross-section is independent. P-value is closed to zero, implying that data are correlated across panel groups. Regarding the Im-Pesaran-Shin test, the null hypothesis is “All panels contain unit root” and the alternative hypothesis is “Al least one panel is stationary”.
Cointegration test.
| Model: f(DPS and TGG) | Kao test | Pedroni test | Westerlund test |
|---|---|---|---|
| Dickey-Fuller test | Phillips-Perron t | Variance ratio | |
| DPS_UC | 2.00** | 2.32** | 2.09** |
| DPS_BM | 1.95** | 3.97*** | 2.26** |
| DPS_KE | 1.72** | 3.08*** | 3.76*** |
Note: Regarding the Kao test, the null hypothesis is “No cointegration”, while the alternative hypothesis is “All panels are cointegrated”. Regarding the Pedroni test, the null hypothesis is “No cointegration”, while the alternative hypothesis is “All panels are cointegrated”. Regarding the Westerlund test, the null hypothesis is “No cointegration”, while the alternative hypothesis is “Some panels are cointegrated”.
This paper examines the relationship between DPS and TGG. We report the estimation result of the baseline model in Table 5, obtained from the PCSE estimate, FGLS estimate, and two-step GMM estimate. In general, the results of all three estimation methods are not substantially different. All models show that the coefficients of the variables representing levels of DPS are positive and statistically significant. This result implies that the implementation of DPS plays a critical role in enhancing the export value of green goods. Among the three proxies of DPS, user-centricity has the most significant influence, and the results are consistent, as demonstrated by all three estimation methods. The estimation results emphasize the importance of DPS in promoting the TGG between countries. Our findings are in line with previous studies in the literature. Numerous papers highlight the influence of technology and digitalization on trade performance (Alcácer et al., 2016; Azar & Ciabuschi, 2017; Bettiol et al., 2020; Laplume et al., 2016) and trade diversification (Chiarvesio & Romanello, 2018; Rehnberg & Ponte, 2018; Strange & Zucchella, 2017). Other studies also reveal that digital technologies may help alleviate pressure on the natural environment and biodiversity, which are representative of ecosystem vitality (Liu et al., 2019). As shown by Feroz et al. (2021), digital transformation is vital for environmental sustainability, since digitalization leads to improved pollution control, waste management, sustainable production, and urban sustainability. Digitalization is a crucial driver of sustainable development (TWI2050 - The World in 2050, 2019). The influence of digital transformation on the environment and sustainability in the European region is also demonstrated by Liu et al. (2019).
The effects of digital public services on trades in green goods.
Standard errors in parentheses.
*** p<0.01, ** p<0.05, * p<0.1.
Based on the results in Table 5, we analyze the influence of control variables on the export values of green goods. The results reveal that real output growth (INC), inflation (INF), and level of democratization (DEMO) all have a negative impact, and most are statistically significant except for INC, which is statistically insignificant on TGG. In contrast, savings (SAVE), population (POPU), and level of industrialization (INDUS) are significantly positive. Notably, the coefficient of INDUS in the PCSE and FGLS estimates is significant compared to other variables. This suggests that INDUS plays a vital role in enhancing the export value of green goods. The positive effects of POPU and INDUS are consistent with Fu et al. (2020). In summary, the results generally support the argument that increases in savings, population, and level of industrialization contribute positively to the increase in TGG; while increases in real GDP per capita, inflation, or level of democratization decrease TGG. Similar findings regarding the effects of economic growth and international trade can be found in Lyu et al. (2021). The effects of industrial value-added, capital formation, urbanization, population growth, and biocapacity, can also be found in Yang and Khan (2021).
As discussed above, this paper also examines the impact of DPS on TGG in the short term and long term. The results are shown in Table 6, with some evidence of a significant relationship in the short term. Meanwhile, the coefficients of the DPS variables are positive and significant at a 1% significance level in the long term. It is worth noting that the coefficient of business mobility, in the long run, is significant compared to the other two variables, indicating that implementing activities to improve the business and operating environment plays a critical role in promoting TGG in the long term. By following a similar empirical estimation procedure, Ha (2022) also highlights the role of digital business and digital public services in securing various dimensions of the energy system in the long run.
The effects of digital public services on trades in green goods: Short-run and long-run influences.
Standard errors in parentheses.
*** p<0.01, ** p<0.05, * p<0.1.
Note: We employ the DFE-ARDL in all models.
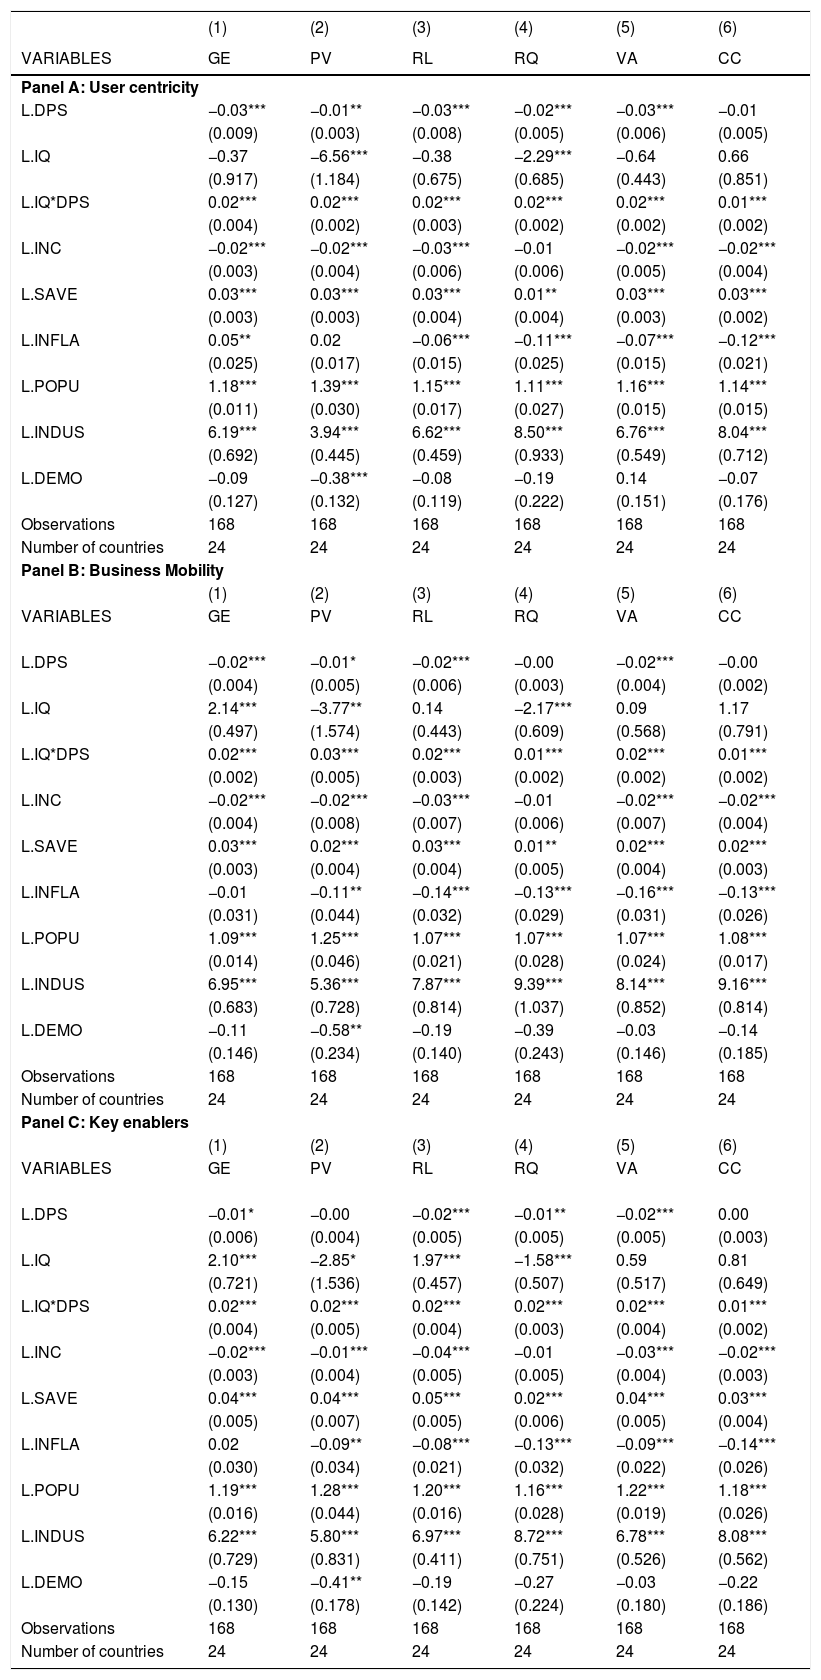
For further analysis, we examine the role of institutional quality in the relationship between DPS and TGG. In this section, we take six indicators of level of institutional quality from the International Country Risk Guide: voice and accountability (VA); political stability and absence of violence/terrorism (PV); government effectiveness (GE); regulatory quality (RQ); rule of law (RL); and control of corruption (CC). The results are shown in Table 7. Panel A, Panel B, and Panel C are, respectively, the results on user-centricity, business mobility, and key enablers. In general, the results show that the positive impact of digitalization on the value of TGG becomes more significant in an economy with a well-developed institutional system. These findings are statistically significant with positive interactions between user-centricity, business mobility, and key enablers and variables representing level of institutional quality. All interactions are statistically significant at the 1% level. In other words, the positive impact of DPS on TGG is more evident in a better institutional environment. In a similar spirit, Zakari and Khan (2021a) argue that institutional quality is the underlying factor for the positive influence of energy consumption on economic growth. Institutional quality is also essential in moderating the marginal effects of economic sanctions on environmental performance (Le et al., 2021) or the impact of economic complexity on energy security (Le et al., 2022).
Interactions of digital public services and institutional quality.
Standard errors in parentheses.
*** p<0.01, ** p<0.05, * p<0.1.
This article is an attempt to find answers to the question of whether DPS promote or hurt the export value of green goods. We used data from 25 European countries for the period 2012–2019, where DPS was captured by three indices (user-centricity, business mobility, and a key enabler) to provide empirical evidence supporting hypotheses about this relationship. The results show that the promotion and development of DPS positively impact TGG. In addition, the results also show a positive effect of DPS on TGG in the long term. Furthermore, the findings indicate that this positive effect is more apparent in a better institutional environment.
On the policy front, our findings suggest that European countries should take advantage, and grasp the benefits from accelerating the digital economy, strengthening the construction of the digital infrastructure and promoting digital transformation, especially in the public sector. Governments should identify and capitalize on the opportunity provided by digital technology to develop a more efficient policy framework, while also identifying and minimizing any adverse effects of digitization. In addition, countries can rely on this study to develop the right tools and strategies to improve the relationship between digital transformation and environmental performance in an uncertain global economy.
Some other policies that should be considered are how the government can use existing innovation and technologies most efficiently, change consumption patterns, and improve production processes. Moreover, the inter-linkages and tradeoffs between different thematic areas should be addressed; such as climate change, biodiversity, the environment, and health, with environmental policies and sectoral policies. Other recommendations for EU governments to get the most out of EU sustainability and digital development are as follows. First, policy should optimize management, and standardize the data that targets climate and the environment. Second, governments should relax barriers and stimulate the flows of information that are helpful to building a circular economy, which is a realistic way of tackling problems of waste and managing production to regenerate natural resources. Third, supporting and accelerating the green economy and society, by developing digital solutions to enhance pollution efforts and biodiversity, should be considered.
Ethics approval and consent to participateNot applicable.
Consent for publicationNot applicable.
Compliance with ethical standards- •
Disclosure of potential conflicts of interest
- •
Research involving Human Participants and/or Animals
- •
Informed consent
This paper was supported by National Economics University.