


As environmental concerns continue to gain greater importance, green process innovation has been recognized as a crucial strategy for firms to enhance their financial performance. Yet, it has not been clarified how companies can reduce risks and effectively use resources at different levels of green process innovation. Based on data from 221 Chinese manufacturing firms collected via the survey method, we address this research gap by examining the effects of different levels of green process innovation on firms’ financial performance by focusing on the moderating roles of green social capital and customers’ tacit green needs. We find that green process innovation has a U-shaped impact on firms’ financial performance, such that the impact is initially negative but then becomes more positive as the level of green process innovation increases. We also find this U-shaped relationship is moderated by green social capital and green needs’ tacitness, such that green social capital weakens the negative effect of green process innovation on firms’ financial performance, whereas green needs’ tacitness strengthens the negative effect of green process innovation on firms’ financial performance. Our findings contribute to the literature on green innovation by highlighting the nonlinear relationship between green process innovation and firms’ financial performance. This research also offers more fine-grained insight into the contingent mechanisms of green social capital and green needs’ tacitness, as well as how firms’ engagement with green process innovation can have profound effects on their financial performance. Our results provide important implications for managers regarding the financial benefits of green process innovation that is achieved by leveraging the roles of green social capital and green needs’ tacitness.
Environmental issues and resource limitations have become serious global challenges, and these challenges are as much a part of the business world as they are in other sectors of society (Pujari, Wright & KenPeattie, 2003). In fact, a growing number of scholars have been trying to find where the proper balance is between economic growth and environmental responsibility in firms’ strategic development (Cheng, Yang & Sheu, 2014; Przychodzen & Przychodzen, 2015). Here, green process innovation can be considered an environmentally oriented behavior for firms, as well as an effective strategy to promote sustainable competitive advantages (Ma, Hou & Xin, 2017; Rezende, Bansi, Alves & Galina, 2019).
Green process innovation is defined as “the application or exploitation of production processes that is novel to firms and which results in the reduction of environmental pollution compared to relevant alternatives” (Ma, Zhang, & Yin, 2019, p. 1). Green process innovation includes measures to minimize the waste from within the production process (Mendes, 2012; Severo, Guimarães & Dorion, 2017). It also concerns the end-of-pipe technology using pollution-control equipment to ensure compliance with environmental regulations (Mantovani, Tarola & Vergari, 2017; Xie, Huo, Qi & Zhu, 2016). Using such technology and processes, a significant amount of waste is reduced or recycled (Chen, Lai & Wen, 2006), and energy is utilized more efficiently (Wahid & Lee, 2011). Thus, companies often implement green process innovations to improve production efficiency, gain cost advantages, and help their organizations develop new market opportunities to promote their competitive advantage (Chiou, Chan, Lettice & Chung, 2011; Wahid & Lee, 2011). Overall, green process innovation is often considered a vital factor for firms and industries, as well as for business and innovation scholars.
Recent literature on the relationship between green process innovation and firms’ financial performance has mainly centered around two general viewpoints: One is the resource-based view (RBV), which argues that green process innovation should be regarded as a “sustainable competitive capability” for firms’ financial growth. According to this view, green process innovation can help firms lower operational costs, gain higher profit margins (Xie, Huo, & Zou, 2019), enjoy a “first-mover advantage” (Chen, 2008; Przychodzen, Hiz & Przychodzen, 2020), enhance corporate competitive advantages (Wahid & Lee, 2011), and improve their green image (Ma et al., 2017; Xie, Zhu, & Wang, 2019). The second view argues that the so-called “double externality problem” (Rennings, 2000)—meaning high costs and risks—has led to a lack of incentives for enterprises to carry out green process innovations. In this view, green process innovation requires high investment costs and can generate unnecessary expenses for firms (Kuo & Chen, 2016). Additionally, many potential risks, such as the existence of knowledge gaps, inadequate governmental support, and a lack of technical expertise, will always exist alongside green process innovations (Abdullah, Zailani, Iranmanesh & Jayaraman, 2016; Gong, Wu, Chen & Yan, 2020; Gupta & Barua, 2018). Taken together, these two viewpoints indicate that enterprises that adopt innovative green processes will face both financial opportunities and difficult challenges. For this reason, it is possible that the relationship between green process innovation and financial performance is not linearly or monotonically positive. We suggest that the two main viewpoints found in the literature may have overlooked the effect of different levels of green process innovation. Thus, we examine the impact of the different levels of green process innovation on firms’ financial performance to address this research gap.
Moreover, we propose that the inconsistent views in prior studies may have led researchers to overlook the possible boundary conditions that underlie the relationship between green process innovation and firms’ financial performance. Previous researchers have mainly focused on the various issues that might prevent firms from realizing the benefits of green process innovation (Abdullah et al., 2016; Gong et al., 2020; Roper & Tapinos, 2016). However, this research lacked comprehensive consideration of both the internal and external boundary conditions under which firms engaged in green process innovation to overcome these challenges and effectively produce higher financial performance. One such internal boundary condition is green social capital, and one external boundary condition is customers’ tacit green needs. On the one hand, given that green social capital is a component of green intellectual capital (Yadiati, Nissa, Suharman & Meiryani, 2019), which is deployed via the exchange of ideas and knowledge sharing among a firm's employees (Delgado-Verde, Amores-Salvadó, Martín-de Castro & Navas-López, 2014), firms with more green social capital might be able to foster higher levels of green process innovation while simultaneously increasing their profitability and growth (Agyapong, Agyapong & Poku, 2017; Delgado-Verde et al., 2014). Yet, exactly how firms can best leverage their green social capital to promote green process innovation, thereby improving their financial performance, remains unanswered. On the other hand, customers’ need tacitness, which refers to “the degree to which customer need information is difficult to codify or communicate across individuals or organizations” (Cui & Wu, 2016, p. 521), has become an important factor for firms attempting to innovate and invest in green process innovations. Thus, successfully understanding and translating customers’ tacit green needs could be considered an external boundary condition of firms under which green process innovation benefits financial performance. Therefore, this study examines the potential moderating effects of green social capital and green needs’ tacitness to identify both the internal and external boundary conditions by which firms’ financial performance can benefit from green process innovation.
Using data obtained from 221 Chinese manufacturing enterprises, in this paper, we examine the impact of different levels of green process innovation on firms’ financial performance and explore the moderating effects of green social capital and green needs’ tacitness on this relationship. Hence, this research makes significant contributions to the literature by enriching our understanding of how firms can promote their financial performance through green process innovation. Furthermore, we offer a better understanding of the boundary conditions regarding how green social capital and green needs’ tacitness moderate the relationship between green process innovation and firms’ financial performance. In addition, this work presents important implications for managers regarding how they can manage green social capital and green needs’ tacitness to help their firms undertake successful green innovation practices.
Hypotheses developmentGreen process innovation and financial performanceThe RBV has been used to examine the relationship between green process innovation and firm performance (e.g., Ma et al., 2017; Xie et al., 2019a). In light of the growing social demand for clean environmental conditions, and following the ideas expressed in RBV, we see that firms might be able to obtain unique resources by improving their social legitimacy (Hart, 1995). Moreover, firms need to perform environmental protection practices to follow environmental protection regulations (Khan & Chang, 2018). As a result, green process innovation has become a crucial aspect for firms to increase their competitive advantage (Küçükoğlu & Pınar, 2015; Li et al., 2017). Yet, true green process innovation requires firms to invest significant resources to modify their technology and business models (Calza, Parmentola & Tutore, 2017). Therefore, we suggest that green process innovation will influence firms’ financial performance, but that the degree of success will depend on their level of green process innovation.
We posit that increasing the level of green process innovation from a low to medium level incurs an initial profit decline and puts firms at a competitive disadvantage compared to innovative competitors that are not investing in green processes. First, when firms conduct green process innovations, they need to invest substantial resources, and this type of investment is usually quite expensive (del Río González, 2005; Ma et al., 2017; Xie et al., 2016). Additional expenses may be incurred in other areas as well, such as costs pertaining to training and safety (Gelb & Strawser, 2001), administration (Barnett & Salomon, 2006), labor (Gong et al., 2020), and research (López, Garcia & Rodriguez, 2007). Second, previous research has shown that innovative firms pursuing green goals also assume higher risks than is the case for rivals who do not engage in green innovation (e.g., Aguilera-Caracuel & Ortiz-de-Mandojana, 2013; Gupta & Barua, 2018; Roper & Tapinos, 2016). Because green technologies are novel and still in an early stage of development (Calza et al., 2017), uncertainties related to their durability and performance, as well as possible limitations on firms’ technical capacities, may increase innovation risks. Moreover, such firms often have a long payback period because any positive financial effect from their green process innovations requires time to materialize (Ma et al., 2017; Rezende et al., 2019). Third, when the levels of green process innovation are low, and environmental efficiency is still not truly clear, these firms also face a huge burden in terms of environmental protection costs (Guo, Xia, Zhang & Zhang, 2018; Wang & Jin, 2006), as many governments around the world have begun to impose stricter environmental laws and regulations (Feng & Chen, 2018). For instance, since December 2016, China has imposed several taxes on production units that emit air and water pollution, noise pollution, or solid waste (Khan & Chang, 2018). As a result, firms adopting low to medium levels of green process innovation might find a reduction in their profits and experience negative financial performance.
Nonetheless, we posit that the negative impact of green process innovation on firms’ financial performance will decrease over time, eventually leading to a positive effect after passing a certain threshold; we suggest that, after reaching this threshold, firms’ financial performance will continue to improve as the level of their green process innovation increases. First, prior research has shown that innovative green firms can offset regulatory costs (Porter & van der Linde, 1995), and they may even be able to generate additional profits (Feng & Chen, 2018). Second, higher levels of green process innovation can help firms save operating costs through energy savings and waste recycling (Chen et al., 2006; Saunila, Ukko & Rantala, 2018) because pollution is often caused by resource waste or energy loss (Darnall, 2009). Third, lower environmental compliance costs (Xie et al., 2016), higher governmental support (Xie et al., 2019b), and the improved green image of firms (Chen, 2008; Ma et al., 2017; Xie et al., 2019a) are crucial long-term benefits derived from achieving high levels of green process innovation. From the financial view, market investors are likely to place a higher premium on firms that exhibit a positive public image (Konar & Cohen, 2001), and such firms may also be able to attract large numbers of new customers who are willing to pay more for environmentally friendly green products (Tsai, Chuang, Chao & Chang, 2012). As a result, as the level of green process innovation passes a certain point, the negative effects in terms of financial performance diminish, and the positive effects grow.
In sum, the relationship between green process innovation and firms’ financial performance has an “inflection point,” whereby green process innovation will first have a negative financial effect, followed by a positive financial effect, which grows as green process innovation levels increase. Thus, we propose the following hypothesis:
H1 Green process innovation has a U-shaped impact on firms’ financial performance, such that the impact is initially negative, but it becomes more positive as the level of green process innovation increases.
Green social capital is one of the components of the green intellectual capital concept; it includes informal contacts, constructive discussions, knowledge sharing among employees, and mutual collaboration on environmental projects (Delgado-Verde et al., 2014). The more the communication routines among employees are encouraged, the easier knowledge capability is created by facilitating knowledge transfer (Akgün, Keskin, Byrne & Aren, 2007). Furthermore, knowledge utilization and sharing, which enhance a firm's ability to sustain its competitive advantage (Zahra & George, 2002), are crucial for achieving superior innovation (Frankort, 2016). In this sense, green social capital can be seen as an important internal factor that can help firms achieve better financial performance as they pursue green process innovation.
We posit that green social capital reduces the negative impact of green process innovation on firms’ financial performance. First, firms with well-developed green social capital can improve their ability to exchange internal information and share new ideas to promote green innovation (Chen, Wang, Chen, Lo & Chen, 2019; Delgado-Verde et al., 2014). At the same time, green social capital also helps workers learn to share a common vision of the business (Agyapong et al., 2017), including the firm's environmental commitment, which is a crucial factor in the success of firms’ environmental practices (Fernández, Junquera & Ortiz, 2003). Furthermore, according to Abdullah et al. (2016)), attitude and perception barriers, such as employees’ and managers’ resistance to change, have been determined to negatively affect green innovation. Thus, higher green social capital, with its greater speed of knowledge flow and better utilization of close and fluid employee relationships (Delgado-Verde et al., 2014), can help firms overcome this attitude and perception barrier, allowing them to reach their innovative green goals. Second, knowledge sharing, as a key element of green social capital, can help organizational employees collaborate to facilitate and develop new, mutually beneficial ideas (Harjanti & Noerchoidah, 2017), complete organizational tasks more effectively (Florin, Lubatkin & Schulze, 2003), and enhance their firms’ innovative abilities (Collins & Smith, 2006). Meanwhile, green innovation knowledge tends to be tacit and new to many firms (Galbreath, 2019), and a lack of technical knowledge in this domain can lead to difficulties when firms attempt to adopt innovative green practices (Abdullah, Zailani, Iranmanesh and Jayaraman, 2016). Thus, firms with high green social capital are more likely to promote green knowledge sharing, leading to more green process innovations, which, in turn, enhance firms’ financial performance. Third, high green social capital can also help such firms lower the costs associated with collaboration, as well as excessive managerial costs (Delgado-Verde et al., 2014; Pretty & Smith, 2004) because this can facilitate trust, honesty, and integrity among employees (Ozigi, 2018).
As a result, firms that have high green social capital can weaken the negative effect of green process innovation on their financial performance and help them cross the threshold described above—the minimum point of financial performance—earlier than those with low green social capital. Therefore, we propose the following hypothesis:
H2 Green social capital moderates the U-shaped relationship between green process innovation and firms’ financial performance, such that green social capital weakens the negative effect of green process innovation on firms’ financial performance.
As awareness of environmental threats among customers continues to increase, green process innovation is not only a matter of corporate governance but also important to customers’ green needs (Yang & Roh, 2019). However, identifying such customer needs is not an easy task because they are often tacit and unarticulated (Zhang, Wu & Cui, 2015). The tacitness of customers’ needs refers to the difficulty of expressing, documenting, or codifying customer needs in a written format (Nonaka, 1994); such difficulties lead to customer needs that are difficult to comprehend and incorporate. In the current business environment, most organizations attempt to satisfy and exceed customer expectations (Maletic, Maletic & Gomiscek, 2010); thus, understanding and satisfying customer needs are critical components for green innovation success. Therefore, we consider customers’ tacit green needs as a moderator that can influence the relationship between green process innovation and firms’ financial performance.
More specifically, we posit that high green needs’ tacitness increases the negative impact of green process innovation on firms’ financial performance. First, as mentioned above, when customers’ green needs are tacit, those needs are generally difficult to convey or document (Nonaka, 1994). Therefore, there are inherent difficulties in transferring information about customers’ green needs to firms; in turn, firms encounter impediments in accurately prioritizing their customers’ needs. Ultimately, this situation decreases green innovation performance. Second, when customers’ needs are highly tacit, firms must undertake complex procedures to convert that tacit knowledge into explicit information that they can use (Nonaka, 1994). This conversion process imposes greater costs on firms and can take significant time and effort. Third, firms may face high levels of risk and uncertainty from using such tacit information (Zhang et al., 2015) because, when firms can discover and understand their customers’ tacit green needs, the tacit customer knowledge is often new and unpredictable, and it may be beyond the firms’ knowledge domain Zhang et al. (2015). Specifically, customers with high needs’ tacitness are likely to prefer customized products over standardized designs (Zhang et al., 2015). This may lead to a significant decline in the financial performance of green process innovations because many firms will not be able to satisfy their customers’ green needs, leading customers to reject firms’ new green products (e.g., Link & Naveh, 2006).
Taken together, we argue that a high level of green needs’ tacitness amplifies the negative impact of green process innovation on firms’ financial performance, and that it leads innovative green firms to cross the threshold—the minimum point of financial performance—later than those with a low level of green needs’ tacitness. Hence, we propose the following hypothesis:
H3 Customers’ tacit green needs moderate the U-shaped relationship between green process innovation and firms’ financial performance, such that green needs’ tacitness strengthens the negative effect of green process innovation on firms’ financial performance.
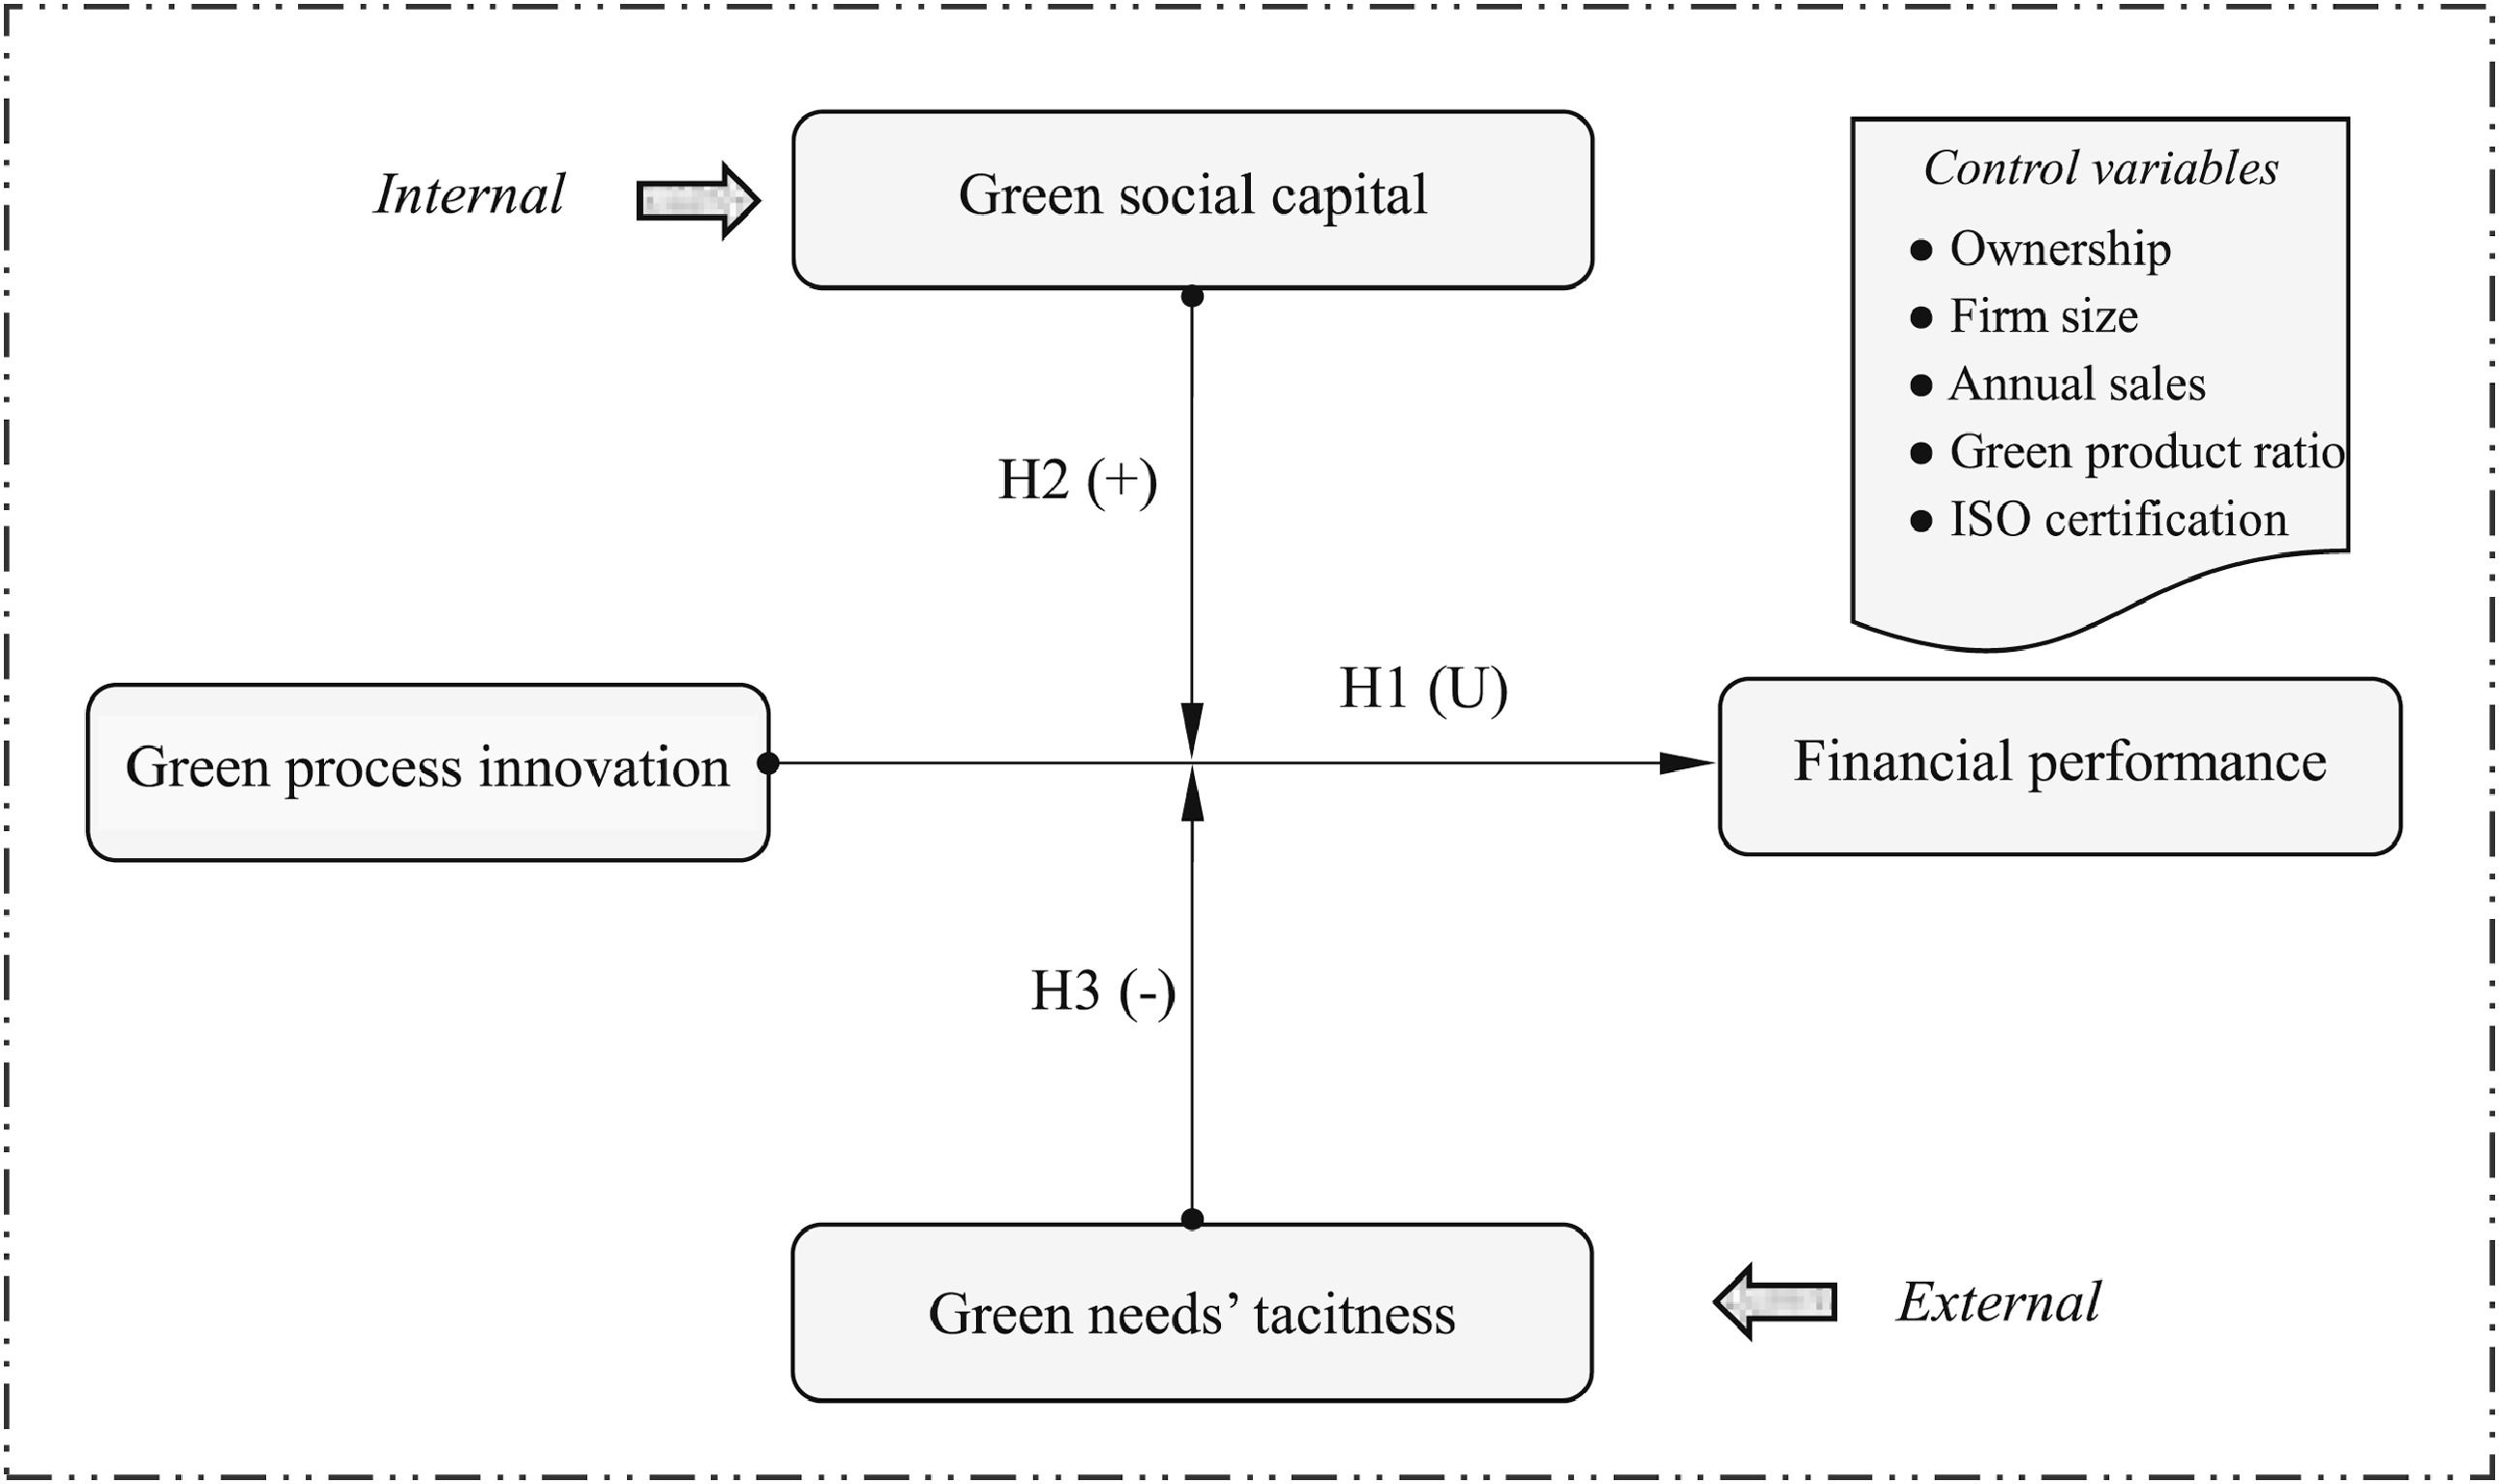
The theoretical hypothesis model described by the points above is illustrated in Fig. 1.
MethodsData source
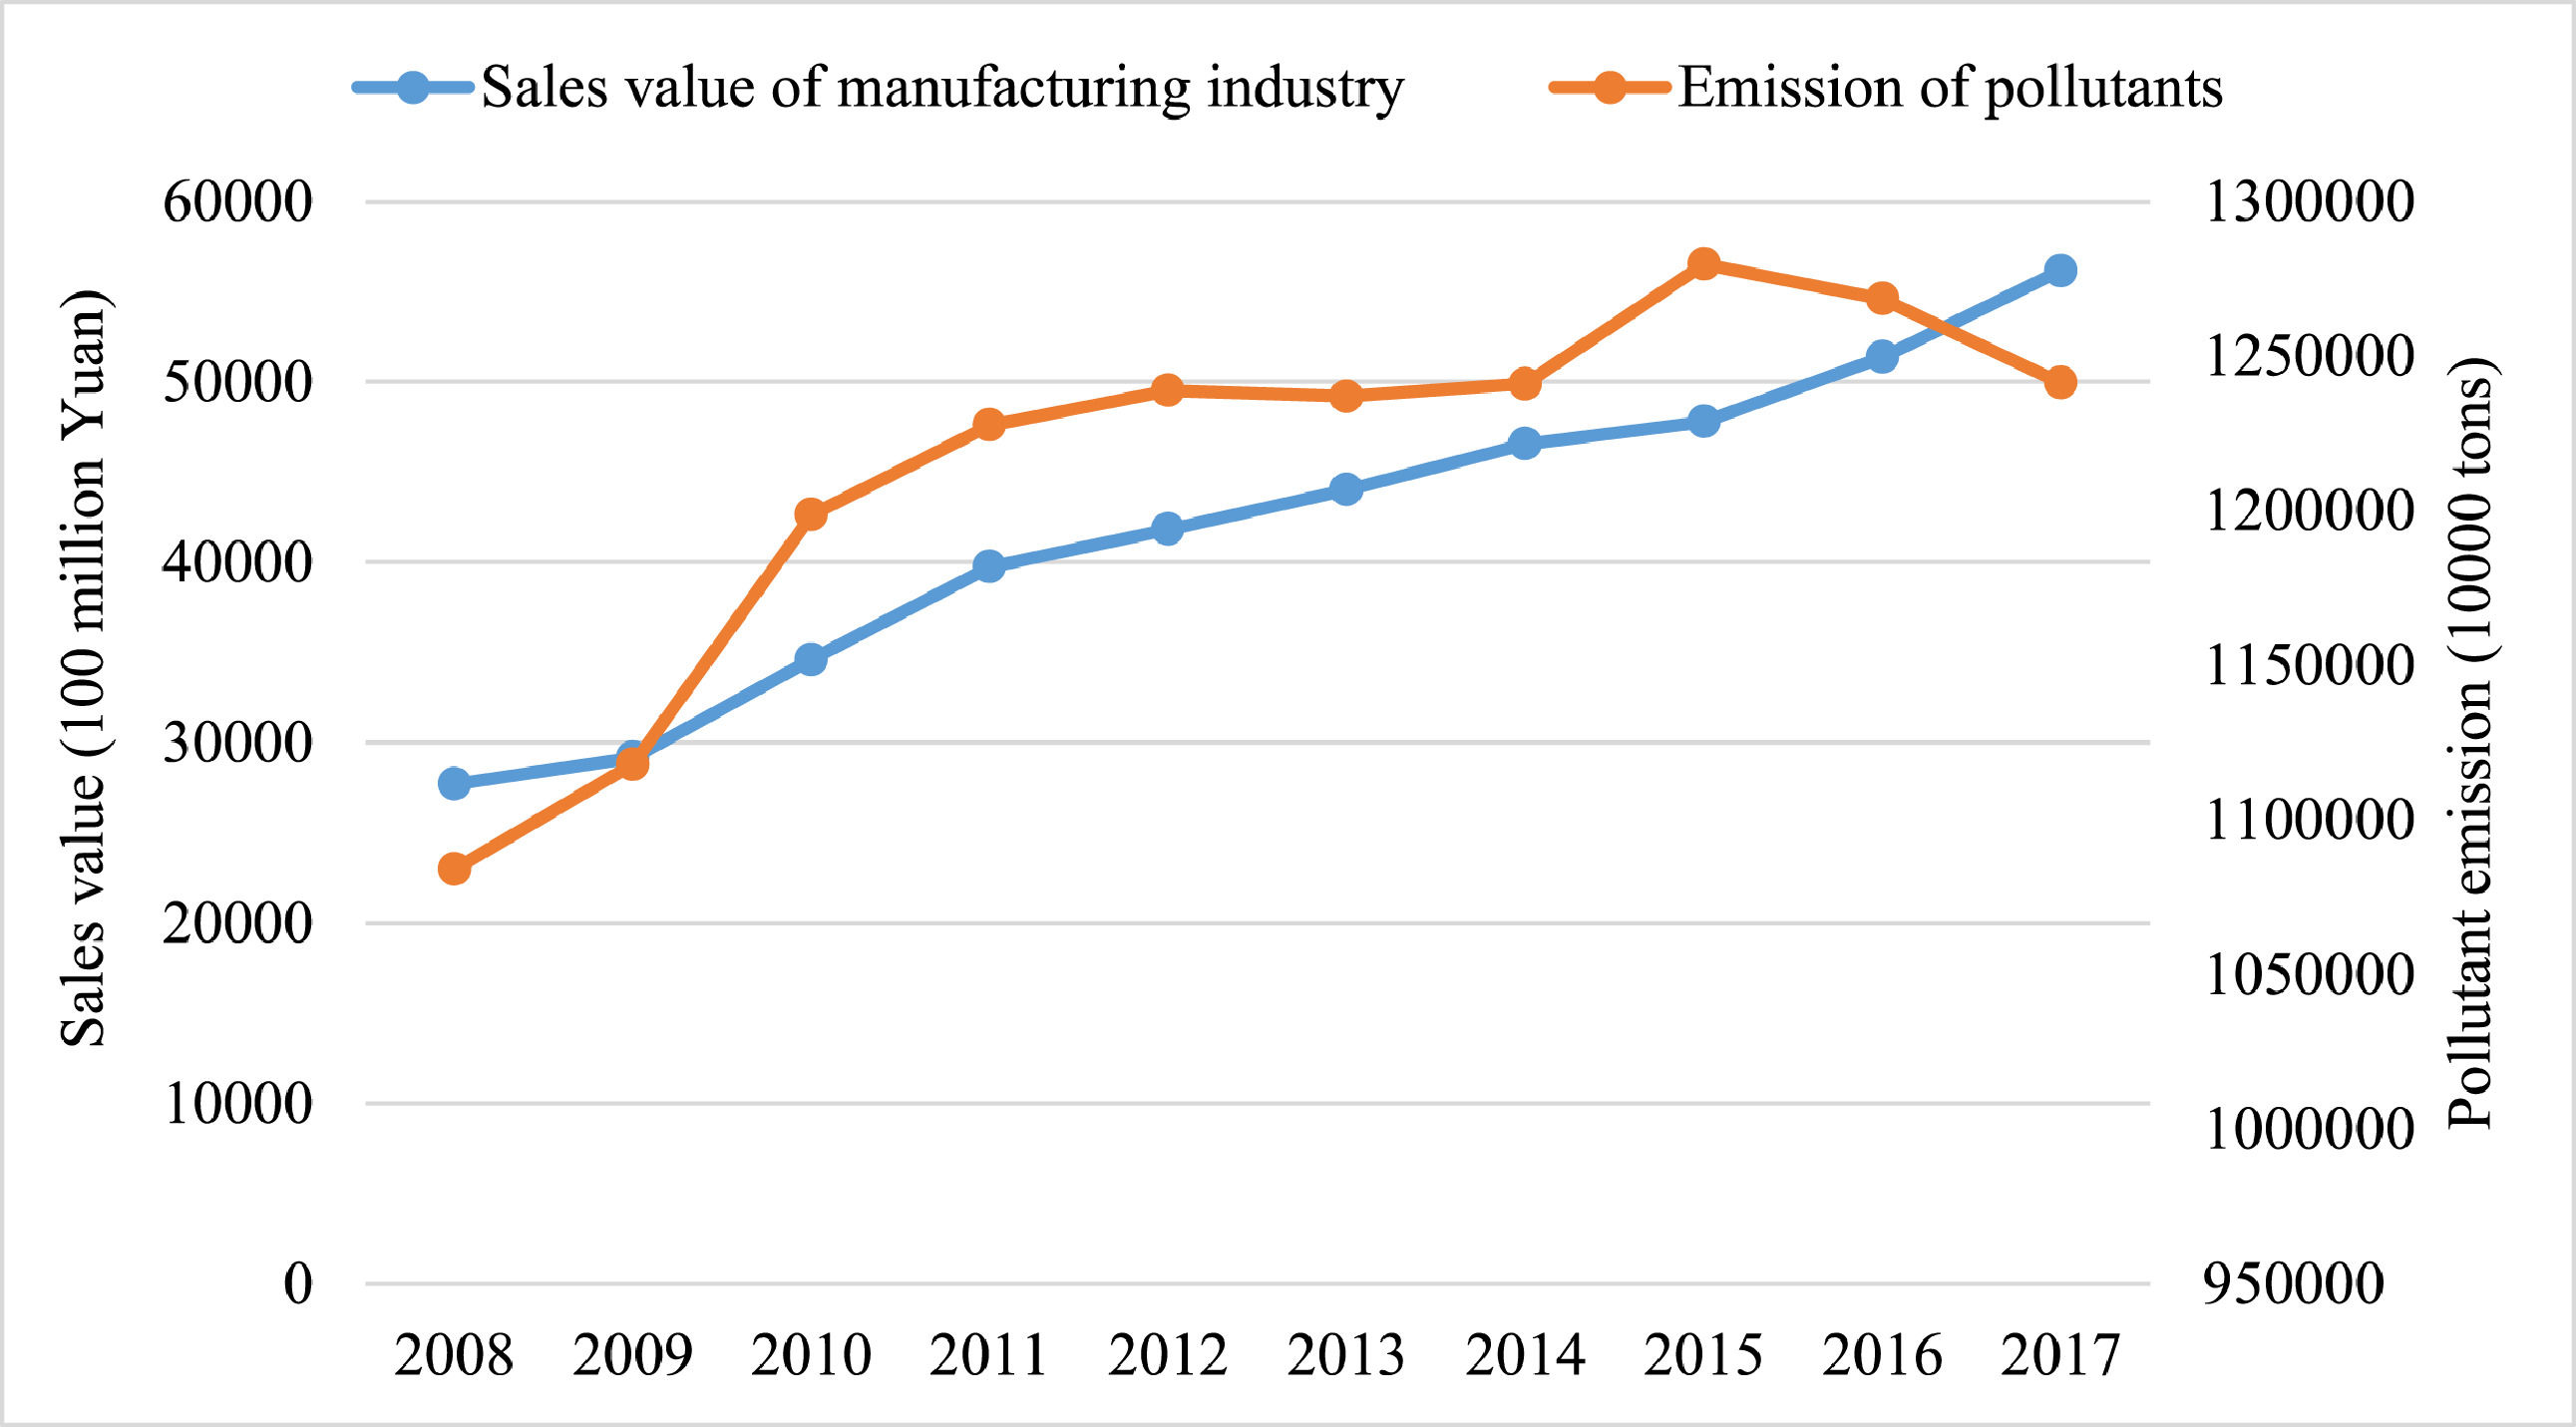
The data used in this study were obtained from manufacturing enterprises located in China's Yangtze Delta Region. There were several reasons why we chose manufacturing firms in this region as our study setting. First, firms under intense pressure to upgrade have often had strong motivations to undertake environmental innovation to survive and grow (Xie et al., 2016), and this is the situation with many companies in the Yangtze Delta Region. Second, this region has long been one of the key areas of manufacturing in China, but rapid industrial production has produced severe ecological problems, such as resource exhaustion and environmental pollution (Molina-Azorin, Claver-Cortés & Tarí, 2009; Xu, Wu & Zhang, 2020). Indeed, as shown in Fig. 2, the output and pollutant emissions from manufacturing firms in the Yangtze Delta Region increased rapidly between 2008 and 2017. Third, during the previous 20 years (i.e., since the Asian financial crisis), the Chinese government has been placing much greater importance on manufacturing industries (Yadiati, Tian, Liu, Chen, & Descamps-Large, 2016), and, because of this change, the public has become increasingly concerned about the environmental pollution caused by manufacturing industries in the Yangtze Delta Region.
.")
Given that green innovation may help companies rid themselves of the environmental dilemma, as well as improve their financial performance (Cheng et al., 2014; Xie et al., 2016), this subject has attracted increased attention from academic, political, and, especially, commercial circles (Jung & Kwak, 2018). However, green innovation was only the necessary prerequisite for the enterprises’ sustainable development. In this vein, we believe a threshold likely exists for green innovation, especially in terms of innovations for green processes, resulting in additional R&D costs and the application of such innovations (Guo et al., 2018). Thus, it is clear that green process innovation still has a long and tough way to go in China.
We adopted the survey method in this study to collect data and provide an overview of the existing green process innovation and their effectiveness in the Yangtze Delta Region. Because the original instrument was in English, all items in our study were first translated into Chinese and then translated back into English to ensure validity. We also conducted a pretest using 30 firms, and, from the pretest results, we improved the questionnaire to make it more robust. Following the pretest, we distributed 500 questionnaires to managers and technical supervisors of manufacturing firms in this region via both field surveys and email. For key manufacturing firms in the Yangtze Delta Region, we developed a standardized method to conduct field interviews: during the initial interviews, notes were taken, and then follow-up interviews were conducted to clarify specific issues and to explore some answers more fully. After excluding incomplete questionnaires and questionnaires with outliers, we were left with 221 valid questionnaires, and thus we had a response rate of 44.2%.
The data collected via the sampling survey method raised concerns about common method bias (CMB). Thus, we adopted both procedural and statistical methods to reduce the concerns about CMB. Regarding the procedural methods, first, we used multiple items to measure the constructs, and, second, we assured the respondents that the questionnaire was anonymous. In terms of the statistical techniques, we applied Harman's single-factor test. The results from this test showed that the first factor accounted for 33.25% of the total variance, revealing that CMB was not a critical concern.
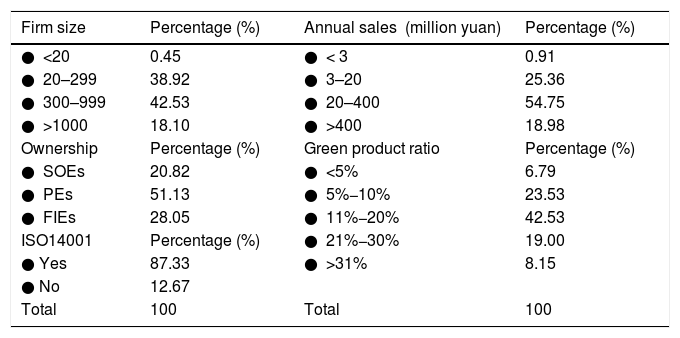
Table 1 reports the sample characteristics containing firm size, firm sales, ownership, green ratio, and International Organization for Standardization (ISO) certification. In terms of firm size, 81.9% of the firms had fewer than 1000 employees. Regarding firm sales, 81.02% of all the firms had average annual sales of less than 400 million yuan in the prior three years. In terms of ownership, 20.82% of the firms were state-owned enterprises (SOEs), 51.13% were private enterprises (PEs), and 28.05% were foreign-invested enterprises (FIEs). As for the green product ratio, 72.85% of the firms had green sales of less than 20% of total sales in the previous three years. Finally, pertaining to ISO 14,001, 61.91% of the firms had ISO certification.
Sample characteristics.
Note: Firm size= Number of employees; Average sales=Average sales of an enterprise in the past three years; Green ratio= Sales of green product/total sales of product.
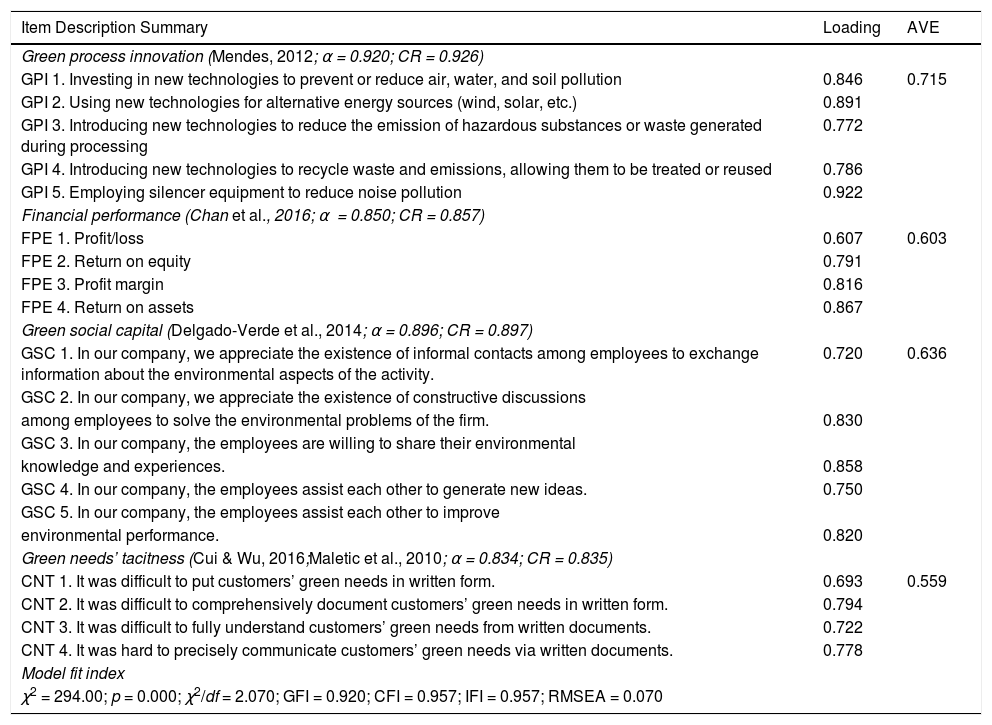
We adapted the main items in this study from previous research, including studies on green process innovation (Mendes, 2012), financial performance (Chan, Yee, Dai & Lim, 2016), green social capital (Delgado-Verde et al., 2014), and customers’ tacit green needs (Cui & Wu, 2016); however, where appropriate, we modified items from the previous research to enhance our understanding of the specific Chinese context. The respondents were requested to assess the degree to which they agreed with various statements regarding their companies’ green innovation strategies and practices in the past three years (see Table 2). We assessed the items for the constructs by each respondent using a 5-point Likert scale, ranging from 1 = ‘strongly disagree’ to 5 = ‘strongly agree’.
Construct measurement and confirmatory factor analysis.
| Item Description Summary | Loading | AVE |
|---|---|---|
| Green process innovation (Mendes, 2012; α = 0.920; CR = 0.926) | ||
| GPI 1. Investing in new technologies to prevent or reduce air, water, and soil pollution | 0.846 | 0.715 |
| GPI 2. Using new technologies for alternative energy sources (wind, solar, etc.) | 0.891 | |
| GPI 3. Introducing new technologies to reduce the emission of hazardous substances or waste generated during processing | 0.772 | |
| GPI 4. Introducing new technologies to recycle waste and emissions, allowing them to be treated or reused | 0.786 | |
| GPI 5. Employing silencer equipment to reduce noise pollution | 0.922 | |
| Financial performance (Chan et al., 2016; α = 0.850; CR = 0.857) | ||
| FPE 1. Profit/loss | 0.607 | 0.603 |
| FPE 2. Return on equity | 0.791 | |
| FPE 3. Profit margin | 0.816 | |
| FPE 4. Return on assets | 0.867 | |
| Green social capital (Delgado-Verde et al., 2014; α = 0.896; CR = 0.897) | ||
| GSC 1. In our company, we appreciate the existence of informal contacts among employees to exchange information about the environmental aspects of the activity. | 0.720 | 0.636 |
| GSC 2. In our company, we appreciate the existence of constructive discussions | ||
| among employees to solve the environmental problems of the firm. | 0.830 | |
| GSC 3. In our company, the employees are willing to share their environmental | ||
| knowledge and experiences. | 0.858 | |
| GSC 4. In our company, the employees assist each other to generate new ideas. | 0.750 | |
| GSC 5. In our company, the employees assist each other to improve | ||
| environmental performance. | 0.820 | |
| Green needs’ tacitness (Cui & Wu, 2016;Maletic et al., 2010; α = 0.834; CR = 0.835) | ||
| CNT 1. It was difficult to put customers’ green needs in written form. | 0.693 | 0.559 |
| CNT 2. It was difficult to comprehensively document customers’ green needs in written form. | 0.794 | |
| CNT 3. It was difficult to fully understand customers’ green needs from written documents. | 0.722 | |
| CNT 4. It was hard to precisely communicate customers’ green needs via written documents. | 0.778 | |
| Model fit index | ||
| χ2 = 294.00; p = 0.000; χ2/df = 2.070; GFI = 0.920; CFI = 0.957; IFI = 0.957; RMSEA = 0.070 |
Green process innovation. Adapted from Mendes (2012) and Chen et al. (2006)), we evaluated green process innovation in this study using five items (see Table 2): (a) investing in new technologies to prevent or reduce air, water, and soil pollution; (b) using new technologies for alternative energy sources; (c) introducing new technologies to reduce the emission of hazardous substances or waste generated during processing; (d) introducing new technologies to recycle waste and emissions, allowing them to be treated or reused; and (e) employing silencer equipment to reduce noise pollution. The Cronbach's alpha value of this scale was 0.920.
Financial performance. We measured financial performance using a four-item scale originally developed by Chan et al. (2016)). It included an evaluation of (a) profit/loss, (b) return on equity, (c) profit margin, and (d) return on assets.
Green social capital. As mentioned earlier, green social capital mainly relates to informal intra-organizational exchanges and experience sharing among employees and concerns environmental commitment and collaboration (Delgado-Verde et al., 2014). Adapting the work of Delgado-Verde et al. (2014)), we measured green social capital using five items: (a) appreciating the existence of informal contacts among employees to exchange information about the environmental aspects of the activity, (b) appreciating the existence of constructive discussions among employees to solve the environmental problems of the firm, (c) showing willingness on the part of employees to share their environmental knowledge and experiences, (d) embracing the idea of employees assisting each other to generate new ideas, and (e) supporting employees who assist one another to improve performance.
Customers’ tacit green needs. Adapted from Cui and Wu (2016) and Maletic et al. (2010)), we measured customers’ tacit green needs via four items: (a) it was difficult to put customers’ green needs in written form, (b) it was difficult to comprehensively document customers’ green needs in written form, (c) it was difficult to fully understand customers’ green needs from written documents, and (d) it was hard to precisely communicate customers’ green needs via written documents.
Controls. Given that prior research has indicated that particular characteristics of enterprises have highly influenced firms’ financial performance (Sheng & Chien, 2016; Subramaniam & Youndt, 2005), we used ownership type, firm size, firm sales, green product ratio, and ISO certification as our control variables. We assessed ownership via three types: (a) SOEs, (b) PEs, and (c) FIEs, and we measured firm size by the number of employees using a 4-item scale, from 1 = 〈 20 to 4 = 〉 1000. We also measured annual sales with a 4-item scale: 1 = 〈 3 million yuan to 4 = 〉 400 million yuan. We measured the green product ratio on a 5-item scale, from 1 = 〈 5% to 5 = 〉 31%. Lastly, we used the ISO14001 as a dummy control variable, whereby 1 meant that the respondent answered ‘yes’, but 0 otherwise.
Reliability and validityTable 2 displays the results of the reliability and validity analysis for each variable. First, we can see that each latent variable factor loading was significant at the 0.001 level, and that the average standardized loading was mostly greater than 0.7, revealing that the factor structure was consistent with the theoretical expectations—and that the internal structural validity was acceptable. Second, we found that both the Cronbach's alpha value and the construct reliability (CR) were greater than 0.7, indicating that the scale reliability was acceptable. Third, the average variance extracted (AVE) values of all the variables were greater than the threshold value of 0.50, indicating that the convergence validity of each latent variable was within an acceptable range. Additionally, Table 2 also shows the full model fit index constructed by the confirmatory factor analysis (CFA). This indicated that the model fit the data well (χ2 = 294.00, p = 0.000, χ2/df = 2.070, GFI = 0.920, CFI = 0.957, IFI = 0.957, RMSEA = 0.070).
Model specificationTo test the main effect and the moderating effects, we constructed the models shown in Eq. (1) and Eq. (2), respectively. The first model examined the impact of green process innovation and green process innovation squared on a firm's financial performance. The second model examined how green social capital and customers’ tacit green needs moderated the curvilinear relationship between green process innovation and a firm's financial performance.


In these equations, FPEi, is the financial performance of firm i; GPIi denotes the green process innovation of firm i; GPIi2 represents the squared term of green process innovation of firm i; GSCi is the green social capital of firm i; CNTi signifies customers’ tacit green needs; and both GPIi * GSCi and GPIi2 * CNTi are interaction terms. Further, Controls, stands for the control variables, including ownership type, firm size, annual sales, green product ratio, and ISO certification, whereas εi is a normal error term.
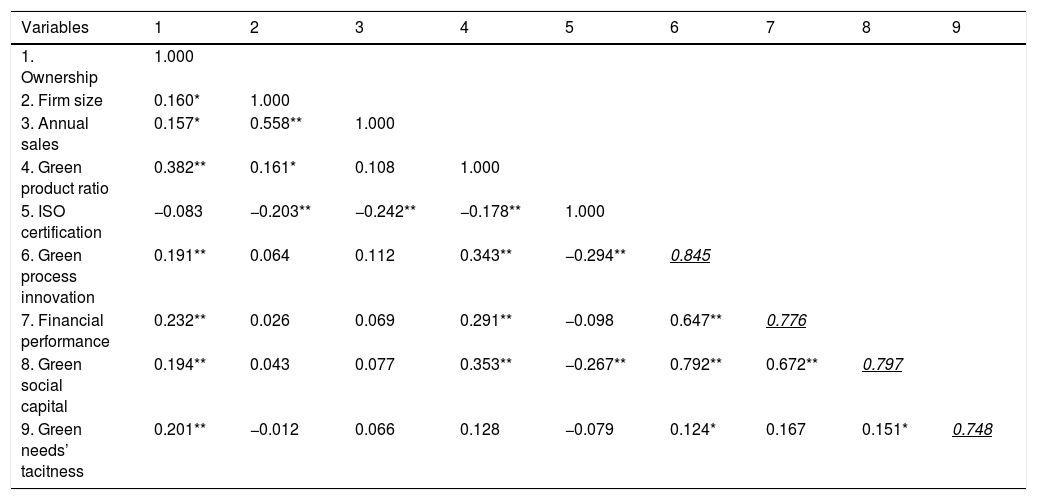
ResultsWe report the correlation coefficients in Table 3. This table reveals that both green process innovation and green social capital were significantly correlated with the firms’ financial performance.
Correlations.
Note: *p < 0.05, **p < 0.01. The root value of AVE is on the diagonal.
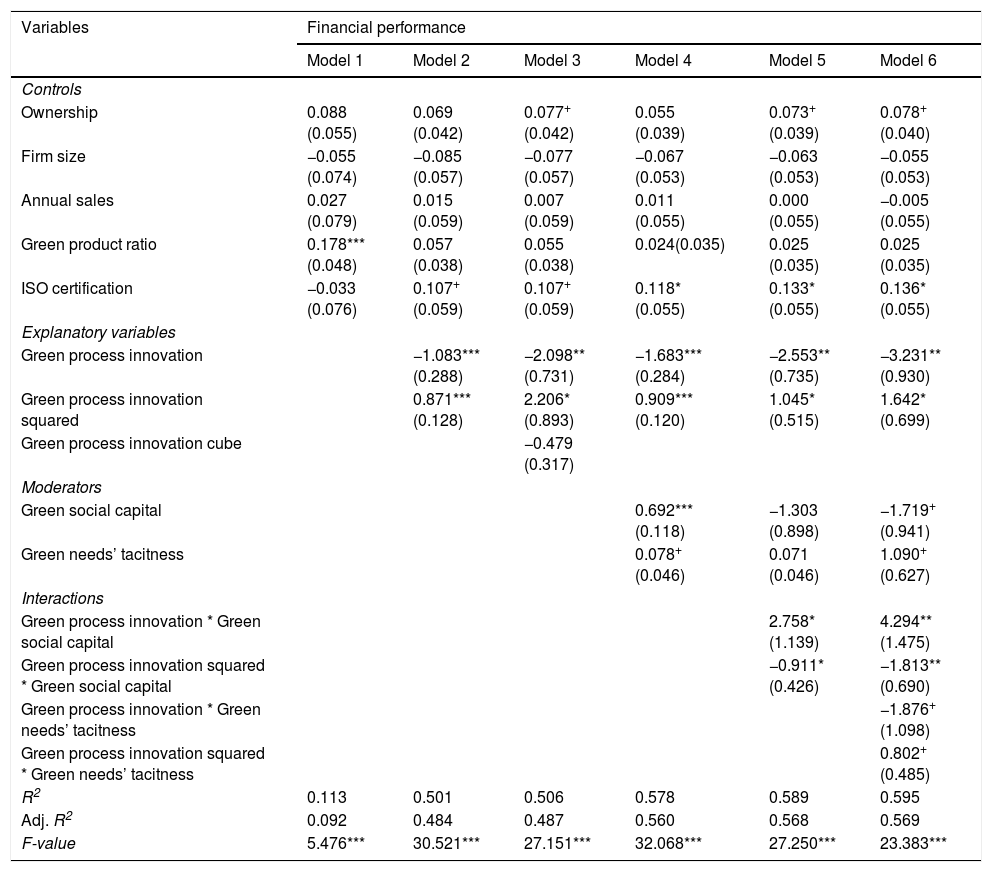
Table 4 presents the regression results of this study. As was shown in Model 2, we found the effect of green process innovation on firm's financial performance to be negative and significant (β = −1.083, p < 0.001) and the impact of green process innovation squared on the firm's financial performance to be positive and significant (β = 0.871, p < 0.001). These results robustly confirm the U-shaped relationship between green process innovation and firms’ financial performance—namely, that firms’ financial performance drops during initial green process innovation at a decreasing rate to arrive at a minimum, after which time firm financial performance rises at an increasing rate to recover. Therefore, H1 is supported.
Regression results.
Note:+p < 0.1; *p < 0.05; **p < 0.01; ***p < 0.001. Standard errors in parentheses.
To reduce the potential multicollinearity of the models, both the explanatory variable and the moderators in this research were mean-centered. The results from Model 5 demonstrate that the interaction between the linear term of green process innovation and green social capital was significantly positive (β = 2.758, p < 0.05), and the interaction between green process innovation squared and green social capital was negative and significant (β = −0.911, p < 0.05). These findings support H2. According to previous studies (e.g., Haans, Pieters & He, 2016; Li, Zhou & Zajac, 2009; (Ang, 2008)), a flattening occurs for U-shaped relationships when the results show a positive sign for the interactions between the moderator and the independent factor, and the negative sign for its square. Thus, higher green social capital makes the negative effect of green process innovation on firms’ financial performance less significant. In addition, we found no significant difference in the full model (i.e., Model 6), with the results from Models 2 and 5 demonstrating our results were robust.
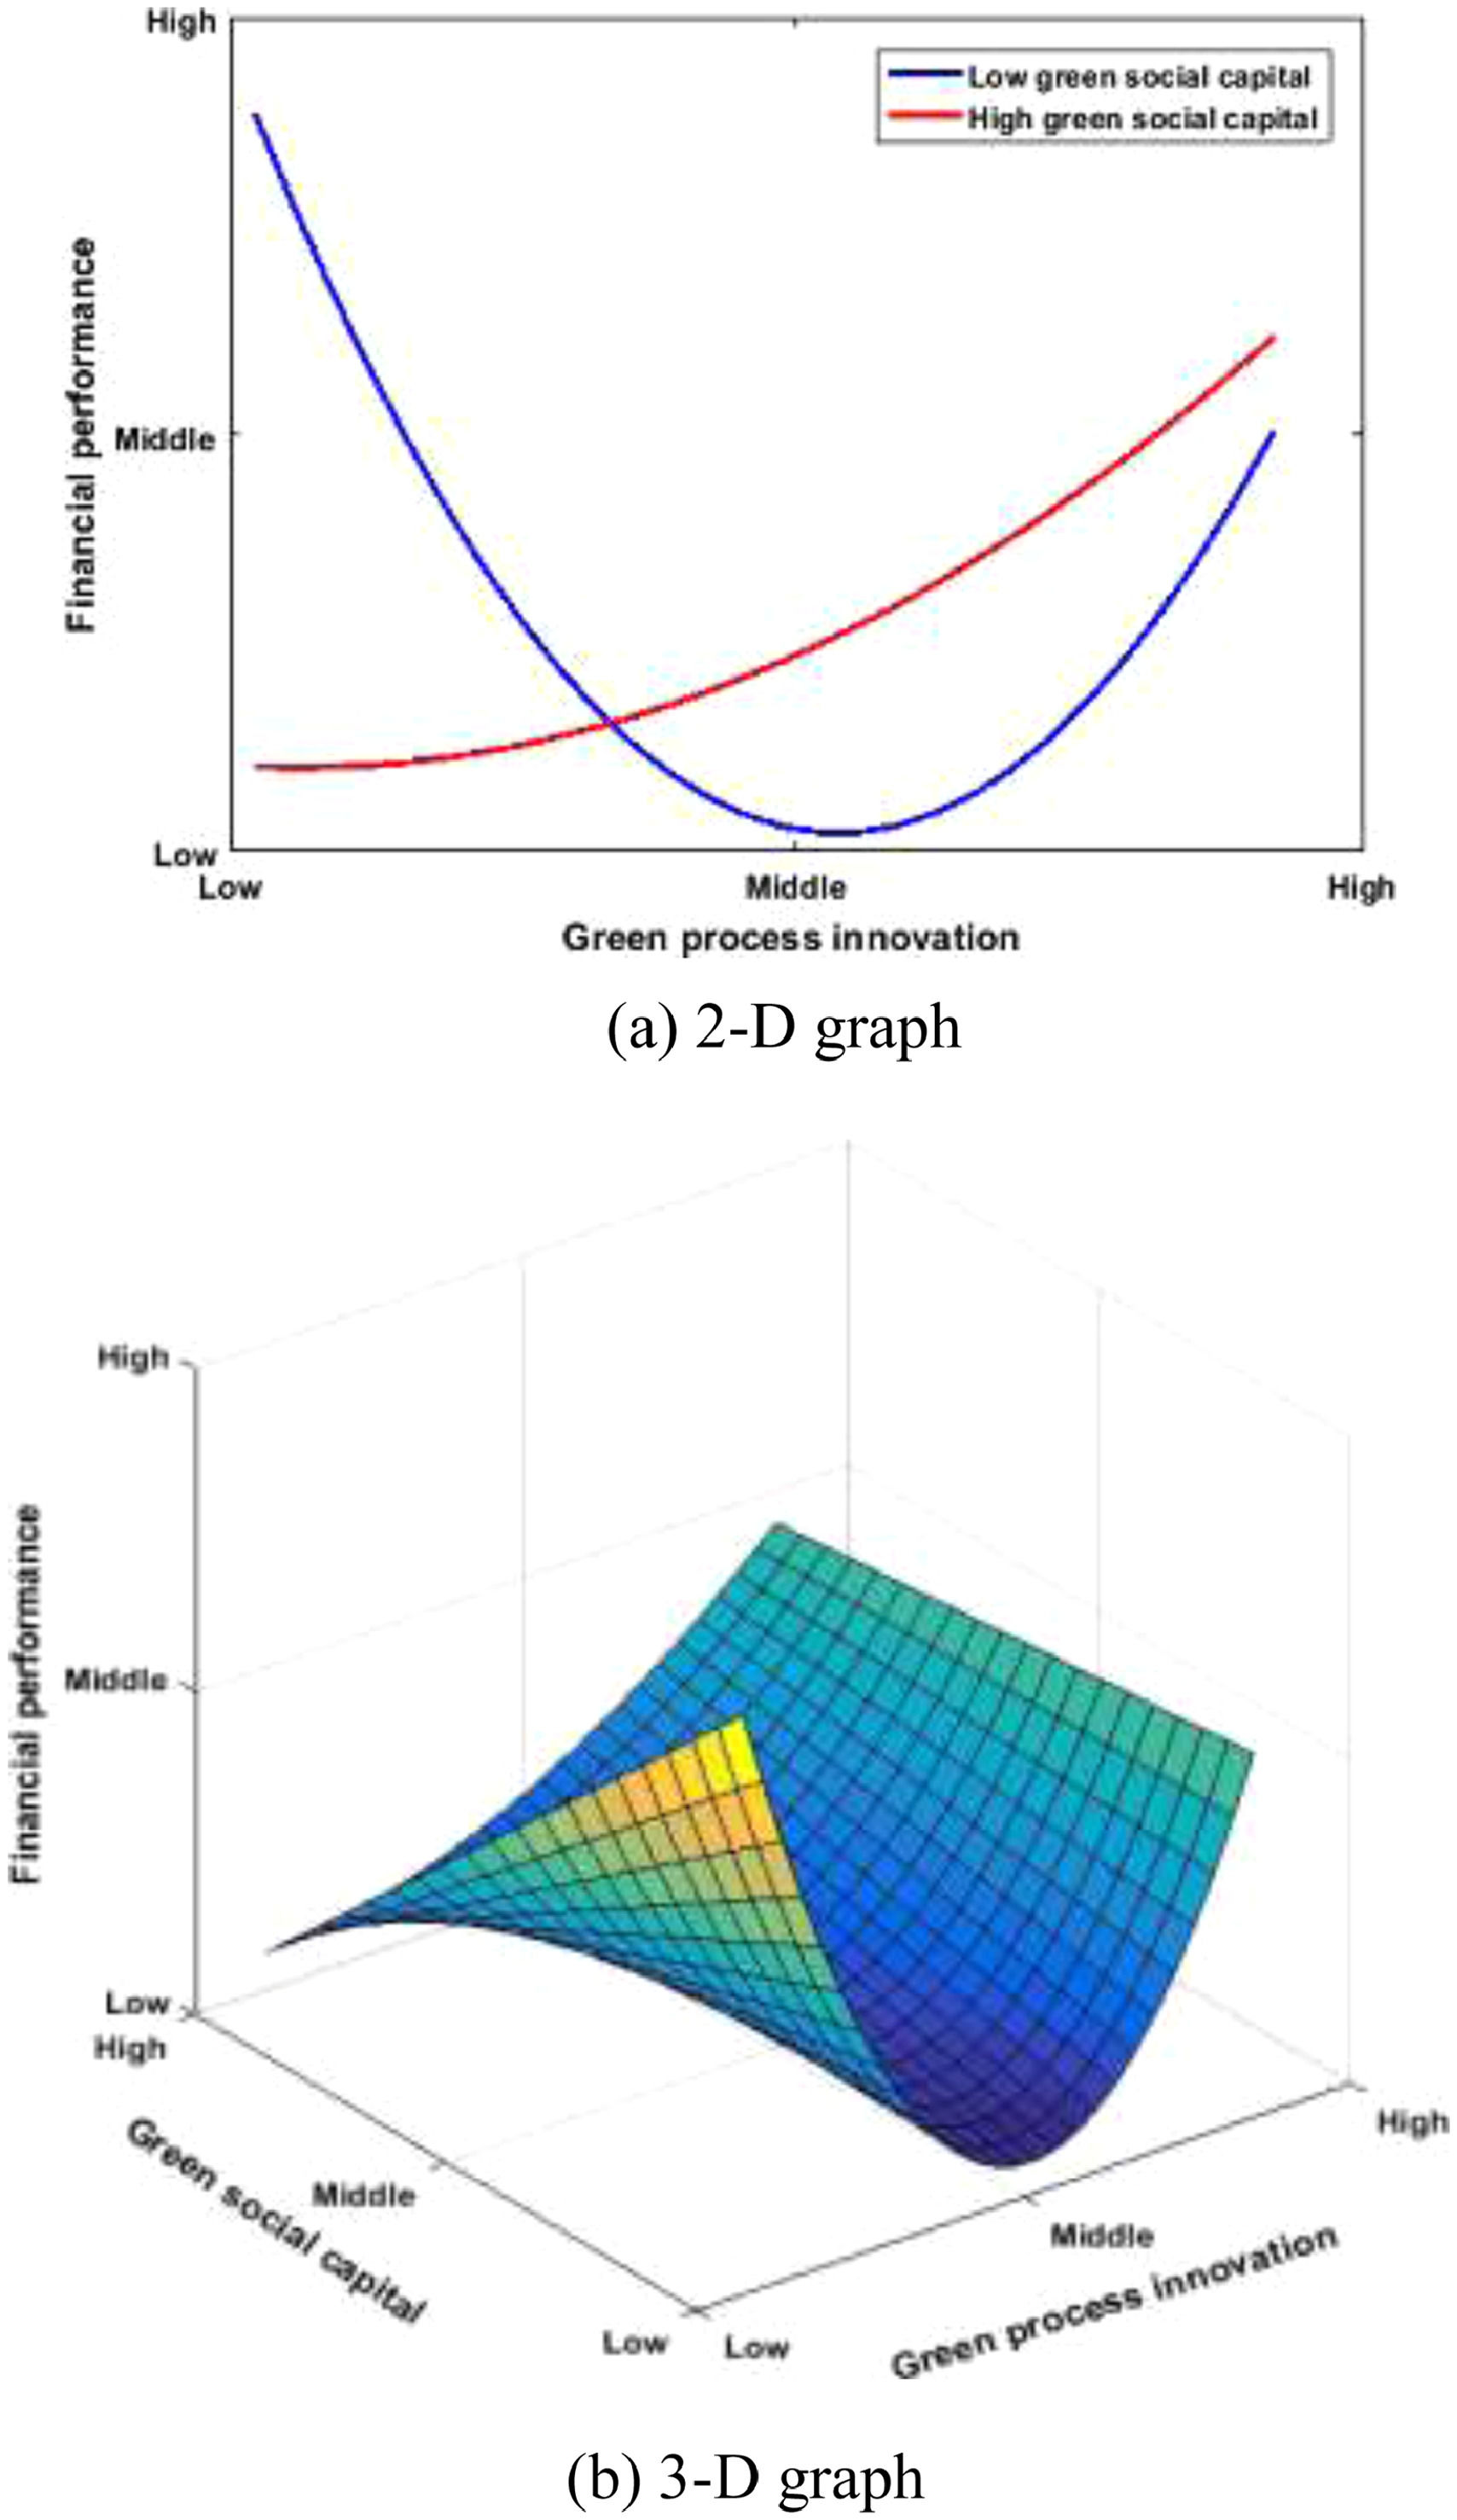
Figs. 3a and 3b graphically illustrate the U-shaped relationship between green process innovation and firms’ financial performance for different levels of green social capital. In these figures, we see that the first-order effect of green process innovation on firms’ financial performance was lower when green social capital was high versus when it was low. At the same time, the minimum level of green process innovation on firms’ financial performance was moderate when green social capital was low, whereas, when green social capital was high, the minimum level shifted to a higher point. These results corroborate the expectations formulated in H2, in which we suggested that a higher level of green social capital reduces the negative effects of green process innovation on firms’ financial performance. Thus, H2 is fully affirmed.

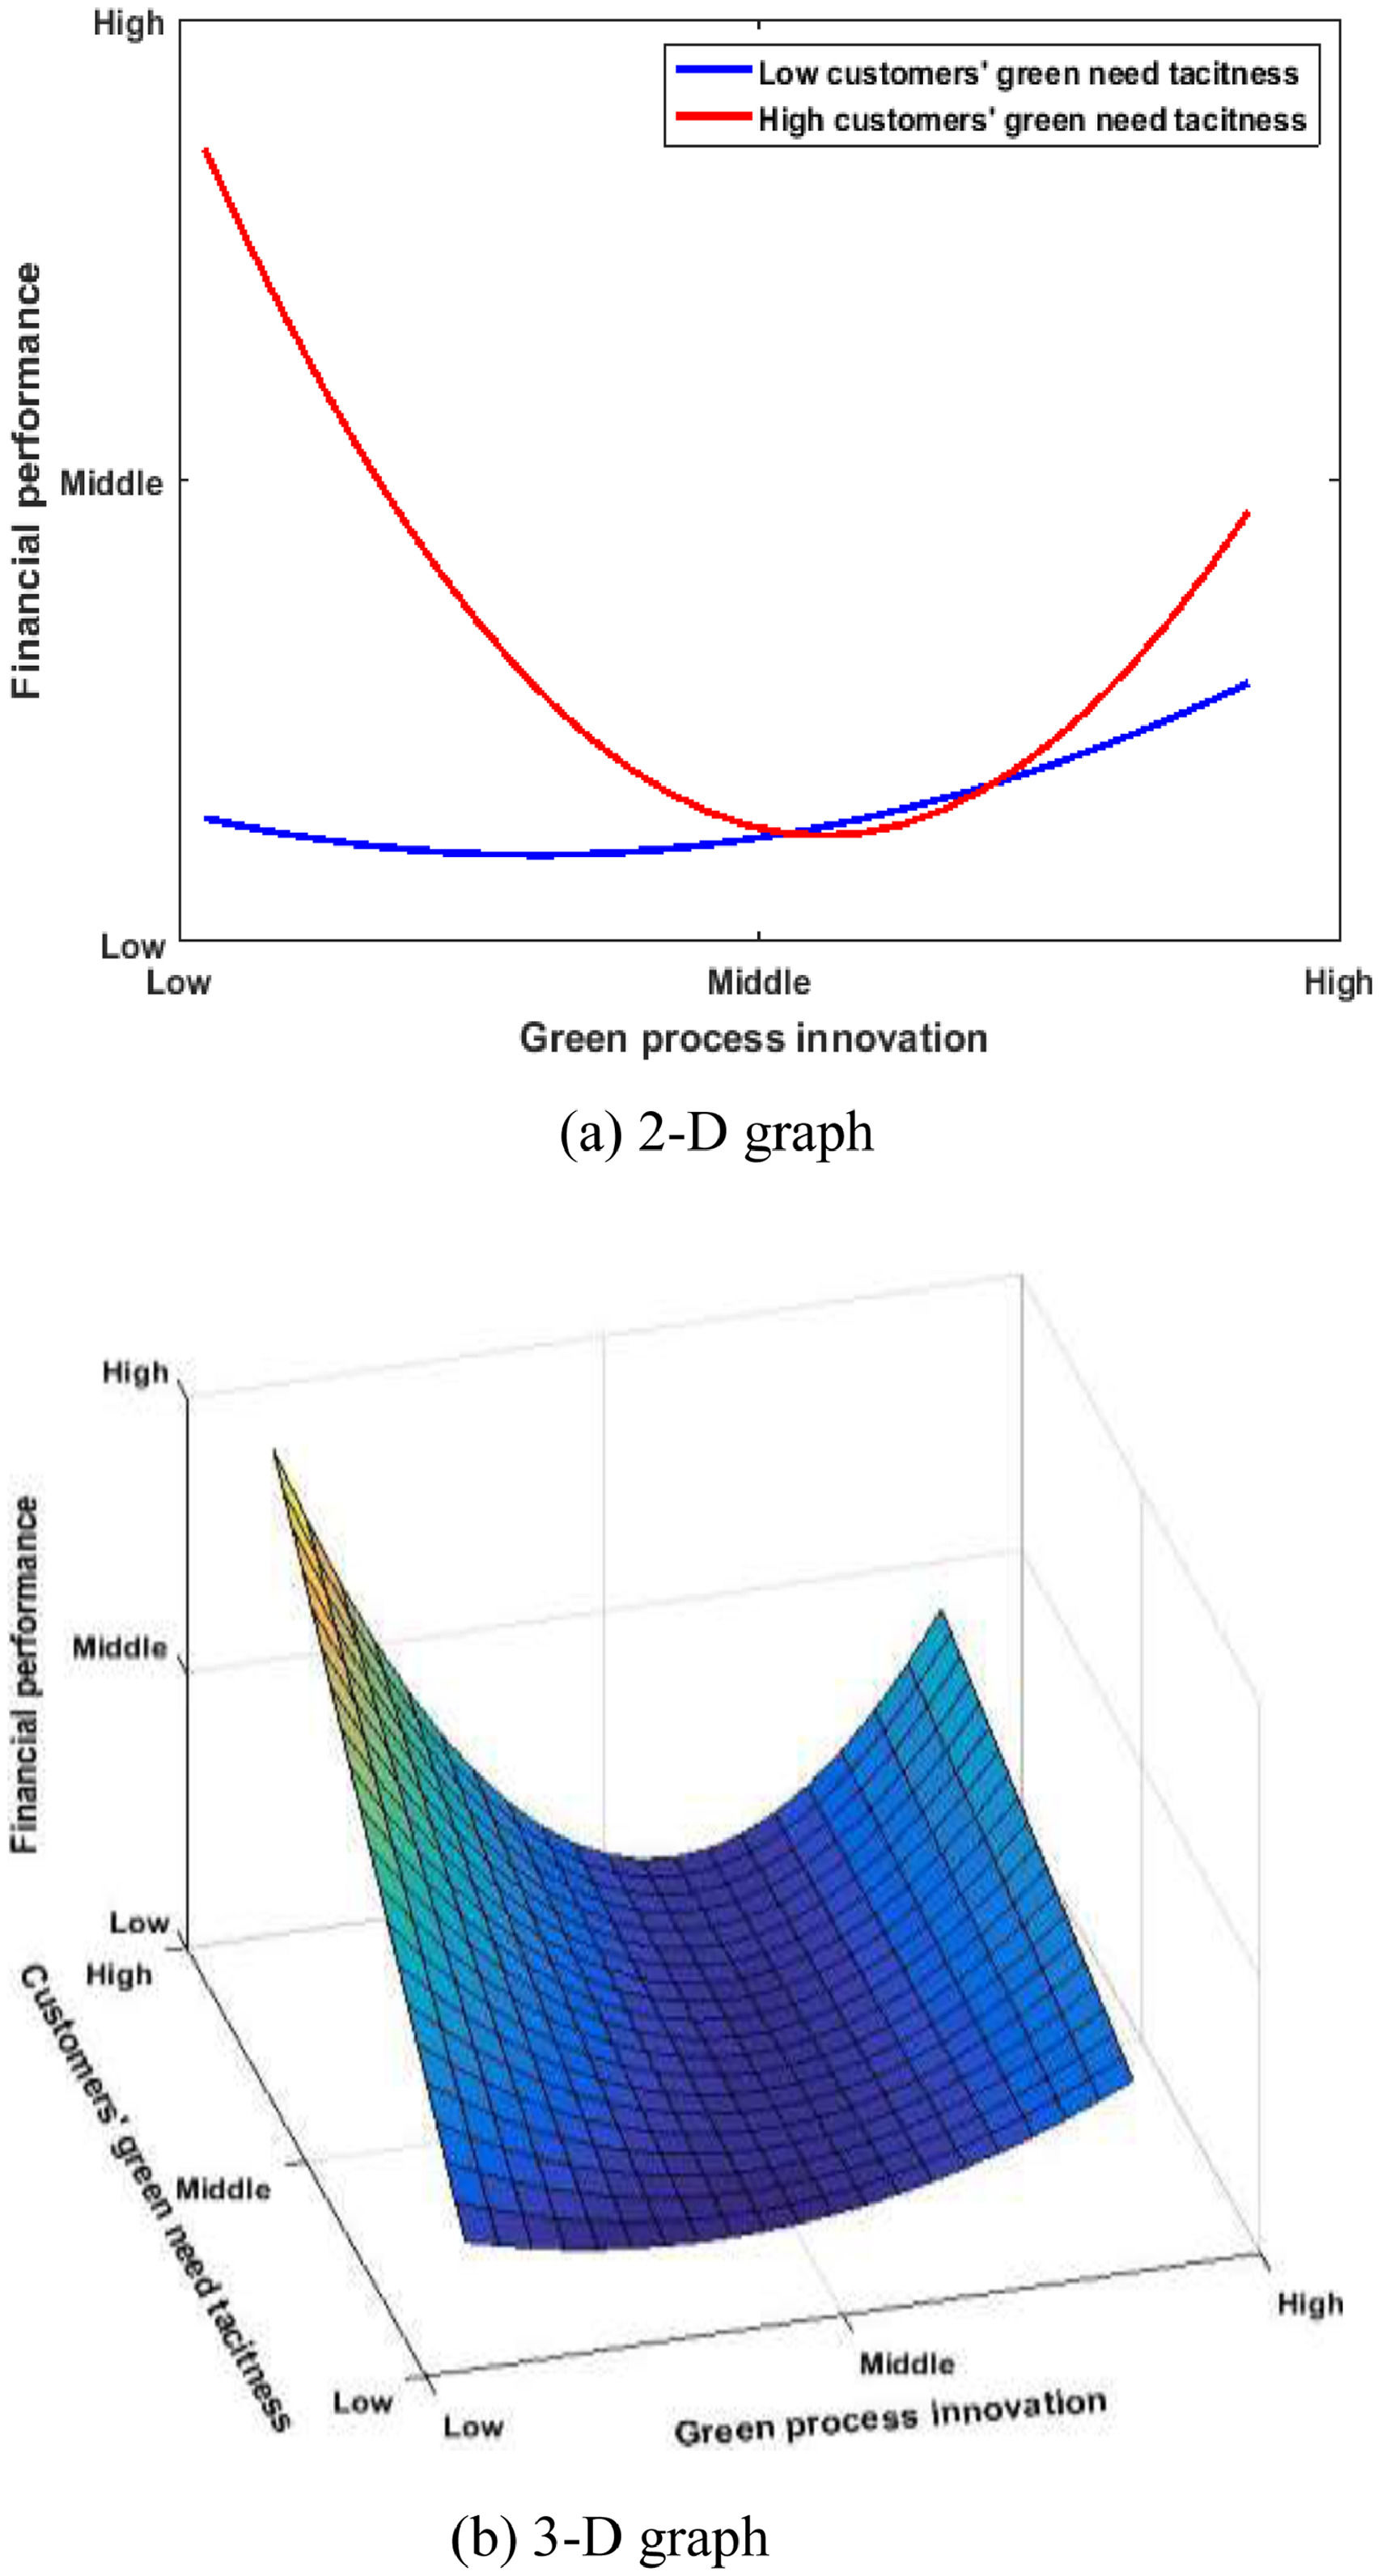
The results from Model 6 demonstrate that the interaction between the linear term of green process innovation and customers’ tacit green needs was significantly negative (β = −1.876, p < 0.1), and that the interaction between green process innovation squared and customers’ tacit green needs was positive and significant (β = 0.802, p < 0.1), thus providing support for H3. Figs. 4a and 4b graphically depict how customers’ tacit green needs moderated the U-shaped relationship between green process innovation and firms’ financial performance. From these figures, we can see the first-order effect of green process innovation on firms’ financial performance was higher when customers’ tacit green needs were high versus when they were low. However, the minimum level of green process innovation on firms’ financial performance shifted to a lower point when customers’ tacit green needs were high, as opposed to when they were low. This suggests high green needs’ tacitness appears to increase the negative effects of green process innovation on firms’ financial performance. Thus, H3 is fully supported.

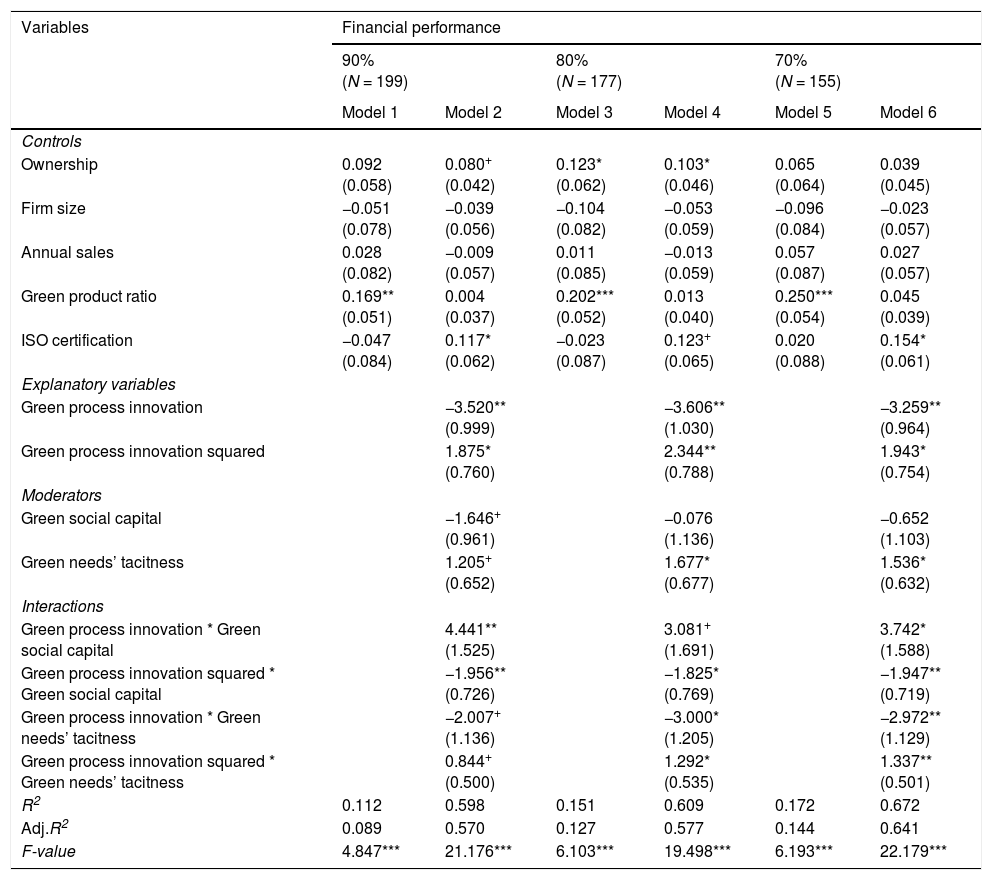
To verify the robustness of our findings regarding the U-shaped relationship between green process innovation and firms’ financial performance, we performed several robustness tests. First, we added the cubic terms to Eq. (1) (Haans et al., 2016); the results from Model 3 in Table 4 showed that the cubic terms were not significant (β = −0.479, p > 0.1), thereby negating the possibility of a cubic curvilinear effect. Second, we conducted robustness tests by excluding 10% and 30% of the original sample randomly (Haans et al., 2016). Table 5 presents the results of these tests, which show that green process innovation squared was positive and significant for firms’ financial performance. Furthermore, the results demonstrated that both green social capital and green needs’ tacitness significantly moderate the U-shaped relationship between green process innovation and firms’ financial performance. On the whole, the results, shown in Table 5, indicated that the coefficients were consistent with the results in Table 4, and thus our results were found to be robust.
Robustness tests: Regression results for three randomly selected subsamples.
Note: +p < 0.1; *p < 0.05; **p < 0.01; ***p < 0.001. Standard errors in parentheses.
With the growing awareness of the degradation of the natural environment, studies on green process innovation have provided valuable contributions in literature. However, these earlier studies did not explore whether the effect of green process innovation on firms’ financial performance was linear or nonlinear (e.g., Miroshnychenko, Barontini & Testa, 2017; Przychodzen et al., 2020). Our work has provided new insights on this research field by demonstrating the U-shaped relationship between green process innovation and financial performance. Furthermore, our findings showed this U-shaped relationship is moderated by green social capital and customers’ tacit green needs, such that green social capital weakens the negative impact of green process innovation on firms’ financial performance, and that customers’ tacit green needs strengthen the negative effect of green process innovation on firms’ financial performance.
Theoretical contributionsOur research contributes to the body of knowledge on green process innovation literature in three areas: First, this study contributes to green process innovation research by examining the U-shaped relationship between green process innovation and firms’ financial performance. More specifically, our findings revealed that firms pursuing green process innovations do not always experience higher financial performance than non-green innovative firms; rather, only a high level of green process innovation can enhance firms’ financial performance. This finding differs from the results of Miroshnychenko et al. (2017)) and Przychodzen et al. (2020)), who found that green process innovation has a positive linear effect on financial performance. At the same time, by conducting an in-depth analysis of the impact of different levels of green process innovation on firms’ financial performance, our study complements the work of previous researchers (e.g., Aguilera-Caracuel & Ortiz-de-Mandojana, 2013; Rezende et al., 2019). Overall, our study helps us better understand how firms’ financial performance differs, depending on the different levels of green process innovation.
Second, in this study, we theoretically and empirically examined the boundary conditions regarding how green social capital moderates the relationship between green process innovation and firms’ financial performance from the angle of internal factors. Although various studies have focused on the internal factors affecting green process innovation, such as in terms of management commitment and HR practices (e.g., El-Kassar & Singh, 2019), firm image (e.g., Ma et al., 2017; X. Xie et al., 2019b), or knowledge sharing (e.g., Wong, 2013), little research has examined the internal factors from the perspective of green social capital. To address this gap, we investigated the role of green social capital in the U-shaped relationship between green process innovation and firms’ financial performance, finding that the negative impact of green process innovation on financial performance is weakened when firms demonstrate a higher level of green social capital. This result suggests green social capital, defined as informal exchanges and experience sharing among employees, can reduce the potential for failure as firms pursue their green process innovations, as well as optimize the social relationships within the organization, both of which play a crucial role in enhancing green innovation performance (Chen et al., 2019). Therefore, green social capital can be seen as an internal information condition that helps firms pursuing green process innovation overcome challenges as they move in innovative green directions, thus positively affecting their financial performance. Overall, our work extends previous research by Chen et al. (2019), Delgado-Verde et al. (2014)), and Yadiati et al. (2019)) by providing a more nuanced understanding of how green social capital affects the performance of firms’ green process innovations. Furthermore, our findings also expand our current understanding of why some firms may succeed when they invest in green process innovation, whereas others do not.
Third, this study theoretically and empirically examined the contextual boundary of how customers’ tacit green needs moderate the relationship between green process innovation and firms’ financial performance from the angle of external factors. Prior research has examined the external factors that influence green process innovation, such as environmental regulations (e.g., Guo et al., 2018) and green subsidies (e.g., Xie et al., 2016), but little research has focused on external factors from the perspective of customers’ tacit green needs. To address this gap, we explored the effect of this tacitness on the relationship between green process innovation and firms’ financial performance, finding that the negative effect of green process innovation on firms’ financial performance is stronger when firms demonstrate a higher level of green needs’ tacitness. This result reveals that firms with high green needs’ tacitness face a greater risk of losing their direction or relevance during the production process, which may lead to a significant decline in financial performance because they are unable to satisfy their customers’ green needs. Therefore, customers’ tacit green needs can be seen as an external factor that negatively affects the financial performance of innovative green process firms. This work complements previous studies (e.g., Zhang et al., 2015; (Zhang and Xiao, 2020)Zhang & Xiao, 2019), which asserted that innovation outcomes differ, depending on the level of customers’ tacit green needs. Overall, our work further enlarges our understanding of the relationship between green process innovation and firms’ financial performance in the context of customers’ tacit green needs, which expands the boundary conditions of green process innovation research.
Managerial implicationsAs green process innovation become increasingly important for firms, our study presents managers with several important implications: First, our findings reveal there is an appropriate “inflection point” among the levels of green process innovation beyond which green process innovation can play a positive role in promoting firms’ financial performance. Accordingly, the level of green process innovation needs to be strengthened enough to make it across this inflection point to promote firms’ financial performance. From the managerial point of view, we thus suggest that greater investment should be made in green process innovations by taking the long view regarding the environmental and economic benefits of green process innovation.
Second, firms should leverage their internal green social capital to strengthen the benefits that come from their green process innovations. Given that green social capital is a critical factor for speeding up knowledge flow among employees within organizations, firms should take advantage of green social capital by enhancing their ability to communicate and share knowledge among employees to raise awareness of green process innovations. Furthermore, firm managers should employ appropriate human resource management strategies to foster these connections and exchanges, as well as increase trust and social cohesion among employees. Accordingly, if members feel more connected and supported, and they are willing to share information, this can reduce some of the isolation and fragmentation issues that can occur in the pursuit of green process innovation.
Third, firms should consider the level of customers’ tacit green needs to achieve better innovation outcomes. Our findings suggest successfully comprehending, translating, and absorbing customers’ tacit green needs play a key role in promoting green innovation practices. Therefore, managers should strive to overcome the challenges of identifying customers’ green needs. For example, firms might wish to consider allowing customers to participate in customer needs’ data analysis or to participate in the product design process ((Zhang and Xiao, 2020); Kobarg, Stumpf-Wollersheim, Schlägel & Welpe, 2020). According to Bretschneider and Zogaj (2016), the Ideas Competitions (or Ideas Communities), the Story Telling-Strategy, and the Observing Customer Activities-Strategy may encourage customers to verbalize and showcase their ideas. Particularly, in the Ideas Competitions, customers’ ideas expressed by short videos should be encouraged rather than written forms because managers can easily observe their actions and “translate” their tacit needs. Or, standardized questionnaire, interviews, or product trial session may allow managers to conduct more personalized interactions with the customers and exploit their tacit knowledge more efficiently. In this way, firms could utilize their customers’ creativity and knowledge (Cui & Wu, 2016) to successfully discover and translate their customers’ green needs and, in so doing, boost financial performance.
Limitations and directions for future researchThis study had several limitations: First, our findings came from survey data collected from companies in the Yangtze Delta Region, which, when considering all of China, is still a relatively small number of Chinese firms. Future analysis could expand the research scope to include more firms—and from other areas—as well. Second, the survey data provides a birds-eye analysis of how green process innovation can influence firms’ financial performance in multiple industry sectors. Therefore, upcoming research could go further to capture in-depth data in a particular industry, such as the inert sector (Ilg, 2019). Third, we only considered the moderating roles of green social capital and customers’ tacit green needs in the link between green process innovation and firms’ financial performance. However, there could be other factors, such as management commitment and HR practices (El-Kassar & Singh, 2019) or sociocultural and economic factors (Méndez-Picazo, Galindo-Martín & Castaño-Martínez, 2021), which could also have effects on firms’ green process innovation efforts. Thus, it is important to develop multiple moderators for green process innovation and use a larger firm-level data source to further examine this subject. Ultimately, we hope this study inspires more research on how green process innovation can promote firms’ financial performance in the modern economy, where there is an ever-increasing demand for firms to be more environmentally friendly.
This research was supported by the Major Project of National Social Science Fund of China (Grant number: 20&ZD059).
Xuemei Xie is currently a Professor at School of Economics and Management, Tongji University. Her research interests include collaborative innovation, and green innovation. Her articles have appeared in more than forty international journals, such as Journal of Business Ethic, Technovation, R&D Management, Journal of Business Research, Psychology & Marketing, Business and Society, Asia Pacific Journal of Management, Business Strategy and the Environment, and IEEE Transactions on Engineering Management, among others.