

National brand (NB) delistings are not uncommon in food retailing; however, retailer boycotts of individual brands may have negative consequences, particularly in terms of store switching intentions. This paper analyses which kind of assortment (‘store brand-only’ or mixed) is more profitable in terms of store loyalty. It also analyses the influence of assortment composition and consumer attitude variables on store loyalty using a controlled, online experiment on an established large consumer panel consisting of 1400 individuals in the Spanish market. Four product categories were evaluated: yoghurt, fresh bread and rolls, toilet tissue and laundry detergent. Our results suggest that mixed assortments – particularly those including a large number of NBs – are associated with greater store loyalty.
La eliminación de marcas de fabricante (MdF) de los lineales de los minoristas se ha convertido en una estrategia cada vez más frecuente, especialmente en el ámbito de los grupos de distribución con base alimentaria. Sin embargo, algunas situaciones recientes parecen sugerir que la eliminación de las MdF de los surtidos puede provocar consecuencias negativas para el minorista. En este trabajo analizamos qué tipo de surtido (surtidos «solo Marca de Distribuidor» vs. surtidos mixtos) es más beneficioso para el minorista en términos de lealtad al establecimiento. A partir de aquí, analizamos en ambos casos de qué manera la composición del surtido y algunas características perceptuales del consumidor influyen en dicha lealtad. Para ello, se ha desarrollado un experimento online con 1.400 individuos pertenecientes a un panel de consumidores existente en España en el contexto de 4 categorías de producto: yogur, pan de molde, papel higiénico y detergente de máquina en polvo. Los resultados obtenidos sugieren que los surtidos «mixtos» (sobre todo los compuestos por un elevado número de marcas de fabricante) generan mayor lealtad al establecimiento.
In recent years there has been a worldwide surge in market share taken by store brands (SBs) in the consumer packaged goods (CPG) industry (Ailawadi, Pauwels, & Steenkamp, 2008); SBs are emerging as fierce competitors of national brands (NBs) (Lamey, Deleersnyder, Steenkamp, & Dekimpe, 2012). Across Europe, SBs have increased their market share to an average value share of 36.7% and unit share of 47.1% (Information Resources, Inc. [IRI], 2013). Spain has one of the largest SB share fractions (value and unit) in Europe (value: 43.6%; unit: 51.6%) (Private Label Manufacturers Association [PLMA], 2014). Sixty percent of Spanish SB customers began buying them as a consequence of economic contractions, and half of these customers have replaced NBs with cheaper ones. Only 21% of these individuals are willing to go back to the higher-priced NBs they previously bought when the economic climate begins to improve (IRI, 2013). In the U.S., SB share is lower (value, 14.6%; unit 17.2%) (IRI, 2013); nevertheless, in 11 of the last 12 years SBs have outperformed NBs in terms of sales growth (Lamey et al., 2012).
The abovementioned figures imply that the number of NBs has been reduced in favour of SBs (Olbrich & Grewe, 2013). Although the current global economic crisis has boosted this tendency there are other reasons for retailers to emphasise their own brands:
- •
to gain control over shelf space (Amrouche & Zaccour, 2007);
- •
to reach more consumers by attracting their attention and reinforcing the store image (Ailawadi & Keller, 2004);
- •
to strengthen their negotiating power with manufacturers (Baltas & Argouslidis, 2007);
- •
to increase free shelf space to sell the SB (Garretson, Fisher, & Burton, 2002)
Because of all these advantages, many retailers have recently decided to delist a large number of national brand (NB) items (Sloot & Verhoef, 2008), for example, Walmart cut big brand names Hefty and Glad from its food storage shelves in favour of its own Great Value brand. Hefty and Glad were only able to get their shelf space back when they increased their advertising space more than sevenfold and sixfold, respectively. Hefty also agreed to produce Walmart's SB (Kelemen, 2012). The former Dutch food retail chain Edah decided to delist 2000 NB items prior to introducing 1000 SB items (Distrifood, 2004). A large national grocery retailer in Austria delisted a high-scale regional sausage brand (Neuburger) because the manufacturer refused to cut its price. UK retailer Asda refused to stock the P&G brand Charmin and German retailers Edeka and Metro delisted some NBs because they were unsatisfied with the pricing and distribution policy of the manufacturers (Sloot & Verhoef, 2011). In December 2008 the Spanish retailer Mercadona (the largest food retailer operating in Spain, in terms of retail space) delisted almost 800 items from several manufacturers, including Nestlé and Sara Lee, together with other important Spanish high value brands such as Calvo, Pascual and Vileda (El País, 2009). According to Mercadona this decision was simply a consequence of the rotation of these NBs; however, it seemed that multiple conflicts between the retailer and manufacturers were behind the decision.
Many of the abovementioned retailers were however forced to reintroduce these NBs, accepting the manufacturers’ terms, in order to end consumer boycotts and avoid further damage to their image (Sloot & Verhoef, 2011). For example, the Dutch chain Edah had to reintroduce approximately 1000 of the total number of delisted NBs in response to a large volume of customer complaints and disappointing sales in the 6 months after the large reduction in NB assortment (Foodmagazine, 2005). The Austrian retailer which had delisted Neuburger sausages suffered a similar experience, deciding to reintroduce the brand after an extensive online media campaign by Neuburger fans calling for a boycott of the chain and many of the NBs delisted by the Spanish retailer Mercadona were subsequently returned to the shelves to prevent damage to Mercadona's image and avoid legal disputes with manufacturers. Despite the relisting of NBs the image and even the positioning of Mercadona seem to have changed from that of a supermarket to a soft discounter, at least outside Spain.1
All the abovementioned examples suggest that delisting NBs may damage a retailer's image and store sales, but why? One argument prominent in the literature is that a ‘complete assortment’ may be one that includes most of the available brands (Pepe, Abratt, & Dion, 2012) including all well-known brands (Sloot & Verhoef, 2008) and that consumers will view an assortment from which all NBs have been delisted as incomplete.2 It has also been suggested that delisting NBs may penalise overall profit in those product categories as well as damaging consumers’ image of the retailer. Gómez (2009) argued that in certain consumer segments retailers have to capitalise on their shelf space by giving the most profitable NBs (e.g. best-selling NBs and medium-selling NBs with favourable positioning). It has also been suggested that delisting a large number of NBs to increase SB sales may have ‘unwanted effects’ on SB perceived brand value (Rubio, Villaseñor, & Oubiña, 2014a) and hence on store image (Gómez & Rozano, 2009). Many authors (e.g. González-Benito & Martos-Partal, 2012; Vilas, 2011) have used this argument to suggest that retailers should divide shelf space between NBs and their own brands.
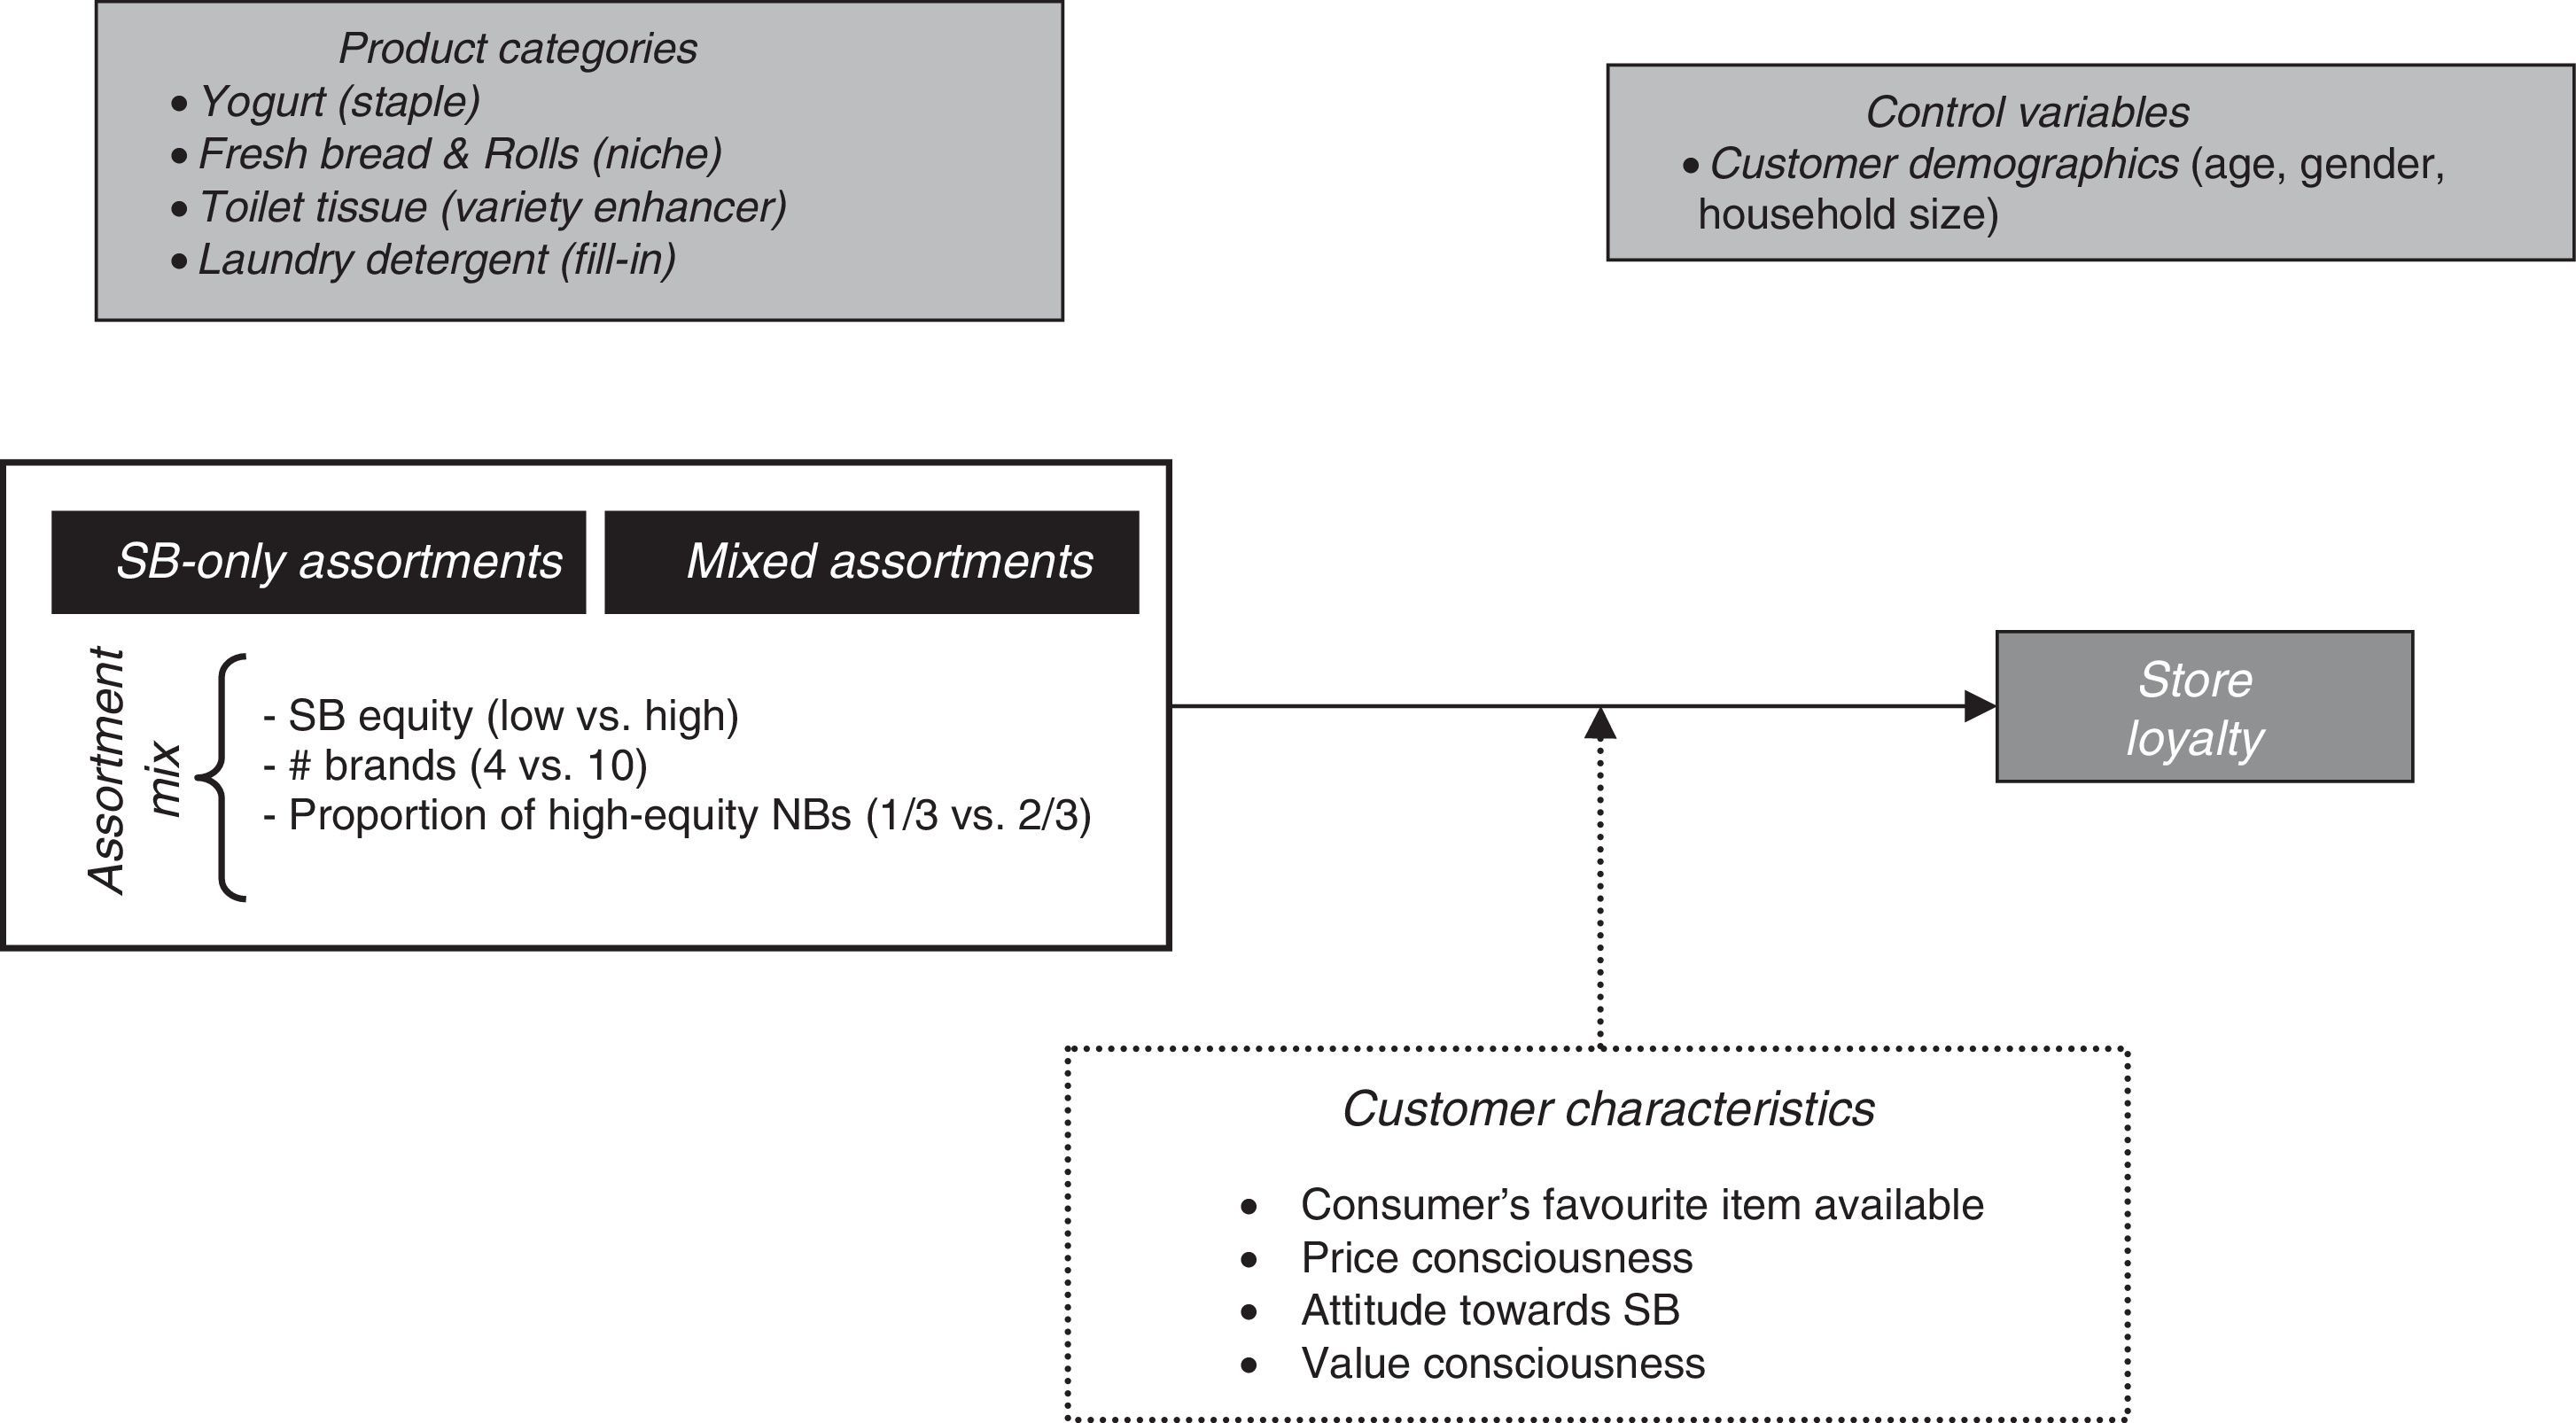
The purpose of this research was to shed light on these issues by formally investigating whether carrying a SB-only or mixed assortment is associated with greater store loyalty. We analysed the effects of several factors related to assortment composition, namely SB-equity; number of brands; proportion of high-equity NBs and availability of customer's favourite item, on store loyalty. We also investigated several consumer attitude variables (price consciousness; value consciousness and attitude towards SBs) and sociodemographic variables (age; gender and household size).
With these goals in mind we designed an online experiment on a sample of 1400 individuals belonging to an established large consumer panel in Spain owned by IRI Worldwide. We investigated four product categories: (1) yoghurt; (2) fresh bread & rolls; (3) laundry detergent and (4) toilet tissue. These categories were characterised using the penetration-frequency distinction introduced by Dhar, Hoch, and Kumar (2001). These authors classified products in terms of penetration (percentage of households that purchase the category; ‘high’ or ‘low’) and frequency (average number of times per year that product is purchased), giving four groups of product: (1) staples (high penetration–high frequency); (2) niches (low penetration–high frequency; (3) variety enhancers (high penetration–low frequency) and (4) fill-ins (low penetration–low frequency).
Gaining insight into how assortment composition affects store loyalty is useful to both manufacturers and retailers. Manufacturers learn how important their brand is in a retailer's assortment, whilst retailers can make an informed assessment about maintaining NBs in their assortments, as they will gain information about the impact on store loyalty of carrying a SB-only assortment. Characterising products in four typologies in terms of penetration and frequency also provides information of interest to managers.
Our study contributes to marketing literature, as there has been little research into the consequences of delisting all NBs in a given assortment. Most previous studies have analysed the relationship between the delisting of several Stock Keeping Units (SKUs) and category sales (e.g. Boatwright & Nunes, 2001; Drèze, Hoch, & Purk, 1994) or store sales (e.g. Borle, Boatwright, Kadane, Nunes, & Shmueli, 2005). There is limited evidence on the consequences of delisting an entire brand. Narasimhan and Wilcox (1998) compared cases in which the retailer possesses no own brand with cases in which the retailer offers both its SB and NBs. Sloot and Verhoef (2008) and Wiebach and Hildebrandt (2012) analysed the comprehensive delisting of NBs in a product category, but in both studies the resulting assortments retained at least one NB alongside the SB; neither study considered the situation in which only the SB is offered. A further limitation of previous studies is that most looked at the consequences of delisting low-equity brands. Although assortment reduction mainly involves delisting of low-selling items and brands, high-equity brands may also be affected, for example, when a retailer is in conflict with a NB manufacturer, as in some of the examples discussed above. Given the differences between high- and low-equity brands in terms of advertising and R&D investments it is likely that consumers react differently to their delisting (Sloot & Verhoef, 2008).
Theoretical frameworkFig. 1 depicts the framework that guides our research.
Mixed assortments vs. SB-only assortments: effect of delisting all NBs
Brand delisting is a form of assortment reduction which involves removing all NB items from a given assortment,3 with the consequence that consumers are no longer able to find NB items for that product category on the retailer's shelves (Sloot & Verhoef, 2008).
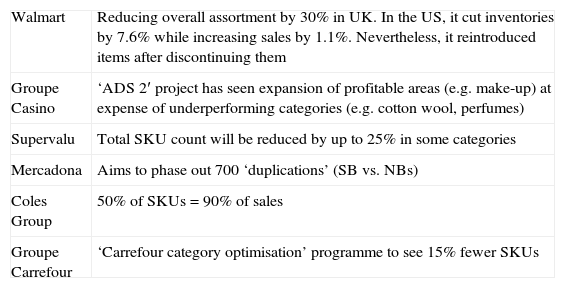
After years in which they increased the variety and numbers of items offered to customers, retailers have finally begun to understand that, sometimes, less really is more. In 2008, for the first time in years, retailers delisted more products (9.1% of total assortment) than they added to their shelves (8.2% of total assortment) (Rider, 2010). At the time of writing SKU rationalisation appears to be a priority for the world's leading retailers (Table 1).
SKU rationalisation decisions of some of the world's leading retailers.
| Walmart | Reducing overall assortment by 30% in UK. In the US, it cut inventories by 7.6% while increasing sales by 1.1%. Nevertheless, it reintroduced items after discontinuing them |
| Groupe Casino | ‘ADS 2′ project has seen expansion of profitable areas (e.g. make-up) at expense of underperforming categories (e.g. cotton wool, perfumes) |
| Supervalu | Total SKU count will be reduced by up to 25% in some categories |
| Mercadona | Aims to phase out 700 ‘duplications’ (SB vs. NBs) |
| Coles Group | 50% of SKUs=90% of sales |
| Groupe Carrefour | ‘Carrefour category optimisation’ programme to see 15% fewer SKUs |
For manufacturers, retailer assortment rationalisation offers the opportunity to supply the SB, develop joint store marketing campaigns or have their NB featured on the retailer's limited shelf space for a given product category. Assortment rationalisation also carries obvious risks for manufacturers, they will be competing more directly with the SB and there is a serious risk of being delisted, particularly if a manufacturer is not able to match or exceed competitors’ marketing spend.
For retailers, assortment rationalisation allows them to dedicate more shelf space to selling their SB, in some cases enabling it to dominate many product categories and strengthening the retailer's position in negotiations with manufacturers. Delisting NBs can also result in lower operating costs, decreasing SKUs, inventory costs and reducing the frequency of out-of-stock situations (Wiebach & Hildebrandt, 2012).
Reducing NBs has been one of the responses retailers have made to the global economic crisis (Gómez, Oubiña, & Rubio, 2011). Many retailers have extended their SB programmes, listing a SB in new categories, extending SB positioning to include several price levels or increasing marketing for the SB. It has been suggested how that the starring role that many Spanish retailers have given to their SB is excessive (Gómez & Rozano, 2009). Gómez (2009) suggested that many retailers were achieving to the ‘maximum shelf space level’ using their own SB with negative consequences for profits and subsequently their image. Rubio, Villaseñor, & Oubiña (2014a) took a similar position, suggesting that in many cases retailers’ decisions to delist NBs in an attempt to increase SB sales would have negative consequences for SB value, because consumers would be buying the SB as a consequence the non-availability of NBs rather than out of preference. Many authors (e.g. Ailawadi et al., 2008; González-Benito & Martos-Partal, 2012) have recommended that although SBs are more profitable for retailers, they should consider maintaining NBs on their shelves to secure store loyalty. Sloot and Verhoef (2008) argued that a balance between SB and NB items is essential because consumers will consider an assortment which does not include well-known NBs incomplete. From this, it follows that an assortment carrying no NBs will be considered incomplete. The delisting of all NBs by a retailer is likely to provoke consumers to switch stores (Quelch & Harding, 1996), especially those who have a strong preference for NBs; additionally, perception of the variety of the retailer's assortment will also be affected in consumers who frequently purchase SBs. Delisting all NBs in a given category may also have negative consequences for a retailer's whole assortment, by influencing purchases in all categories which make up consumers’ shopping baskets as consumers tend to buy the same brand (e.g. SB) across categories (Batra & Sinha, 2000; Richardson, Jain, & Dick, 1996).
We therefore predict that store loyalty will be lower for assortments including no NBs than for mixed assortments (i.e. assortments containing both NBs and the SB). Martínez and Montaner (2008) showed that loyalty towards a SB, and in turn the store, can be reinforced by listing a wide portfolio of products capable of satisfying most consumers’ needs. Our first hypothesis was derived from these arguments:H1a Store loyalty (per category and overall) is higher when an assortment is mixed than when it is SB-only.
In terms of Dhar et al.’s (2001) four product categories, we predicted that because higher purchasing frequency results in more frequent experience of the negative consequences of an incomplete assortment (i.e. one with no NBs), it would increase the likelihood of consumers switching to another store. We predicted that the difference between store loyalty for mixed and SB-only assortments would be greater for high purchasing frequency product categories (i.e. staple and niches) than for low purchasing frequency product categories (i.e. variety enhancers and fill-ins); this prediction is consistent with van Trijp, Hoyer, and Inman (1996) suggestion that very frequently purchased products are associated with less variety-seeking behaviour.H1b The difference between store loyalty (per category and overall) for mixed assortments and SB-only assortments will be higher for more frequently purchased product categories.
Assortment is one of the most important competitive tools a retailer can use to attract consumers into the store (Simonson, 1999). Many authors (e.g. Baker, Parasuraman, & Voss, 2002; Sirohi, McLaughlin, & Wittink, 1998; Sloot & Verhoef, 2008; Verhoef, Langerak, & Donkers, 2007) have suggested that attitude towards retailer's assortment influences consumers’ intention to continue purchasing at the store. Attitude towards an assortment is a function of, amongst other things, assortment size and composition.4 In view of our focus on the differences between mixed and SB-only assortments we decided to analyse the influence on store loyalty of the following factors affecting assortment composition: (1) SB-equity (both types of assortment); (2) number of brands (mixed assortments only); (3) proportion of high-equity NBs (mixed assortments only); (4) presence of consumer's preferred brand (both types of assortment).
SB equityBranding literature assumes that consumers show greater commitment to high-equity brands than low-equity brands (see Kahn & Lehmann, 1991). This is consistent with the suggestion by Rubio, Villaseñor, and Oubiña (2014a) that perceived SB equity plays a critical role in consumer identification with a brand. It has been argued that identification with an SB will increase confidence in the retailer and thence store loyalty (Gómez, Fernández, & Abril, 2012; González-Benito & Martos-Partal, 2012). Corstjens and Lal (2000) argued that SBs are capable of generating store loyalty by increasing retailer differentiation (Sudhir & Talukdar, 2004). We hypothesised that the inclusion of a high-equity SB in a retailer's assortment would reduce consumer switching intentions.H2a Store loyalty is higher for assortments containing a high-equity SB than those containing a low-equity SB.
We also hypothesised that the association between store loyalty and SB equity would be stronger for assortments containing no NBs (i.e. SB-only assortments), because in this context consumers are not able to choose a non-SB product, whereas in a mixed assortment they can choose a high-equity NB product in preference to a low-equity SB product to satisfy their needs (Sloot & Verhoef, 2008). We hypothesised that SB-equity would have more effect on consumers’ store loyalty for SB-only assortments.H2b The association between store loyalty and a high-equity SB is stronger for SB-only assortments than mixed assortments.
We hypothesised that neither penetration nor frequency would moderate the association between SB equity and store loyalty.
Number of brandsAmine and Cadenat (2003) suggested that most consumers rely mainly on the number of SKUs when evaluating the attractiveness of a given assortment. Larger assortments tend to be perceived as having greater variety; this is assumed to be beneficial to consumers (Chernev, 2006) for several reasons. Firstly, there is a higher probability that a large assortment will contain a consumer's preferred item. In addition consumers might perceive utility in simply having more items in the choice set (Oppewal & Koelemeijer, 2005). Finally, larger assortments provide buyers with more opportunity to learn about the assortment of products available (Bellenger & Korgaonkar, 1980). Taken together these arguments suggest that there is likely to be a positive association between a greater variety in a given assortment and sales (Cadeaux, 1999) or the number of visits to the store (Borle et al., 2005). Recent research has however suggested that larger assortments do not always benefit choice and that it may be advisable to reduce variety either by delisting items from several brands or completely delisting a single brand (Sloot & Verhoef, 2008). The negative consequences of larger assortments are a consequence of the extra-cognitive effort required to evaluate the attractiveness of the large number of options; this may result in consumers ‘surrendering’ and leaving the store without making a purchase (Dhar, 1997). Many authors (e.g. Boatwright & Nunes, 2001; Broniarczyk, Hoyer, & McAlister, 1998; Drèze et al., 1994; Iyengar & Lepper, 2000) have reported that retailers can make substantive reductions in the number of items they carry without negatively affecting customers’ perceptions of variety, category sales or store sales. Based on these arguments we hypothesised that the positive consequences associated with mixed assortments would be greater for smaller mixed5 assortments than larger mixed assortments.H3a Store loyalty is higher for smaller mixed assortments than larger mixed assortments.
The influence of variety will depend on the product category. Borle et al. (2005) suggested that less frequently purchased categories would be negatively affected by cuts in the number of SKUs offered, i.e. for these categories smaller assortments would be associated with a lower number of store visits thus reducing consumer loyalty to the store. Dhar et al. (2001) suggested that product categories which are purchased frequently by most households (i.e. staples) would benefit from reductions in assortment size, at least in terms of choice probability, whilst less frequently purchased categories (i.e. variety enhancers and fill-ins) and categories purchased frequently but by only a small percentage of households (i.e. niches) would benefit from increasing SKUs. On the basis of these arguments we set out the following hypotheses:H3b For staples (high penetration; high purchase frequency) smaller mixed assortments will be associated with greater store loyalty than large mixed assortments. For variety enhancers and fill-ins (low purchase frequency) and for niches (high purchase frequency; low penetration) smaller mixed assortments will be associated with lower store loyalty than large mixed assortments.
High-equity brands enjoy higher perceived quality, brand preference and brand-awareness than low-equity brands (Keller, 2002). Consumer preference for high-equity brands is associated with a stronger commitment to them (Aaker, 1991); this in turn makes consumers more likely to be loyal to the brand and less likely to be loyal to a store which delists high-equity brands (Sloot & Verhoef, 2008). From this it follows that consumers should favour assortments containing a higher proportion of high-equity brands. Given that consumer perceptions of the variety of a retailer's assortment are negatively associated with store switching intentions (Baker et al., 2002) it is likely that there will be a positive association between proportion of high-equity brands in a given assortment and store loyalty, because assortments containing a higher proportion of high-equity brands offer consumers a greater number of ‘acceptable’ options (Geyskens, Gielens, & Gijsbrechts, 2010; Sloot & Verhoef, 2008; Wiebach & Hildebrandt, 2012). The relationship between store loyalty and brand-equity is independent of purchase frequency and penetration. Therefore:H4 Assortments containing a high proportion of high-equity brands will be associated with greater store loyalty than assortments containing a lower proportion of high-equity brands.
The availability of consumer's favourite item is critical to the attractiveness of a given assortment (Oppewal & Koelemeijer, 2005). Boatwright and Nunes (2001) showed that consumers are much less likely to buy in a category when their favourite brand is eliminated. Broniarczyk et al. (1998) reported that assortment reductions of up to 25% may go unnoticed if the consumer's preferred brand remains available whilst the absence of the favourite brand from the assortment reduces preference for shopping at the store. We therefore hypothesised that the availability of a consumer's favourite brand would reduce store switching intentions independent of product category.H5 Store loyalty will be greater for assortments containing the consumer's favourite brand than assortments which do not.
Price consciousness has been defined as ‘the degree to which the consumer focuses exclusively on paying low prices’ (Lichtenstein, Ridgway, & Netemeyer, 1993: 25). Price consciousness is an attitudinal trait which can be distinguished from price sensitivity, the degree to which an individual's behaviour is influenced by a change in price, although it is generally assumed that there is a direct relationship between the two concepts (Ailawadi, Neslin, & Gedenk, 2001).
One of the consequences of price consciousness is an increase in purchase of SBs (Sinha & Batra, 1999); it has traditionally been assumed that SB purchasing is strongly associated with price consciousness6 (e.g. Batra & Sinha, 2000; Burger & Schott, 1972; Fernández & Martínez, 2004). Attitude towards SB – one of the factors influencing SB purchases – is strongly linked to consumer perception of price; positive perceptions of a SB may be linked to a desire to pay the lowest possible price for a given product (Burton, Lichtenstein, Netemeyer, & Garretson, 1998). We hypothesised that price consciousness would be higher among consumers who chose SBs than consumers who chose NBs. Price consciousness is directly associated with SB loyalty (Fernández, 2010). On the basis of these arguments we set out the following hypothesis:H6a The positive association between price consciousness and store loyalty will be stronger for SB-only assortments than mixed assortments.
Price consciousness varied with product category (Monroe & Krishnan, 1985). According to Jin and Suh (2005) these differences are a consequence of factors such as perceived risk or engagement with the category; consumers are more price conscious about categories in which they believe that poor choices carry high risks (Sinha & Batra, 1999). Batra and Sinha (2000) analysed factors influencing SB success in 12 different product categories (grocery products; cleaning and personal care products; pharmaceuticals and stationery products), price consciousness was used to ‘capture’ the influence of other individual factors (demographic and attitudinal variables) which were not directly assessed; they found that price consciousness was the most importance influence on SB purchasing behaviour. More recently Jin and Suh (2005) reported that price consciousness plays only small role in SB purchasing of groceries and appliances (e.g. televisions); there was no significant association between price consciousness and SB purchasing of groceries and price consciousness had only a small effect on SB purchasing of appliances.
On the basis of these results we predicted that the moderating effect of price consciousness would depend on the product category. Previous research considered all product categories together (e.g. Batra & Sinha, 2000) or considered all products in a general category such as ‘groceries’ together (e.g. Jin & Suh, 2005) rather than differentiating between product categories in terms of penetration and frequency as we have done in this study. We suggest that price consciousness will influence all purchases in all categories, but will have more influence on decisions about items which are purchased more frequently:H6b Price consciousness will have more effect on the relationship between assortment type and store loyalty for frequently purchased products than less frequently purchased products.
After price, quality is one of the most important functional aspects of a product (see Chandon, Wansink, & Laurent, 2000). Jin and Suh (2005) suggested that price and quality should be considered together as they are interrelated. Value consciousness has been defined as ‘a concern for paying low prices subject to some quality constraints’ (Lichtenstein et al., 1993: 235); the value conscious consumer does not consider product quality in absolute terms, but as a function of product price; value conscious consumers usually try to maximise the quality–price ratio (Zeithaml, 1988).
Value consciousness is an important factor in SB purchasing as it is associated with attitude towards SB, SB purchasing and SB loyalty (Burton et al., 1998; Gómez et al., 2011; Jin & Suh, 2005; Richardson et al., 1996). Very value conscious individuals will be more loyal to SBs, an association mediated by a positive attitude towards SBs (Garretson et al., 2002; Gómez & Rubio, 2010). Rubio, Villaseñor, and Oubiña (2014b) suggested that SBs satisfy of the needs of value conscious consumers, by supplying them with the value they are demanding. We hypothesised that value consciousness would increase consumers’ store loyalty independent of the type of assortment (mixed or SB-only).H7a Value consciousness is associated with store loyalty.
We hypothesised that concern about maximising the quality-price ratio would be more acute with respect to more frequent purchases:H7b Value consciousness will have a stronger influence on the association between assortment type and store loyalty in the case of frequently purchased products.
Attitude towards SB is one of the factors underlying consumer receptivity to SB products (Burton et al., 1998; Martos-Partal & González-Benito, 2009). Attitude towards SB is a key predictor of intention to purchase SB (Miquel, Caplliure, Pérez, & Bigné, 2014) and it has been argued that there is a positive association between SB purchasing and store loyalty (e.g. Kumar & Steenkamp, 2007). Store loyalty is one of the key benefits retailers obtain from having important SBs (Berg & Queck, 2010); however, the direction of the association between attitude towards SBs and store loyalty is not clear; consumers who are loyal to a store may be more likely to buy its SB, rather than vice versa (Bonfrer & Chintagunta, 2004). It has also been suggested that the relationship between attitude towards SB and store loyalty is nonlinear (Ailawadi & Harlam, 2004; Ailawadi et al., 2008; González-Benito & Martos-Partal, 2012). On the basis of these arguments we hypothesised that there would be an association between attitude towards SB and store loyalty for both type of assortments, which would be stronger for SB-only assortments.H8 The positive influence of attitude towards SB on the relationship between assortment type and store loyalty will be stronger for SB-only assortments than mixed assortments.
We predicted that this relationship would be independent of product category.
Socio-demographic aspects: age, gender and household sizeMany authors have questioned the relevance of socio-demographic variables to characterisations of the SB consumer (see e.g. Martínez & Montaner, 2008 on characterisation of the Spanish SB consumer); however, many others (e.g. Ailawadi et al., 2001) have suggested that socio-demographic factors are strongly linked to attitudinal factors and therefore very relevant to the design of marketing strategies. A lot of SB research has analysed the effects of socio-demographic variables (e.g. Ailawadi & Keller, 2004; Ailawadi et al., 2008; Baltas & Argouslidis, 2007; Martos-Partal & González-Benito, 2009); more recent papers exploring the impact of the global economic crisis on SB-related consumer behaviour have also considered the influence of socio-demographic variables (e.g. Diallo & Kaswengi, 2014; Miquel et al., 2014; Ngobo & Jean, 2012).
On the basis of the interest in relationships between socio-demographic variables and consumer attitudes and behaviours we collected data on three socio-demographic variables (age, gender and household size) commonly included in investigations of consumers’ brand – particularly in the context of SBs – and store choices.
MethodologyOne thousand four hundred individuals belonging to an established large consumer panel in Spain, owned by IRI Worldwide, participated in a controlled online experiment. At the time of the study IRI Worldwide owned a consumer panel consisting of 322,338 individuals ranging in age from 24 to 65 years who were responsible for their households’ food, cleaning and personal care purchases in supermarkets and hypermarkets. IRI Worldwide's panel was representative of the Spanish population, both in terms of socio-demographic variables (gender; age; income level; level of education; household size) and geographical distribution.7 Following IRI guidance that a sample size of at least 1000 individuals (at least 35 individuals per experimental condition) was needed to ensure representativeness of the sample, we decided to use a sample of 1400 individuals. The 1400 individuals (59.7% female; 40.3% male) ranged in age from 24 to 65 years (average age=41.75 years).
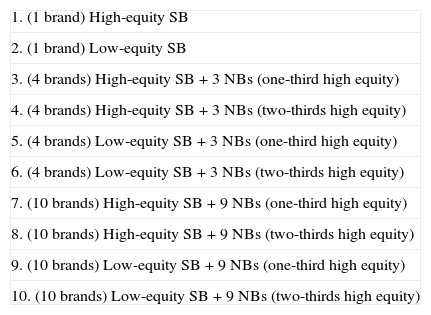
We manipulated two aspects of assortment variety, (1) assortment size and (2) assortment composition. All subjects were presented with one of three different assortment sizes (one brand; four brands; ten brands). Assortment composition was ‘SB only’ (i.e. one-brand assortments) or ‘mixed’ assortments (i.e. four- and ten-brand assortments8). Assortments (mixed and SB-only) also varied in terms of SB equity (high-equity SB; low-equity SB). The proportion of high- and low-equity NBs also varied (one-third; two-thirds) for the mixed assortments. Table 2 shows the ten assortment conditions.
Scenarios (assortment conditions) showed to participants in the experiment.
| 1. (1 brand) High-equity SB |
| 2. (1 brand) Low-equity SB |
| 3. (4 brands) High-equity SB+3 NBs (one-third high equity) |
| 4. (4 brands) High-equity SB+3 NBs (two-thirds high equity) |
| 5. (4 brands) Low-equity SB+3 NBs (one-third high equity) |
| 6. (4 brands) Low-equity SB+3 NBs (two-thirds high equity) |
| 7. (10 brands) High-equity SB+9 NBs (one-third high equity) |
| 8. (10 brands) High-equity SB+9 NBs (two-thirds high equity) |
| 9. (10 brands) Low-equity SB+9 NBs (one-third high equity) |
| 10. (10 brands) Low-equity SB+9 NBs (two-thirds high equity) |
There were two broad groups of assortments, (a) SB-only assortments (i.e. assortments #1 and #2) and (b) mixed assortments (i.e. assortments #3–10).
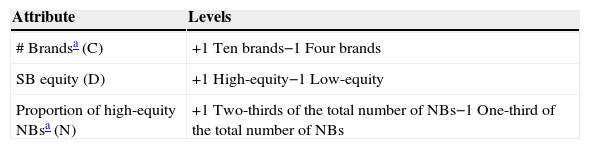
Only one attribute of SB-only assortments was variable (SB equity), but three attributes of mixed assortments were variable (SB equity; number of brands; proportion of high-equity NBs). There were two levels of all variable attributes. Attributes and levels are shown in Table 3.
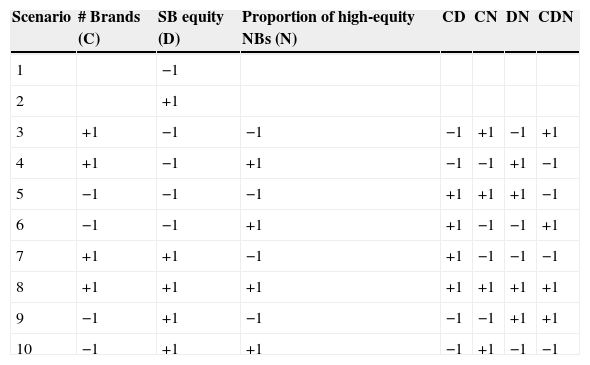
There were two possible SB-only scenarios (one variable attribute, two levels; 21=2) and eight possible mixed assortments scenarios (23=8). We have also reported the two and three-factor interactions (Table 4).
Design matrix.
| Scenario | # Brands (C) | SB equity (D) | Proportion of high-equity NBs (N) | CD | CN | DN | CDN |
|---|---|---|---|---|---|---|---|
| 1 | −1 | ||||||
| 2 | +1 | ||||||
| 3 | +1 | −1 | −1 | −1 | +1 | −1 | +1 |
| 4 | +1 | −1 | +1 | −1 | −1 | +1 | −1 |
| 5 | −1 | −1 | −1 | +1 | +1 | +1 | −1 |
| 6 | −1 | −1 | +1 | +1 | −1 | −1 | +1 |
| 7 | +1 | +1 | −1 | +1 | −1 | −1 | −1 |
| 8 | +1 | +1 | +1 | +1 | +1 | +1 | +1 |
| 9 | −1 | +1 | −1 | −1 | −1 | +1 | +1 |
| 10 | −1 | +1 | +1 | −1 | +1 | −1 | −1 |
We investigated four product categories: (1) yoghurt; (2) fresh bread & rolls; (3) laundry detergent and (4) toilet tissue. Product categories were selected from a sample of 53 categories accounting for more than 60% of the Spanish market's Fast Moving Consumer Goods (FMCG) sales and assigned to one of the four groups defined by Dhar et al. (2001) on the basis of data on rotation and sales volume. We ranked all 53 categories according to their penetration and frequency. We selected the following four product categories: yoghurt (staples); fresh bread & rolls (niches); toilet tissue (variety enhancers) and laundry detergent (fill-ins). This selection included two food categories (the most important component of Spaniards’ shopping baskets), personal care and cleaning product categories. Selecting one category in each of the four groups defined by Dhar et al. (2001) allowed us to assess whether store loyalty depended on product category, but also ensured that the results could be generalised to other product categories sharing the same frequency and penetration.
Subjects were randomly assigned to the ten conditions. The final number of subjects per assortment condition was 35. There were four product categories, giving a total of 140 subjects per assortment condition. The brands (both SB and NBs) presented in the various conditions were selected on the basis of their share of the Spanish market share and a rating given by the owners of the consumer panel. The same SBs were used in all categories. After an in-depth analysis – conducted jointly by IRI and the authors – of factors including sales, SB awareness, surface share per retailer and number of stores we selected Hacendado and Bosque Verde (Mercadona) and Auchan (Alcampo) as high- and low-equity SBs, respectively.9 The selection of NBs was, of course dependent, on the product category10 (see Appendix A.1):
- 1.
Yoghurt: Danone; Activia; Actimel; Kaiku; C.L.Asturiana; La Lechera (high-equity) and La Fageda; Nestlé; Sveltesse; Pascual; Hoya de la Iglesia; Feiraco (low-equity)
- 2.
Fresh bread & rolls: Bimbo; Panrico; Silueta; Ortiz; Semilla de Oro; La Bella Easo (high-equity) and Beiker; Dulcesol; Pasticely; Gotri; Ketlerer; Hornada Casera (low-equity)
- 3.
Toilet tissue11: Scottex; Colhogar; Foxy; Renova (high-equity) and Dodot; Charmin; Moltex Soft; Hello Kitty (low-equity)
- 4.
Laundry detergent: Ariel; Wips; Skip; Elena; Colón and Dixán (high-equity) and Flota; Puntomatic; Luzil; Lord; Lagarto; Don Limpio (low-equity)
While viewing an online presentation of the assortment (assortments were always presented at the top of the screen), respondents filled out a questionnaire assessing those aspects included into the theoretical framework of the present research.
The dependent variable in our analyses was store loyalty, operationalised as store switching intention (SSI). SSI is an important metric for retailers, because if consumers visit another store to purchase a brand missing from a given assortment this has a negative effect on store traffic and consequently on store sales and store profits (Borle et al., 2005; Sloot & Verhoef, 2008). Because SSI is a relatively straightforward concept we measured it using a single-item, five-point scale (Rossiter, 2002) which allowed respondents to indicate the probability that they would switch to another store for future purchases in a given category. We also included another similarly structured single item asking about probability of switching to another store for future purchases of all products in the shopping basket.12 Price consciousness (PC) was measured using a three-item, seven-point scale adapted from Lichtenstein et al.’s (1993) original five-item scale. Value consciousness (VC) was measured using a four-item seven-point scale adapted from Lichtenstein, Netemeyer, and Ridgway (1990) original seven-item scale. Attitude towards SB (ASB) was measured using a six-item seven-point scale adapted from Burton et al. (1998). Finally, the presence of the consumer's preferred brand (CPB) was measured using a dummy variable (−1=‘my preferred brand is not in the assortment presented here’; 1=‘my preferred brand is in the assortment presented here’); respondents indicated their preferred brand and we checked whether this brand was or was not present in the assortment they had been presented with.
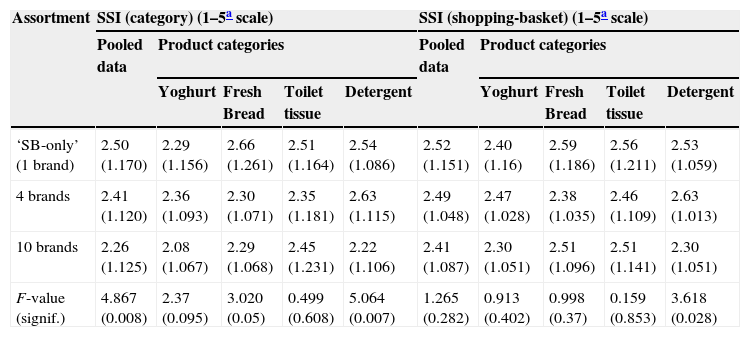
ResultsEffects of delisting NBsTable 5 summarises average SSI (category and shopping basket) for SB-only and mixed assortments (by category and overall).
Average SSI (std. deviation) (category and shopping basket) for SB-only (1 brand) and mixed (4 and 10 brands) assortments.
| Assortment | SSI (category) (1–5a scale) | SSI (shopping-basket) (1–5a scale) | ||||||||
|---|---|---|---|---|---|---|---|---|---|---|
| Pooled data | Product categories | Pooled data | Product categories | |||||||
| Yoghurt | Fresh Bread | Toilet tissue | Detergent | Yoghurt | Fresh Bread | Toilet tissue | Detergent | |||
| ‘SB-only’ (1 brand) | 2.50 (1.170) | 2.29 (1.156) | 2.66 (1.261) | 2.51 (1.164) | 2.54 (1.086) | 2.52 (1.151) | 2.40 (1.16) | 2.59 (1.186) | 2.56 (1.211) | 2.53 (1.059) |
| 4 brands | 2.41 (1.120) | 2.36 (1.093) | 2.30 (1.071) | 2.35 (1.181) | 2.63 (1.115) | 2.49 (1.048) | 2.47 (1.028) | 2.38 (1.035) | 2.46 (1.109) | 2.63 (1.013) |
| 10 brands | 2.26 (1.125) | 2.08 (1.067) | 2.29 (1.068) | 2.45 (1.231) | 2.22 (1.106) | 2.41 (1.087) | 2.30 (1.051) | 2.51 (1.096) | 2.51 (1.141) | 2.30 (1.051) |
| F-value (signif.) | 4.867 (0.008) | 2.37 (0.095) | 3.020 (0.05) | 0.499 (0.608) | 5.064 (0.007) | 1.265 (0.282) | 0.913 (0.402) | 0.998 (0.37) | 0.159 (0.853) | 3.618 (0.028) |
The larger the number of brands in a given assortment, the smaller the SSI (i.e. the stronger store loyalty was) for future purchases of products in that category (F2,1397=4.867, p<0.008). This result seems to support the argument made by many authors (e.g. Martínez & Montaner, 2008; Pepe et al., 2012; Quelch & Harding, 1996) that consumers’ prefer ‘complete’ or comprehensive choice sets. We found a consumer preference for mixed assortments over SB-only assortments; however, Table 5 also shows that offering a mixed assortment in a given product category does not result in stronger store loyalty for future purchases of other product categories; i.e. there is no crossover of loyalty related to assortment composition. These results provide some support for hypothesis H1a; a mixed assortment was associated with category-specific store loyalty but not overall shopping basket store loyalty.
Our results suggest that the increase in store loyalty associated with carrying a mixed assortment is higher for frequent purchase categories. The differences between SSI with a large mixed assortment (SB+9 NBs) and SSI with a SB-only assortment were 0.21 (yoghurt); 0.37 (fresh bread & rolls) and 0.32 (laundry detergent); there were no differences in SSI related to assortment type (large mixed vs. SB-only) for the toilet tissue category. The difference for the frequent purchase categories (yoghurt and fresh bread & rolls) was 0.58 (0.21+0.37), whereas it was only 0.32 (0.32+0) for the low frequency purchase categories (toilet tissue and laundry detergent). Hypothesis H1b was, therefore, supported. Consumer preference for mixed assortments appears to be stronger for frequent purchase categories than low frequency purchase categories. Further analysis indicated that for the yoghurt and laundry detergent categories the relationship between assortment size and SSI followed an inverted U-shaped curve, such that the assortment containing 10 brands was associated with the lowest SSI, whereas for the fresh bread & rolls category the relationship was a negative-scope linear curve, such that larger mixed assortments were associated with the lowest SSI, i.e. the highest store loyalty.
Intention to switch store for the entire shopping basket was only affected by assortment size (one, four or ten brands) in the case of laundry detergent (fill-in category; F2,347=3.618, p<0.028). Hypothesis H1b was not supported. The relationship between assortment size (laundry detergent) and store loyalty for the entire shopping basket followed an inverted U-shaped curve, such that smaller mixed assortments (i.e. four brands) were associated with the highest SSI whilst large mixed assortments generated the lowest SSI. There was some support for Hypothesis H1bper category SSI but not shopping basket SSI benefited more from the presence of a mixed assortment in the case of high frequency purchases.
Influence of assortment composition and consumer variablesThe associations between store loyalty and assortment composition and several consumer variables were analysed. Several regression models with SSI (category and shopping basket) as the dependent variable were estimated.
Prior to estimating the model, we checked for multicollinearity in our data to avoid undesired effects. We computed the correlations between the independent variables and the Variance Inflation Factors (VIFs). All VIFs were below the recommended threshold of 10 (see Hair, Anderson, Tatham, & Black, 1998), except the VIF value for age for the SB-only regression models in the toilet tissue category. We therefore decided to eliminate age from these models and re-estimate both. The internal consistency of multi-item scales was also assessed and found to be satisfactory (see Appendix A.2). Several factor analyses were conducted so that factor scores for the three multi-item scales (price consciousness, value consciousness and attitude to SB) could be included in the regression models as independent variables. The value of the Kaiser–Meyer–Olkin sampling adequacy statistic confirmed that our data were suitable for factor analysis and the result of a Bartlett's test of sphericity also suggested that the R-matrix was not an identity matrix and therefore the items comprising each scale were not independent (Hair et al., 1998).
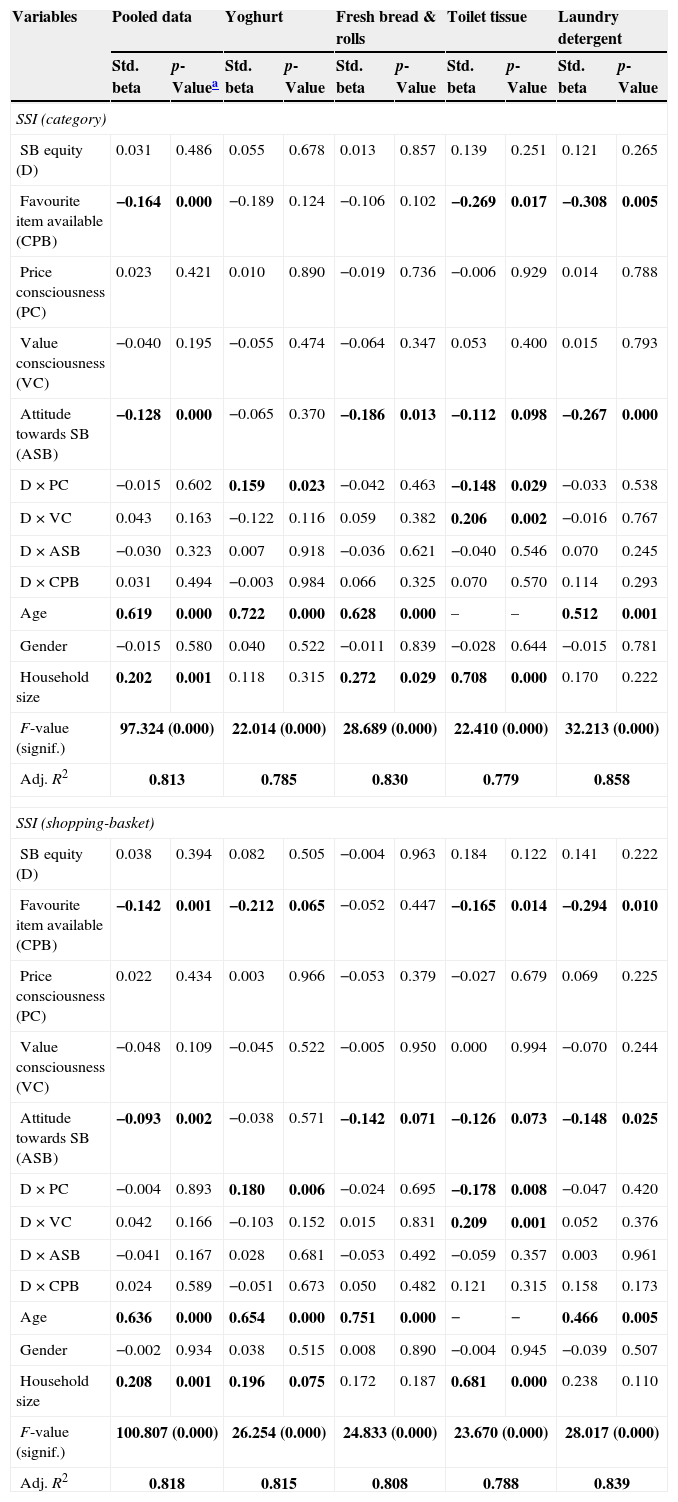
Tables 6 and 7 summarise the results (pooled and category data) of the regression models (SSI category and SSI shopping basket) for SB-only assortments and mixed assortments, respectively.
Estimation results (‘SB-only’ assortments).
| Variables | Pooled data | Yoghurt | Fresh bread & rolls | Toilet tissue | Laundry detergent | |||||
|---|---|---|---|---|---|---|---|---|---|---|
| Std. beta | p-Valuea | Std. beta | p-Value | Std. beta | p-Value | Std. beta | p-Value | Std. beta | p-Value | |
| SSI (category) | ||||||||||
| SB equity (D) | 0.031 | 0.486 | 0.055 | 0.678 | 0.013 | 0.857 | 0.139 | 0.251 | 0.121 | 0.265 |
| Favourite item available (CPB) | −0.164 | 0.000 | −0.189 | 0.124 | −0.106 | 0.102 | −0.269 | 0.017 | −0.308 | 0.005 |
| Price consciousness (PC) | 0.023 | 0.421 | 0.010 | 0.890 | −0.019 | 0.736 | −0.006 | 0.929 | 0.014 | 0.788 |
| Value consciousness (VC) | −0.040 | 0.195 | −0.055 | 0.474 | −0.064 | 0.347 | 0.053 | 0.400 | 0.015 | 0.793 |
| Attitude towards SB (ASB) | −0.128 | 0.000 | −0.065 | 0.370 | −0.186 | 0.013 | −0.112 | 0.098 | −0.267 | 0.000 |
| D×PC | −0.015 | 0.602 | 0.159 | 0.023 | −0.042 | 0.463 | −0.148 | 0.029 | −0.033 | 0.538 |
| D×VC | 0.043 | 0.163 | −0.122 | 0.116 | 0.059 | 0.382 | 0.206 | 0.002 | −0.016 | 0.767 |
| D×ASB | −0.030 | 0.323 | 0.007 | 0.918 | −0.036 | 0.621 | −0.040 | 0.546 | 0.070 | 0.245 |
| D×CPB | 0.031 | 0.494 | −0.003 | 0.984 | 0.066 | 0.325 | 0.070 | 0.570 | 0.114 | 0.293 |
| Age | 0.619 | 0.000 | 0.722 | 0.000 | 0.628 | 0.000 | – | – | 0.512 | 0.001 |
| Gender | −0.015 | 0.580 | 0.040 | 0.522 | −0.011 | 0.839 | −0.028 | 0.644 | −0.015 | 0.781 |
| Household size | 0.202 | 0.001 | 0.118 | 0.315 | 0.272 | 0.029 | 0.708 | 0.000 | 0.170 | 0.222 |
| F-value (signif.) | 97.324 (0.000) | 22.014 (0.000) | 28.689 (0.000) | 22.410 (0.000) | 32.213 (0.000) | |||||
| Adj. R2 | 0.813 | 0.785 | 0.830 | 0.779 | 0.858 | |||||
| SSI (shopping-basket) | ||||||||||
| SB equity (D) | 0.038 | 0.394 | 0.082 | 0.505 | −0.004 | 0.963 | 0.184 | 0.122 | 0.141 | 0.222 |
| Favourite item available (CPB) | −0.142 | 0.001 | −0.212 | 0.065 | −0.052 | 0.447 | −0.165 | 0.014 | −0.294 | 0.010 |
| Price consciousness (PC) | 0.022 | 0.434 | 0.003 | 0.966 | −0.053 | 0.379 | −0.027 | 0.679 | 0.069 | 0.225 |
| Value consciousness (VC) | −0.048 | 0.109 | −0.045 | 0.522 | −0.005 | 0.950 | 0.000 | 0.994 | −0.070 | 0.244 |
| Attitude towards SB (ASB) | −0.093 | 0.002 | −0.038 | 0.571 | −0.142 | 0.071 | −0.126 | 0.073 | −0.148 | 0.025 |
| D×PC | −0.004 | 0.893 | 0.180 | 0.006 | −0.024 | 0.695 | −0.178 | 0.008 | −0.047 | 0.420 |
| D×VC | 0.042 | 0.166 | −0.103 | 0.152 | 0.015 | 0.831 | 0.209 | 0.001 | 0.052 | 0.376 |
| D×ASB | −0.041 | 0.167 | 0.028 | 0.681 | −0.053 | 0.492 | −0.059 | 0.357 | 0.003 | 0.961 |
| D×CPB | 0.024 | 0.589 | −0.051 | 0.673 | 0.050 | 0.482 | 0.121 | 0.315 | 0.158 | 0.173 |
| Age | 0.636 | 0.000 | 0.654 | 0.000 | 0.751 | 0.000 | − | − | 0.466 | 0.005 |
| Gender | −0.002 | 0.934 | 0.038 | 0.515 | 0.008 | 0.890 | −0.004 | 0.945 | −0.039 | 0.507 |
| Household size | 0.208 | 0.001 | 0.196 | 0.075 | 0.172 | 0.187 | 0.681 | 0.000 | 0.238 | 0.110 |
| F-value (signif.) | 100.807 (0.000) | 26.254 (0.000) | 24.833 (0.000) | 23.670 (0.000) | 28.017 (0.000) | |||||
| Adj. R2 | 0.818 | 0.815 | 0.808 | 0.788 | 0.839 | |||||
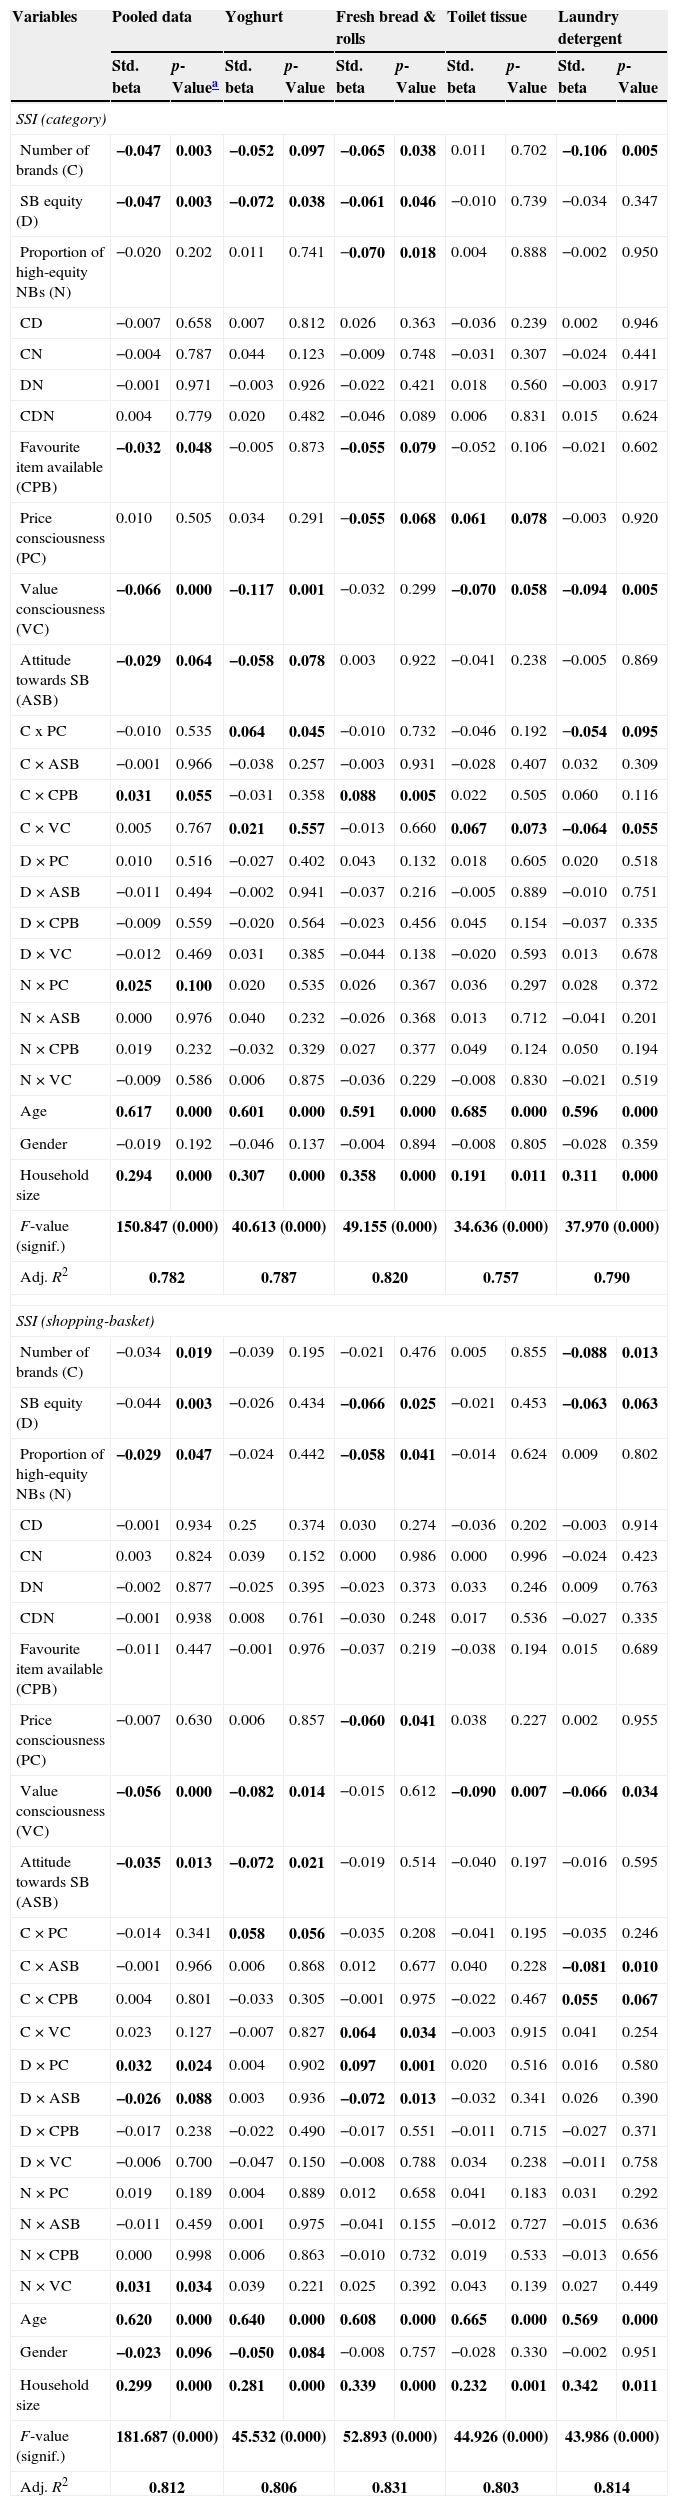
Estimation results (‘mixed’ assortments).
| Variables | Pooled data | Yoghurt | Fresh bread & rolls | Toilet tissue | Laundry detergent | |||||
|---|---|---|---|---|---|---|---|---|---|---|
| Std. beta | p-Valuea | Std. beta | p-Value | Std. beta | p-Value | Std. beta | p-Value | Std. beta | p-Value | |
| SSI (category) | ||||||||||
| Number of brands (C) | −0.047 | 0.003 | −0.052 | 0.097 | −0.065 | 0.038 | 0.011 | 0.702 | −0.106 | 0.005 |
| SB equity (D) | −0.047 | 0.003 | −0.072 | 0.038 | −0.061 | 0.046 | −0.010 | 0.739 | −0.034 | 0.347 |
| Proportion of high-equity NBs (N) | −0.020 | 0.202 | 0.011 | 0.741 | −0.070 | 0.018 | 0.004 | 0.888 | −0.002 | 0.950 |
| CD | −0.007 | 0.658 | 0.007 | 0.812 | 0.026 | 0.363 | −0.036 | 0.239 | 0.002 | 0.946 |
| CN | −0.004 | 0.787 | 0.044 | 0.123 | −0.009 | 0.748 | −0.031 | 0.307 | −0.024 | 0.441 |
| DN | −0.001 | 0.971 | −0.003 | 0.926 | −0.022 | 0.421 | 0.018 | 0.560 | −0.003 | 0.917 |
| CDN | 0.004 | 0.779 | 0.020 | 0.482 | −0.046 | 0.089 | 0.006 | 0.831 | 0.015 | 0.624 |
| Favourite item available (CPB) | −0.032 | 0.048 | −0.005 | 0.873 | −0.055 | 0.079 | −0.052 | 0.106 | −0.021 | 0.602 |
| Price consciousness (PC) | 0.010 | 0.505 | 0.034 | 0.291 | −0.055 | 0.068 | 0.061 | 0.078 | −0.003 | 0.920 |
| Value consciousness (VC) | −0.066 | 0.000 | −0.117 | 0.001 | −0.032 | 0.299 | −0.070 | 0.058 | −0.094 | 0.005 |
| Attitude towards SB (ASB) | −0.029 | 0.064 | −0.058 | 0.078 | 0.003 | 0.922 | −0.041 | 0.238 | −0.005 | 0.869 |
| C x PC | −0.010 | 0.535 | 0.064 | 0.045 | −0.010 | 0.732 | −0.046 | 0.192 | −0.054 | 0.095 |
| C×ASB | −0.001 | 0.966 | −0.038 | 0.257 | −0.003 | 0.931 | −0.028 | 0.407 | 0.032 | 0.309 |
| C×CPB | 0.031 | 0.055 | −0.031 | 0.358 | 0.088 | 0.005 | 0.022 | 0.505 | 0.060 | 0.116 |
| C×VC | 0.005 | 0.767 | 0.021 | 0.557 | −0.013 | 0.660 | 0.067 | 0.073 | −0.064 | 0.055 |
| D×PC | 0.010 | 0.516 | −0.027 | 0.402 | 0.043 | 0.132 | 0.018 | 0.605 | 0.020 | 0.518 |
| D×ASB | −0.011 | 0.494 | −0.002 | 0.941 | −0.037 | 0.216 | −0.005 | 0.889 | −0.010 | 0.751 |
| D×CPB | −0.009 | 0.559 | −0.020 | 0.564 | −0.023 | 0.456 | 0.045 | 0.154 | −0.037 | 0.335 |
| D×VC | −0.012 | 0.469 | 0.031 | 0.385 | −0.044 | 0.138 | −0.020 | 0.593 | 0.013 | 0.678 |
| N×PC | 0.025 | 0.100 | 0.020 | 0.535 | 0.026 | 0.367 | 0.036 | 0.297 | 0.028 | 0.372 |
| N×ASB | 0.000 | 0.976 | 0.040 | 0.232 | −0.026 | 0.368 | 0.013 | 0.712 | −0.041 | 0.201 |
| N×CPB | 0.019 | 0.232 | −0.032 | 0.329 | 0.027 | 0.377 | 0.049 | 0.124 | 0.050 | 0.194 |
| N×VC | −0.009 | 0.586 | 0.006 | 0.875 | −0.036 | 0.229 | −0.008 | 0.830 | −0.021 | 0.519 |
| Age | 0.617 | 0.000 | 0.601 | 0.000 | 0.591 | 0.000 | 0.685 | 0.000 | 0.596 | 0.000 |
| Gender | −0.019 | 0.192 | −0.046 | 0.137 | −0.004 | 0.894 | −0.008 | 0.805 | −0.028 | 0.359 |
| Household size | 0.294 | 0.000 | 0.307 | 0.000 | 0.358 | 0.000 | 0.191 | 0.011 | 0.311 | 0.000 |
| F-value (signif.) | 150.847 (0.000) | 40.613 (0.000) | 49.155 (0.000) | 34.636 (0.000) | 37.970 (0.000) | |||||
| Adj. R2 | 0.782 | 0.787 | 0.820 | 0.757 | 0.790 | |||||
| SSI (shopping-basket) | ||||||||||
| Number of brands (C) | −0.034 | 0.019 | −0.039 | 0.195 | −0.021 | 0.476 | 0.005 | 0.855 | −0.088 | 0.013 |
| SB equity (D) | −0.044 | 0.003 | −0.026 | 0.434 | −0.066 | 0.025 | −0.021 | 0.453 | −0.063 | 0.063 |
| Proportion of high-equity NBs (N) | −0.029 | 0.047 | −0.024 | 0.442 | −0.058 | 0.041 | −0.014 | 0.624 | 0.009 | 0.802 |
| CD | −0.001 | 0.934 | 0.25 | 0.374 | 0.030 | 0.274 | −0.036 | 0.202 | −0.003 | 0.914 |
| CN | 0.003 | 0.824 | 0.039 | 0.152 | 0.000 | 0.986 | 0.000 | 0.996 | −0.024 | 0.423 |
| DN | −0.002 | 0.877 | −0.025 | 0.395 | −0.023 | 0.373 | 0.033 | 0.246 | 0.009 | 0.763 |
| CDN | −0.001 | 0.938 | 0.008 | 0.761 | −0.030 | 0.248 | 0.017 | 0.536 | −0.027 | 0.335 |
| Favourite item available (CPB) | −0.011 | 0.447 | −0.001 | 0.976 | −0.037 | 0.219 | −0.038 | 0.194 | 0.015 | 0.689 |
| Price consciousness (PC) | −0.007 | 0.630 | 0.006 | 0.857 | −0.060 | 0.041 | 0.038 | 0.227 | 0.002 | 0.955 |
| Value consciousness (VC) | −0.056 | 0.000 | −0.082 | 0.014 | −0.015 | 0.612 | −0.090 | 0.007 | −0.066 | 0.034 |
| Attitude towards SB (ASB) | −0.035 | 0.013 | −0.072 | 0.021 | −0.019 | 0.514 | −0.040 | 0.197 | −0.016 | 0.595 |
| C×PC | −0.014 | 0.341 | 0.058 | 0.056 | −0.035 | 0.208 | −0.041 | 0.195 | −0.035 | 0.246 |
| C×ASB | −0.001 | 0.966 | 0.006 | 0.868 | 0.012 | 0.677 | 0.040 | 0.228 | −0.081 | 0.010 |
| C×CPB | 0.004 | 0.801 | −0.033 | 0.305 | −0.001 | 0.975 | −0.022 | 0.467 | 0.055 | 0.067 |
| C×VC | 0.023 | 0.127 | −0.007 | 0.827 | 0.064 | 0.034 | −0.003 | 0.915 | 0.041 | 0.254 |
| D×PC | 0.032 | 0.024 | 0.004 | 0.902 | 0.097 | 0.001 | 0.020 | 0.516 | 0.016 | 0.580 |
| D×ASB | −0.026 | 0.088 | 0.003 | 0.936 | −0.072 | 0.013 | −0.032 | 0.341 | 0.026 | 0.390 |
| D×CPB | −0.017 | 0.238 | −0.022 | 0.490 | −0.017 | 0.551 | −0.011 | 0.715 | −0.027 | 0.371 |
| D×VC | −0.006 | 0.700 | −0.047 | 0.150 | −0.008 | 0.788 | 0.034 | 0.238 | −0.011 | 0.758 |
| N×PC | 0.019 | 0.189 | 0.004 | 0.889 | 0.012 | 0.658 | 0.041 | 0.183 | 0.031 | 0.292 |
| N×ASB | −0.011 | 0.459 | 0.001 | 0.975 | −0.041 | 0.155 | −0.012 | 0.727 | −0.015 | 0.636 |
| N×CPB | 0.000 | 0.998 | 0.006 | 0.863 | −0.010 | 0.732 | 0.019 | 0.533 | −0.013 | 0.656 |
| N×VC | 0.031 | 0.034 | 0.039 | 0.221 | 0.025 | 0.392 | 0.043 | 0.139 | 0.027 | 0.449 |
| Age | 0.620 | 0.000 | 0.640 | 0.000 | 0.608 | 0.000 | 0.665 | 0.000 | 0.569 | 0.000 |
| Gender | −0.023 | 0.096 | −0.050 | 0.084 | −0.008 | 0.757 | −0.028 | 0.330 | −0.002 | 0.951 |
| Household size | 0.299 | 0.000 | 0.281 | 0.000 | 0.339 | 0.000 | 0.232 | 0.001 | 0.342 | 0.011 |
| F-value (signif.) | 181.687 (0.000) | 45.532 (0.000) | 52.893 (0.000) | 44.926 (0.000) | 43.986 (0.000) | |||||
| Adj. R2 | 0.812 | 0.806 | 0.831 | 0.803 | 0.814 | |||||
SB equity was variable for both the SB-only and mixed assortments. Table 6 shows that for SB-only assortments, SB equity did not play a significant role in store loyalty with respect to either the product category or the overall shopping basket. H2a was not supported for SB-only assortments. Nevertheless, in the yoghurt and toilet tissue categories SB equity did seem to influence store loyalty indirectly through its association with PC and VC. This result appears in both models (product category and the overall shopping basket). For the yoghurt category PC had a positive moderating influence on the relationship between SB equity and SSI (category: βD×PC=0.159, p<0.023; shopping basket: βD×PC=0.180, p<0.006), whereas for toilet tissue PC had a negative influence on the relationship between SB equity and SSI (category: βD×PC=−0.148, p<0.029; shopping basket βD×PC=−0.178, p<0.008) suggesting that for assortments consisting of one high-equity SB the SSI of price conscious consumers will be higher (yoghurt) or lower (toilet tissue) both for future purchases of the relevant category and the entire shopping basket. This finding suggests that price conscious consumers judge that high-equity SBs are over-priced in the case of yoghurts to the point where they are willing to switch to another store for future purchases of yoghurt and the rest of their shopping basket. The relationship is rather different for the toilet tissue category; price conscious consumers have a lower intention of switching to another store if the single SB comprising the assortment is a high-value one. These results suggest that for staples the maximum price consumers are willing to pay for a SB (even high-equity one) is lower than for items in low frequency purchase categories. We consider this a consequence of the intense competition over staples such as yoghurt, which results in promotions of many NBs which reduce the price to the same level as that of SBs. The situation is rather different in categories, such as toilet tissue, for which SB market share is very high (over 80% for toilet tissue in Spain); in these cases a higher SB price seems more acceptable to consumers and is actually associated with a decrease in SSI. Value consciousness had an indirect influence on the relationship between SSI and SB equity only for the toilet tissue category, the influence was positive for both models (category: βD×VC=0.206, p<0.002; shopping basket: βD×VC=0.209, p<0.001), suggesting that value conscious consumers are more likely to switch store when the assortment consists of a single SB if that SB is of high-equity.
SB equity in mixed assortments has a stronger influence on store loyalty. SB equity had a negative influence on store loyalty (category: βD=−0.047, p<0.003; shopping basket: βD=−0.044, p<0.003), indicating that when the SB in a mixed assortments is a high-equity SB store loyalty is 4.7% (category) and 4.4% (shopping basket) higher than when a mixed assortment includes a low-equity SB. Hypothesis H2a was therefore supported.
SB equity only had a direct influence on category-specific store loyalty in the yoghurt and fresh bread & rolls categories; this influence was in the same direction as in the case of shopping basket store loyalty. Yoghurt and fresh bread & rolls mixed assortments which included a high-equity SB were associated with 7.2% and 6.1% increases, respectively, in store loyalty for future purchases of products in the same category.
The effects of SB equity on shopping basket SSI were similar to those on category-specific SSI for the fresh bread & rolls category and SB equity had no direct influence on yoghurt SSI, although there was a direct influence on laundry detergent SSI (βD=−0.063; p<0.063). Finally, SB equity in some categories also had an indirect influence on store loyalty through two consumer variables, PC and VC in the case. This aspect is confirmed in overall categories and in fresh bread & rolls category. Thus, in assortments consisting of a single high-equity SB price conscious consumers will be more likely to switch store for future purchases of the shopping basket (3.2% (pooled data) and 9.7% (fresh bread & rolls), increases). VC also had an indirect influence, in the opposite direction.
These results provide some support for H2a, inclusion of a high-equity SB in a mixed assortment – in some product categories – reduced SSI; however, H2b was not supported (lack of significant influence in a mixed assortment). Our results are inconsistent with previous studies (e.g. Corstjens & Lal, 2000; Rubio, Oubiña, & Villaseñor, 2014; Rubio, Villaseñor, & Oubiña, 2014a, 2014b, 2014c) which suggested that perceived SB value played an important role in accounting for consumer identification with the brand and thence store loyalty.
Number of brandsOur results suggested that number of brands in mixed assortments is a key factor in store loyalty. Number of brands has a significant influence on category-specific store loyalty (excepting toilet tissue SSI). Thus, in large assortments (SB+9 NBs) consumers will be less likely to switch store for purchases of the category (4.7%, pooled data). In terms of product categories, such decreasing percentage range from 5.2% (yoghurt) to 10.6% (laundry detergent). Number of brands had no effect on SSI for the toilet tissue category, perhaps because the difference between large and small assortments was smaller category (3 vs. 6 NBs instead of 3 vs. 9 NBs) and consumers perceived both the ‘large’ and ‘small’ assortments as being of similar size. When shopping basket SSI rather than category-specific SSI was considered the number of brands only had an effect on switching intention in the case of the pooled data (βC=−0.034; p<0.019) and laundry detergent (βC=−0.088; p<0.013).
Taken together these results do not support hypothesis H3a, that small mixed assortments would be associated with higher store loyalty than large mixed assortments. This result is consistent with the traditional argument that larger assortments offer consumers greater utility (e.g. Bellenger & Korgaonkar, 1980; Borle et al., 2005; Cadeaux, 1999). Hypothesis H3b (higher store loyalty with respect to staples in the context of a smaller mixed assortment) was not supported either, as our data indicated that large mixed assortments of yoghurt were associated with a lower category-specific SSI. Finally, the data provided some support for hypothesis H3c, small assortments of fresh bread & rolls and laundry detergent were associated with lower category-specific SSI; however, there was only an effect on shopping basket SSI in the case of laundry detergent assortments. As well as these direct effects, number of brands had an indirect influence on store loyalty through some consumer variables, but the pattern of effects varied between product categories.13
Proportion of high-equity NBsThe proportion of high-equity NBs did not have much effect on store loyalty. Category-specific SSI was only influenced by proportion of high-equity NBs in assortments of fresh bread & rolls. The negative parameter (βN=−0.070; p<0.018) suggests that when mixed assortments included a high proportion (two-thirds) of high-equity NBs consumers were less likely to switch stores for purchases of the category (7.0%, pooled data).
There was also an indirect effect of proportion of high-equity NBs on store loyalty (pooled data); a high proportion of high-equity NBs made price conscious consumers more likely to switch to another store (βN×PC=0.025; p<0.100). This is probably because price conscious consumers believe that a high proportion of high-equity NBs indicates high prices across the whole assortment. The proportion of high-equity NBs in fresh bread & rolls assortments and pooled data had a direct influence on SSI; when assortments included a high proportion of high-equity NBs consumers were less likely to switch stores for purchases of the whole shopping basket (pooled data: βN=−0.029, p<0.047; fresh bread & rolls: βN=−0.058, p<0.041). There was also an indirect influence of proportion of high-equity of NBs on store loyalty via CPB.
Taken together these results provide some support for hypothesis H4, assortments containing a larger proportion of high-equity NBs were only associated with higher store loyalty for the pooled data and fresh bread & rolls assortments.
Consumer's favourite item available (CPB)CPB was a more important factor in SSI in the context of SB-only assortments. When the SB in an SB-only assortment was the CPB both category-specific and shopping basket SSI were lower (−16.4% and −14.2% respectively), indicating that the presence of the CPB reduced intention to switch, both for future purchases of that category and the shopping basket as a whole.
Our results suggested that presence of the CPB is a more important factor in store loyalty for low frequency purchase categories (i.e. toilet tissue and laundry detergent); e.g. the presence of the consumer's preferred laundry detergent brand reduced intention to switch for future purchases of the category and the whole shopping basket (category: βCPB=−0.308, p<0.005; shopping basket: βCPB=−0.294, p<0.010). The only effect of presence of CPB on high frequency purchase categories related to yoghurt, where presence of the CPB had a negative effect on shopping basket SSI.
Presence of CPB was less important to store loyalty in the context of mixed assortments. The only effect of presence of CPB on category-specific store loyalty related to pooled data, where presence of CPB was associated with a 3.2% decrease in SSI, and the fresh bread & rolls category, where presence of CPB was associated with a 5.5% decrease in category-specific SSI. Presence of CPB also had indirect effects on shopping basket SSI mediated by number of brands (fresh bread & rolls) or proportion of high-value NBs (pooled data). These data thus provided some support for hypothesis H5.
Price consciousness (PC)Our results suggest that PC has little effect on store loyalty. In the context of SB-only assortments PC had an indirect influence on SSI mediated by SB equity, but only in two categories (yoghurt and toilet tissue). PC with respect to yoghurt was associated higher SSI (category: βD×PC=0.159, p<0.023; shopping basket: βD×PC=0.180, p<0.006) whereas PC with respect to toilet tissue was associated with a lower SSI (category: βD×PC=−0.148, p<0.029; shopping basket βD×PC=−0.178, p<0.008). The presence of a high-equity SB in a SB-only assortment of staples increased the SSI of price conscious consumers, whereas presence of a high-equity SB in a SB-only assortment of variety enhancers reduced the SSI of price conscious consumers. In the context of mixed assortments PC only had a direct influence on the relationship between assortment composition and store loyalty in the cases of fresh bread & rolls (negative effect on both category-specific SSI and shopping basket SSI) and toilet tissue (positive effect on category-specific SSI only). PC also had indirect influence on store loyalty mediated by various assortment composition factors.
These results do not support hypothesis H6a, and PC was not a more important factor in store loyalty in the context of SB-only assortments. There was some support for hypothesis H6b, as PC had a stronger indirect effect on store loyalty in the context of the yoghurt and fresh bread & rolls categories than for the two other categories, toilet tissue and laundry detergent; however, the variability in the direction and magnitude of effects suggests that the effects of PC are more complex than we predicted in H6b.
Value consciousness (VC)The effects of VC on store loyalty varied according to assortment type. VC had limited effect in the context of SB-only assortments (an indirect influence mediated by SB equity with respect to toilet tissue), whereas in the context of mixed assortments it has a direct influence on SSI with respect to all categories except fresh bread & rolls. VC with respect to fresh bread & rolls had an indirect influence mediated by SB equity on shopping basket SSI; there was a similar indirect effect on category-specific SSI for pooled data. VC with respect to yoghurt, fresh bread & rolls and laundry detergent also had indirect effects on SSI mediated by number of brands.
VC only had a direct effect on store loyalty in the context of mixed assortments. With the exception of fresh bread & rolls, VC had a negative influence on SSI, i.e. value conscious consumers were less likely to switch if the store carried mixed assortments. VC produced a bigger increase in category-specific store loyalty for staple categories (βVC=−0.117; p<0.001); shopping basket store loyalty was increased most by VC with respect to variety enhancer categories (βVC=−0.090; p<0.007).
These results provide some support for hypothesis H7a; although VC had no effect on store loyalty in the context of SB-only assortments it had a positive effect on store loyalty in the context of mixed assortments, except for VC with respect to fresh bread & rolls. Hypothesis H7b was not supported, VC with respect to less frequent purchase categories (i.e. toilet tissue and laundry detergent) had a stronger influence on store loyalty. These results suggest that VC is a more important factor in store loyalty in the context of mixed assortments than SB-only assortments.
Attitude towards SB (ASB)As predicted, we found that ASB had more effect on store loyalty in the context of SB-only assortments; ASB was negatively associated with SSI, except in the case of yoghurt. ASB had more influence on category-specific store loyalty than for purchases of the whole shopping basket. ASB for fill-in categories (i.e. laundry detergent) had most impact on store loyalty (26.7% reduction in SSI). In the context of mixed assortments ASB (pooled data) also had a direct influence on category-specific and shopping basket SSI (category SSI: βASB=−0.029, p<0.064; shopping basket SSI: βASB=−0.035, p<0.013). ASB only plays a significant role in SSI for yoghurt (curiously the only category in which ASB was not associated with store loyalty in the context of SB-only assortments), indicating that having a positive attitude to the SB in a mixed assortment of yoghurts was associated with higher store loyalty, whereas in the context of SB-only assortments a positive ASB did not affect store loyalty. This result is consistent with Walsh and Mitchell (2010) study which also failed to find an association between ASB and consumer's SB purchase intentions. Hypothesis H8 was supported.
Conclusions and theoretical implicationsOur primary objective was to establish whether delisting all NBs in a given assortment would have a negative effect on store loyalty. Our results suggest that the presence of assortments comprising both NBs and the SB are associated with greater store loyalty, at least with respect to purchases in a particular category. This applied to all the categories we investigated except toilet tissue; in this category both large and small mixed assortments were associated with similar levels of store loyalty, probably because SB market share is particularly high in this category, and in the absence of powerful NBs consumers do not have a strong preference for mixed assortments. In the other categories SB market share (yoghurt: 55.98%; fresh bread & rolls: 63.6%; laundry detergent: 44.0%)14 was also an important factor in the impact on store loyalty of having a mixed assortment; however, in these product categories there are several powerful NBs (e.g. Danone, Bimbo, Ariel), which may explain the stronger consumer preference for mixed assortments. Given that SB market share in many FMCG categories in Spain is very similar to market share in the categories used in this paper our results can generalised to the majority of categories available from Spanish retailers.
Our results are consistent with previous studies in showing a consumer preference for ‘complete’ (i.e. mixed) assortments (Martínez & Montaner, 2008; Pepe et al., 2012), at least in terms of purchases in a given category. Only in the laundry detergent category was the presence of an SB-only assortment associated with a higher intention to switch to another store for purchases of the whole shopping basket. These results suggest that failure to offer any NB in a given product assortment might affect purchasing behaviour for that category but is unlikely to influence purchasing in other categories. This result probably reflects the limited role each individual category plays in the shopping basket; the fact that delisting NBs has a negative effect on category purchases leads us to believe that if a retailer delists NBs in many categories, store loyalty for the shopping basket is likely to be negatively affected.
This is the first study to look at the effects on purchasing behaviour of presenting assortments containing no NBs and therefore makes a contribution to the marketing literature.
Our second objective was to analyse how assortment composition affected store loyalty. We also analysed the effect of some consumer attitude variables.
The first factor we analysed was SB equity. Our results suggest that SB equity is more important to store loyalty in the context of mixed assortments; in mixed assortments SB equity had a direct effect on store loyalty whereas in SB-only assortments SB equity had indirect effects on store loyalty mediated by PC and VC, in two product categories. This result leads us to suggest a refinement of the proposition, put forward by many authors (e.g. Gómez et al., 2012; González-Benito & Martos-Partal, 2012; Rubio, Oubiña, et al., 2014; Rubio, Villaseñor, & Oubiña, 2014a, 2014b), that SB equity has a positive effect on SB loyalty and thence store loyalty. We suggest that SB only affects loyalty in the context of assortments in which the SB competes against NBs; in these circumstances the retailer will benefit from possessing an own brand which is perceived as high-value, as it will intensify consumers’ SB loyalty. In the context of SB-only assortments however SB value seems to have less effect on store loyalty, presumably because consumers cannot compare brand values.
In the context of a SB-only assortment the most important factor in store loyalty is the presence or absence of the CPB, i.e. whether the retailer's own brand is the CPB. It is not the probability of the consumer switching to another store for future purchases of a given category is slightly over 30%. This result confirms that availability of the consumer's favourite item is an important factor in the attractiveness of an assortment (Boatwright & Nunes, 2001; Oppewal & Koelemeijer, 2005), particularly in the case of low frequency purchase categories (i.e. variety enhancers and fill-ins).
In the context of mixed assortments presence or absence of the CPB is a much less important factor in store loyalty, probably because mixed assortments offer greater variety and the consumer is therefore able to find a satisfactory alternative to his or her favourite. In the context of mixed assortments number of brands is one of the most important influences on store loyalty. For all product categories – except toilet tissue – assortments containing a larger number of NBs (nine vs. three) reduce the probability of the consumer switching to another store for future purchases in that category, and sometimes also for future purchases of the whole shopping basket. This result provides evidence for an argument made by several authors, namely that larger assortments are more attractive to consumers (Amine & Cadenat, 2003) because they are perceived as having greater variety (Chernev, 2006). The attractiveness of a larger assortment appears to be common for all product categories; only for toilet tissue was number of brands not a factor in store loyalty. Our results are inconsistent with suggestions by Borle et al. (2005) and Dhar et al. (2001) that the effect of number of brands on purchasing behaviour would depend on purchase frequency.
The presence of a high number of NBs seems to make an assortment more attractive to consumers regardless of the proportion which is high-equity. Unlike previous studies (Geyskens et al., 2010; Wiebach & Hildebrandt, 2012) we found that the proportion of high-equity brands had only a marginal influence on store loyalty. Our findings are how consistent with the argument that the presence of a large number of NBs results in the perception that the assortment has greater variety and is thus more attractive (e.g. Hoch, Bradlow, & Wansink, 2002; van Herpen & Pieters, 2002).
The effects of the consumer variables we investigated varied according to the assortment presented. In the context of SB-only assortments the most important consumer variable was ASB; except with respect to yoghurt SBs a more positive attitude to SB was associated with a higher probability of continuing to shop at the store. This result confirms that attitude is an important influence on intention to buy a SB; many authors (e.g. Martos-Partal & González-Benito, 2009; Miquel et al., 2014) have argued that ASB is even more important to purchasing decisions than other factors (e.g. a lower price) which are traditionally considered the critical factor in purchase of SBs. The limited relevance of PC to store loyalty in the context of SB-only assortments supports the suggestion by several authors (e.g. Gómez et al., 2011) that regular SB consumers buy the SB not because of its low price, but because of their positive attitude towards the SB. One of the many factors15 associated with ASB is perceived value for money; this is a more important factor in the purchase decisions of value conscious consumers (Gómez & Rubio, 2010). Our results on the effect of SB equity on store loyalty in the context of SB-only assortments did not support this argument; however, they are consistent with the argument that SB equity has only a limited effect on store loyalty in the context of SB-only assortments. It is likely that the absence of NB alternatives makes it more difficult for value conscious consumers to assess the value for money offered by the SB. This hypothesis is consistent with the much greater influence of VC on store loyalty in the context of mixed assortments, which allow consumers to evaluate several alternatives in the choice set. In the context of mixed assortments we did find the association between value consciousness and store loyalty proposed by some authors (e.g. Rubio, Oubiña, et al., 2014; Rubio, Villaseñor, & Oubiña, 2014a, 2014b). PC was not an important influence on store loyalty, with some exceptions, such as fresh bread & rolls.
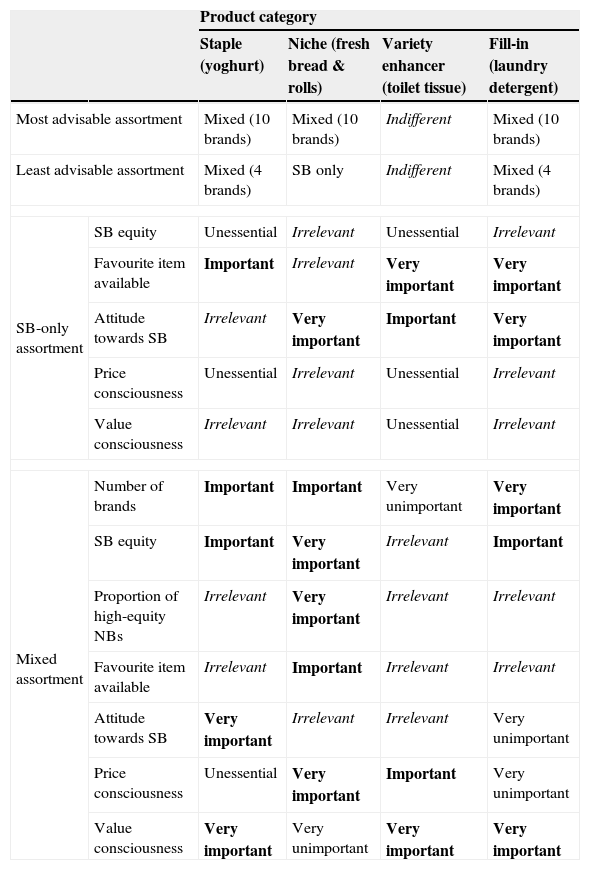
Managerial implicationsTable 8 summarises, by category, our main recommendations for retailers with respect to assortment composition and the impact that assortment composition and consumer variables should have on assortment strategy.
Suggested assortments for the retailer. Role of assortment composition and consumer variables on assortment strategy.
| Product category | |||||
|---|---|---|---|---|---|
| Staple (yoghurt) | Niche (fresh bread & rolls) | Variety enhancer (toilet tissue) | Fill-in (laundry detergent) | ||
| Most advisable assortment | Mixed (10 brands) | Mixed (10 brands) | Indifferent | Mixed (10 brands) | |
| Least advisable assortment | Mixed (4 brands) | SB only | Indifferent | Mixed (4 brands) | |
| SB-only assortment | SB equity | Unessential | Irrelevant | Unessential | Irrelevant |
| Favourite item available | Important | Irrelevant | Very important | Very important | |
| Attitude towards SB | Irrelevant | Very important | Important | Very important | |
| Price consciousness | Unessential | Irrelevant | Unessential | Irrelevant | |
| Value consciousness | Irrelevant | Irrelevant | Unessential | Irrelevant | |
| Mixed assortment | Number of brands | Important | Important | Very unimportant | Very important |
| SB equity | Important | Very important | Irrelevant | Important | |
| Proportion of high-equity NBs | Irrelevant | Very important | Irrelevant | Irrelevant | |
| Favourite item available | Irrelevant | Important | Irrelevant | Irrelevant | |
| Attitude towards SB | Very important | Irrelevant | Irrelevant | Very unimportant | |
| Price consciousness | Unessential | Very important | Important | Very unimportant | |
| Value consciousness | Very important | Very unimportant | Very important | Very important | |
Our first recommendation is clear: marketing strategy and store format permitting,16 retailers should offer assortments containing a high number of NBs as well as the SB; because this type of assortment was always associated with greatest store loyalty for purchases of a given category and, for fill-in categories, with store loyalty for the entire shopping basket. Although large assortments are the most advantageous from the retailer's perspective, SB-only assortments are not always the least desirable option; for staple and fill-in categories SB-only assortments were associated with higher store loyalty than small mixed assortments. For these two groups of categories therefore, we would advise retailers to delist all NBs if they are not able to offer a large mixed assortment and instead offer an SB-only assortment.
For niche categories, mixed assortments – even small ones – are the best option for retailers; SB-only assortments were associated with the lowest store loyalty. Finally, in variety enhancer categories store loyalty does not seem to be affected by assortment composition.
A retailer who chooses to offer mixed assortments should pay special attention to the following two factors: (1) the number of NBs and (2) SB equity. We advise retailers to include several NBs in the assortment regardless of category; failure to do so increases the probability that consumers will switch to another store for their future purchases. How many NBs should the retailer offer to secure consumer loyalty to the store? On the basis of our results we advise retailers to include more than six NBs, because in which the ‘large’ assortment comprised only six NBs rather than nine (toilet tissue) was the only category for which offering a large assortment was not associated with greater store loyalty. It is not necessary for the NBs to be of high-equity, because proportion of high-equity NBs did not affect store loyalty except in the case of high frequency purchase, low penetration categories, when store loyalty was greater if the assortment contained at least two-thirds high-equity NBs. The second factor the retailer should consider when designing mixed assortments is SB equity; if the retailer has a high-equity SB in assortments of niches, and to a lesser extent assortments of staples and fill-ins, there is a higher probability that the consumer will continue to shop at the store. Presence of a high-equity SB in a mixed assortment of variety enhancers does not affect store loyalty.
We advise retailers, therefore, to strengthen the value of their own brands regardless of whether they offer a mixed or SB-only assortment for a particular product, because in many product categories a strong SB will have a positive effect on store loyalty. To strengthen the value of a SB retailers should look for ways of increasing the perceived quality of the brand, for example by improving product quality, packaging or labelling or innovating with the SB. We advise retailers to pay special attention to selecting the manufacturers of their SBs,17 to ensure that the quality of the SB is comparable to that of competing NBs. A high-quality SB is likely to be perceived as offering good value for money, as it will still enjoy a price advantage over the competing NBs.
Given that value consciousness with respect to mixed assortments is an important factor in store loyalty, focusing on improving SB quality and thus perceived SB value seems likely to be a successful strategy; it is essential however that as part of the strategy the retailer pursues a marketing and communication strategy which emphasises the SB's value. We therefore advise that retailers should invest more in advertising the SB to strengthen the brand rather than relying solely on in-store promotions. Retailers will also benefit from reducing the shelf-space devoted to the SB in order to increase the shelf devoted to NBs, which are often more profitable and generate more traffic. Strengthening the SB will allow the retailer to increase the price of the SB and thus its profitability. Retailers should not be concerned about increasing SB price as this will have a positive impact on perception of the quality of the SB and thence on store choice. Our results suggest that PC does not affect SSI.
Retailers should be aware that in the context of SB-only assortments SB value has very little effect on store loyalty; however they should be more concerned to ensure that the SB is the CPB, given that for fill-in categories where a single SB is offered there is a 30.80% increase in SSI if the SB is not the CPB. If the SB is to be the CPB then consumers must have a positive ASB, as our results demonstrated. ASB will improve as the associations evoked by the SB, e.g. retailer image, SB personality or emotional benefits, improve. As in mixed assortments the most important thing a retailer can do is to strengthen SB awareness and improve the image of the SB, so that consumers’ identification with the brand and trust in it, and thence in the retailer, will increase. Strengthening SB awareness will be seen by consumers as a guarantee of quality and reflection of a reduction in the risks associated with SB purchase. Communication about the SB is once again critical to improving consumer knowledge about the SB and attitude to it. These factors are particularly important in the context of SB-only assortments as delisting all NBs deprives consumers of the opportunity to choose an alternative.
Limitations and further researchThe limitations of this research should be considered when analysing and interpreting the results. First, we investigated only four product categories, including toilet tissue, a category for which the market is atypical, as SBs have a market share of more than 80% and there are very few NBs. Future research is required to establish whether the category differences we observed generalise to other product categories. Second, the experimental method represents a simplification of the real world shopping context. Although market research increasingly uses experiments to investigate consumer purchasing behaviour such experiments can only consider a limited number of factors; store loyalty may be affected by many factors in addition to the assortment composition and consumer attitude variables we manipulated in this study, for example store location and physical ambience. Visual (e.g. colour, lighting), auditory (e.g. background music) and other sensory (e.g. smell, taste or density) environment factors have been discussed as potential influences on purchasing behaviour (see Gómez & García, 2012 for a full description of these factors). The goal of this study was to analyse the effects of assortment composition variables on store loyalty; however, it would also be interesting to investigate the effects of other ‘sensorial marketing’ factors in future research as they seem to influence consumer purchasing behaviour. Third, we only looked at one dependent variable (store switching intentions) to assess consumers’ responses to different assortment compositions. We estimated separate regression models for SB-only and mixed assortments; an alternative design would estimate a single regression model to encompass both assortment types to enable the joint analysis of various assortment factors.18 Fourth, any single category in a shopping basket has limited importance, but we looked at the effects on shopping basket SSI of changes to the assortment of only one product category; it is likely that changes to individual category assortments have a summative effect on shopping basket SSI so our method of estimating effect on shopping basket SSI is clearly of limited use. In future research it would be interesting to look at effects of assortment composition on other dependent variables (e.g. intention to buy SB, store image); similarly previous research has suggested that other factors (e.g. perceived risk, loyalty, perceived quality, etc.) do influence consumer's intention to buy SB or NBs, and this is another area for future research.
FundingThe authors would like to acknowledge the financial support from the Ramón Areces Foundation (Spain).
Conflict of interestThe authors declare no conflict of interest.
(5-point Likert scale, where 1=I will definitely keep buying at this store; 5=I will definitely do my shopping at another store)
According to the assortment displayed, and supposing this was your regular store, please rate the statements below:
- •
The likelihood of switching to another store for future purchases of (category) (SSI category)
- •
The likelihood of switching to another store for future purchases of all those products comprising my shopping-basket (SSI shopping-basket)
(7-point Likert scale, where 1=Strongly disagree; 7=Strongly agree)
- •
I am not willing to go to extra effort to find lower prices (reverse-coded)
- •
I will shop at more than one store to take advantage of low prices
- •
The time it takes to find low prices is usually not worth the effort (reverse-coded)
(7-point Likert scale, where 1=Strongly disagree; 7=Strongly agree)
- •
I am very concerned about low prices, but I am equally concerned about product quality
- •
When shopping, I compare the prices of different brands to be sure I get the best value for money
- •
I generally shop around for lower prices on products, but they still must meet quality requirements before I buy them
- •
I always check prices at the store to be sure I get the best value for the money I spend
(7-point Likert scale, where 1=Strongly disagree; 7=Strongly agree)
- •
Buying store brands makes me feel good
- •
I love it when store brands are available for the product categories I purchase
- •
For most product categories, the best buy is usually the store brand
- •
In general, store brands are poor-quality products
- •
Considering value for money, I prefer store brands to national brands
- •
When I buy a store brand, I always feel that I am getting a good deal
A recent paper (Ter Braak, Deleersnyder, Geyskens, & Dekimpe, 2013) compared two of Europe's leading discounters: the German chain Aldi, a hard discounter, and Mercadona, a soft discounter.
At least in supermarkets and hypermarkets. Consumers assume that discounters – particularly hard discounters – will not offer any NB in most product categories. This paper considers only retail formats in which offering both type of brands is the usual practice.
A distinction should be made between ‘temporary non-availability’, e.g. an out-of-stock situation, and ‘permanent non-availability’; brand delisting falls into the latter category.
See Chernev (2011) for a complete review of factors influencing choice among different assortment types.
Number of brands was only a variable in mixed assortments as SB-only assortments always consisted of one brand.
Martínez and Jiménez (2009) argued that price consciousness, along with sensitivity to the brand, influenced SB penetration.
More details about the composition of the panel are available from the corresponding author on request.
We based our definitions of ‘small’ and ‘large’ assortment on previous experiments (e.g. Chernev, 2003, 2006) in which ‘large’ assortments were typically four, five or even, six times the size of ‘small’ assortments. We used a smaller difference ratio (three; ‘small’ assortments included three NBs and ‘large’ assortments included nine NBs). The previous experiments considered individual ítems (many of them belonging to the same brand) whereas we considered individual brands.
More information about the selection procedure for high- and low-equity SBs is available from the corresponding author on request.
To provide appropriate proportions of high- and low-equity NBs we selected twelve NBs per category (except toilet tissue, for which we selected eight NBs), six high-equity and six low-equity.
In the toilet tissue category the large assortments (i.e. assortments #7, #8, #9 and #10) contained seven brands rather than ten (SB+6 NBs, rather than SB+9 NBs) owing to the structure of the Spanish toilet tissue market. According to IRI SBs have about 83% of the market. The NB with the largest market share is Scottex (11% market share), followed by Colhogar (2.5%), Foxy (1.5%) and Renova (1.3%). There are only four other NBs in the market (all with a market share of less than 0.4%). Given this market situation, a ten-brand assortment would not have been a realistic representation of the variety available on retailers’ shelves.
Appendix A.2 shows all items used in this research.
These results are not discussed as they were not the subject of any specific hypotheses; further details are available from the corresponding author on request.
Figures provided by IRI Worldwide.
These factors include store image (Beristain & Villalba, 2011), perceived similarity in SB and NB quality (González, Diaz, & Trespalacios, 2006), selection of a highly reputable manufacturer for the SB (Levy & Gendel-Guterman, 2012), greater innovation (Abril & Martos-Partal, 2013), an increase in SB marketing, communication and promotion budget (Rubio, Oubiña, et al., 2014) and good positioning of SB on the retailer's shelves (Rubio, Villaseñor, & Oubiña, 2014c).
Our design focused on hypermarket and supermarket formats and all recommendations to retailers should be considered in the light of the general characteristics of these two store formats: assortment breadth and depth, selling surface, etc. Marketing strategy and available selling surface in other formats such as discounters may preclude adoption of some recommendations.

www.publicationethics.org.