In recent decades, publications of sustainability reports from a variety of organisations all over the world have significantly increased. Most of these companies are large and belong to the secondary and tertiary sector. This paper uses stakeholder theory to attempt to contribute to the development of sustainability reports specifically related to farming operations. This paper also uses the Delphi methodology to collect information from different stakeholders that, in turn, represent different groups of agents within the organisations involved. The conclusions indicate a difference in the assessments from the three subgroups of experts that comprise the panel.
En las últimas décadas, la divulgación de informes de sostenibilidad ha aumentado significativamente en todo el mundo. La mayoría de organizaciones que publican estas memorias son grandes empresas y pertenecen al sector secundario y terciario. Este trabajo, basándose en la teoría de los stakeholders, intenta contribuir a la elaboración de informes de sostenibilidad específicamente diseñados para explotaciones agropecuarias. Utiliza la metodología de Delphi para recabar información de los diferentes actores que representan a su vez diversos grupos de agentes en el seno de las organizaciones involucradas. Las conclusiones indican una diferencia en las evaluaciones de los 3 subgrupos de expertos que conforman el panel.
In recent years, the number of companies that issued reports on social and environmental performance has significantly increased (Boiral, 2013; Deegan, Ranking, & Tobin, 2002; Gray, Kouhy, & Lavers, 1995; KPMG, 2008). Such social and environmental information is sometimes mandatorily included in annual reports (Blacconiere & Patten, 1994; Criado, Fernández, Husillos, & Larrinaga, 2008; Freedman & Patten, 2004; Larrinaga, Moneva, Llena, Carrasco, & Correa, 2002; Llena, Moneva, & Hernández, 2007; Shameek & Cohen, 1997) or may be voluntarily provided as a standalone social and environmental report (Alvarez, 2010; Gray et al., 1995; Patten and Crampton, 2004; Unerman, 2000). Perhaps one of the main initiatives in this field is the report by GRI on sustainability guidelines (KPMG, 2008). Although organisations in the secondary and tertiary sectors of the economy have experienced significant progress, the primary sector (except for quarrying) has developed to a lesser extent. In a similar context, Correa and Moneva (2011) considered that all types of organisations and institutions should also be explored, in order to develop more sustainable and responsible patterns of behaviour.
This paper seeks to contribute to the possibility of improving sustainability reports for farming operations based on the GRI model, specifically in Guipúzcoa (one of the three provinces in the Basque Country in Spain), by considering the issues that constitute material for the stakeholders involved in the performance of this type of business.
The paper is structured in five sections. The second section provides the theoretical framework for, and applies the theory used in, this study, the third section describes the methodology and the fourth section sets out the results of the study. Finally, the fifth section contains the conclusions and implications of the study.
Theoretical frameworkStakeholder theory may be viewed from three dimensions (Donaldson & Preston, 1995; Swanson, 1999): empirical or descriptive (Jones, 1995), instrumental (Altman, 1997; Svendsen & Wheeler, 2003) and regulatory. Jones (1995) listed the three dimensions by formulating three questions that summarised their characteristics: “What happens?”, “What would happen if?” and “What should happen?” This study considers the third dimension of the theory, on what should be, which considers the opinions of different stakeholders involved in the performance of these companies.
In that context, we seek to respond to Gray‘s (2002) call for normative research in social and environmental accounting and to the process of making accounting a useful tool for disclosing this type of company information (Parker, 2005). Sustainability accounting is simultaneously a process through which information flows are organised and provided for management decision making and a product obtained by internal and external parties with an interest in corporate sustainability information (Burrit & Schaltegger, 2010). Therefore, sustainability accounting consists of elements of an ‘outside-in’ and an ‘inside-out’ approach (Schaltegger & Wagner, 2006).
This paper is based on an ‘outside-in’ approach, which includes stakeholder dialogues, screens publicly discussed issues and reports, and informs on the corporate contribution to these issues. Involving stakeholders in the reporting process is often considered another means by which to improve the quality and transparency of the disclosed information (Boiral, 2013; Unerman, Bebbington, & O’Dwyer, 2007). Thus, this paper defines measurement and management activities based on these issues for consumption by external parties, such as rating agencies, media groups and other stakeholders (Schaltegger & Wagner, 2006). The focus of this paper is on fulfilling stakeholder expectations and meeting the information requirements of external parties (Burrit & Schaltegger, 2010).
Taking in to account this ‘outside-in’ approach, the aim of this paper, based on the normative dimension on the Stakeholder theory, is to determine what kind of sustainable information should be disclosed by the sustainable reporting of farming operations in Guipuzcoa.
In order to develop this, our principal objective, reporting-driven sustainability accounting development process can be started on the basis of a stakeholder- or shareholder-orientated view or a multiple stakeholder engagement process, or by referring to cultural expectations (Burrit & Schaltegger, 2010). Similarly, stakeholder theory states that for social and environmental information to be of material value to users, it should consider the interests of stakeholders that affect or are affected by a company's performance (Freeman, 1984). By doing so, the relevant stakeholders are identified and their prerequisite for the development of an appropriate and mindful set of sustainability indicators are understood (Azapagic, 2004).
The literature on the subject classifies these groups or individuals into external and internal (Verdeyen, Put, & Buggenhout, 2004), contractual or public (Charkham, 1994), voluntary or involuntary (Clarkson, 1995), primary and secondary (Clarkson, 1995; Freeman, 1984) and social primaries, non-social primaries, social secondaries, and non-social secondaries (Wheeler and Sillanpaa, 1998). This research uses the classification of primary and secondary stakeholders (Clarkson, 1995; Freeman, 1984).
Based on this classification, our next step is to choose those stakeholders who represent the different agents who on the one hand could be affected by the hypothetical sustainability report and on the other hand agents who although not directly affected by such a report, are interested in this kind of sustainable information.
One consideration we should pay close attention to involves the characteristics of these kinds of businesses. In Guipuzcoa the typical farm is run by the owner and her/his family. Only in very unusual cases do they have non-family workers.1 To help those farms be more competitive, the Basque Government (with the collaboration of local governments, in this case Guipuzcoa’ local government) have developed several organisations with the aim of helping farmers manage their farms. These institutional agents are referred to in this paper as management companies and consultants and in many cases are involved and help to manage environmental policies that The Basque County wants to develop in the farming sector (Basque Government, 2002).
The first Stakeholder group is primary (or key) agents. Key agents have interests that are directly related to the actions that the company carries out. These individuals and groups are considered primary agents because of their direct effect on the organisation of the farms. Examples of this kind of agent group include (Clarkson, 1995; Freeman, 1984):
- 1.
Shareholders, employees: in our study, based on the characteristic of farms in Gipuzkoa we chose two people who represent the producer collective, who are commensurately both owners and workers
- 2.
Customers and Suppliers, in our study we chose two agents, concretely a cooperative that used to buy the farms’ produce.
- 3.
And residents of the communities in which the company operates. In this case based on the interest of local government in our work and taking into consideration that this kind of dialogue necessitates a person previously trained in sustainability to be able to discuss the issues at hand professionally, we have chosen as a subject a representative local government representative.
The second group of social agents, with a less direct relationship but with potentially significant influence (Maignan & Ferrel, 2000), includes other pressure groups, such as NGOs, Unions, academics and other types of economic or social networks. This group of secondary stakeholders does not usually engage in direct transactions with the company and is not usually essential to its survival.
- 1.
NGO and Unions: due to the characteristic of Basque farms, the Unions are quite unique in this area. The Unions area of interest is more closely related to defence of the sectors involved rather than workers’ rights (as previously mentioned the majority of the workers are farm owners and their family members). Unions also they have an close relationship with ecological movements. We attempted to contact a member of a local environmental NGO but we were unable to procure his participation and we therefore chose a representative of a Union as the representative of this stakeholder position.
- 2.
Academics: Taking in to account the importance of technical knowledge, we chose two academics currently researching in this subject area.
Taking into account this classification, the next chapter presents the Delphi method to help understand the opinions of and the level of agreement about stakeholders to analyse the possibilities and problems with implementing a sustainability report for farming operations based on the GRI model.
MethodologyThe Delphi method may be characterised as a method to structure a group communication process that is effective in allowing a group of individuals, as a whole, to address a complex problem. To accomplish this structured communication, the method provides feedback on the individual contributions of information and knowledge, assessment of the group judgement or view, opportunity for individuals to revise views and a degree of anonymity of individual responses (Linstone & Turoff, 2002).
Delphi is appropriate for situations requiring the establishment of opinions of value or a forecast, in which models are not practical or possible given a lack of appropriate technical/economic/historical data and in which a series of personal opinions needs to be established (Rowe & Wright, 1999). In this context, four key aspects are needed to define a Delphi process: anonymity, interaction, controlled feedback and statistical aggregation of expert response (Rowe & Wright, 1999).
Although a traditional survey among the different agents could have been conducted to achieve the objective of this paper, the Delphi method was considered because it is rigorous and can overcome a number of problems related to surveys. Okoli and Pawlowski (2004) compared the Delphi method with the traditional survey and noted the following advantages: a Delphi study answers the research questions more appropriately than do the responses from a single group or expert; the Delphi method requires a modestly sized group, making it more practical; Delphi is flexible and enables a greater wealth of data to be collected, resulting in a better understanding; and the method can achieve the dual purpose of seeking the opinions of experts and ranking answers based on their importance.
A key advantage of the Delphi approach is that it avoids direct confrontation with the experts (Sánchez, Caminade, & Escobar, 1999). Typically, the individuals in the groups surveyed are experts appointed by a group coordinator who, in turn, prepares the questionnaire to answer the research question. The questionnaire is sent to the different experts on the panel, who establish a preference ranking by anonymously answering a series of questions. A round represents each time that the group of experts answered the questionnaire, and the number of rounds is variable (Novakowski & Wellar, 2008). Although the number of rounds can be performed as many times as required, practice revealed that the greatest convergence of the answers occurs between Rounds 1 and 2 (Linstone & Turoff, 2002; Novakowski & Wellar, 2008).
The researcher in charge of the analysis is called the ‘monitor’. The role of the monitor is to conduct the entire research process. The monitor starts by designing the questionnaire, and then selects the experts, interacts with them, analyses the results and writes the final report.
The previous literature on financial reporting that used the Delphi method did so to test, for example, the perception of information on intangibles (Cañibano, 2002) and institutional enforcement (Cañibano & Alberto, 2008). The aim of a study may be to obtain ‘maximum consensus’ about a specific topic (MacCarthy and Attirawong, 2003) or ‘stability’ in the experts’ answers (Chaffin & Talley, 1980; Dajani, Sincoff, & Talley, 1979; Regier, 1986; Sharma & Gupta, 1993). Stability is a measure of the extent and degree to which experts select the same responses between successive rounds. We argue that obtaining consensus versus stability depends on the objective of the research.
Although the Delphi method has been used in diverse studies, most such studies can be classified into one of the following categories (Novakowski & Wellar, 2008):
- 1.
Regulatory Delphi: Obtaining a consensus about a preferred future;
- 2.
Forecasting Delphi: Making future predictions; or
- 3.
Political Delphi: Exploring a matter of interest or with political consequences.
As previously established, the purpose of this study and the dimension of the application of the theory are regulatory; therefore, because this work falls within the first Delphi group, we opted to use the structure developed by Novakowski and Wellar (2008), who establish the following steps for its correct development.
Step 1: Reviewing the literature.
The literature review primarily focused on two areas: stakeholder theory and its effect on sustainability reports, together with the use of the Delphi method.
Step 2: Preparing the questionnaire.
Two options exist to prepare a sustainable indicator report. According to the literature on the subject, the first option is to develop our own indicators for the proposed model (Alfsen and Bye, 1990; Alfsen and Greaker, 2007; Bills and Gross, 2005; Oliver, 2002; Veleva, Bailey, & Jurczyk, 2001; Veleva, Hart, Greiner, & Crumbley, 2001; Veleva, Hart, Greiner, & Crumbley, 2003; Wiggering et al., 2006) or use generally accepted indicators such as the GRI indicator (Azapagic and Stichnothe, 2009; Azapagic, 2004; Mudd, 2008; Vergragt and Szejnwald, 2007). We opted for the second option of specifically using the GRI indicators because of the cost/profit criterion related to the first option. Moreover, given the complications associated with developing one's own indicators, a major concern was the establishment of a theoretical framework for such a set of indicators and seeking to propose only a collection of more relevant individual indicators (Alfsen and Greaker, 2007). To design the questionnaire, we included all core indicators proposed by the G3 model (excluding the additional indicators). The GRI typifies the outside-in approach and offers guidelines for supplying externally published corporate sustainability reports (Lamberton, 2005). Moreover, we considered the importance and global recognition of the GRI2 (KPMG, 2008), the increase in the use of the GRI in most countries3 and the fact that the GRI bases its information on a conceptual framework that allows the development of reports for a specific sector and a specific industry (GRI, 2002). Finally, the GRI has developed different sector models appropriate to its own characteristics (for example, financial, mining, airports, construction, oil); however, we detected a lack of proposals for farming operations and this paper seeks to make a contribution in this context.
Once the GRI indicators were selected, we considered the appropriateness of providing the indicators along with a brief description of their meaning and, in some cases, examples from reports published by different companies.
Likewise, we considered that the indicators set by the GRI are developed to satisfy the needs of large social agents (the majority that publish this type of report comply with this characteristic). Therefore, we deemed that the list of proposed indicators had to be reduced. To comply with this target, in addition to assessing the indicator (the other objective was to establish a ranking), the expert had the opportunity to eliminate the indicators that he did not consider appropriate for this type of organisation.
Step 3: Identifying the Delphi panel participants.
The Delphi method does not aim to analyse a statistically representative sample of a target population; rather, it provides a group decision mechanism that requires qualified experts with in-depth knowledge of the target of the study (Okoli and Pawlowski, 2004).
This paper establishes two of the three classes of experts recognised by the available literature: experts in the area and the agents involved (Landeta, 1999; Linstone & Turoff, 2002). Furthermore, to be consistent with the theory adopted, and using the Clarkson (1995) and Freeman (1984) typology, we distinguished between two groups of experts and a group of involved agents, resulting in three subgroups. Subgroup 1 was comprised of farm experts in reality, including two senior partners at companies devoted to helping management4 and one consultant, who were also primary agents. In subgroup 2, the agents involved were primary agents – representatives of the producer collective, trade unions, customers, local authorities and civil organisations.5 Finally, subgroup 3 was comprised of experts on sustainability reports, including two academics who, in turn, comprised a group of secondary agents. We believe that if we analysed the results of all participants as a single group, the meaning of the extreme value responses would have been lost (Okoli and Pawlowski, 2004). Thus, we consider that the results obtained are more representative of the interests of the different groups.
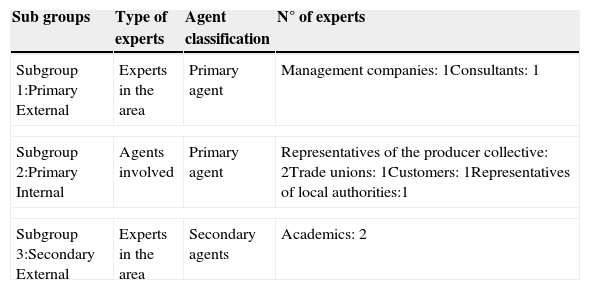
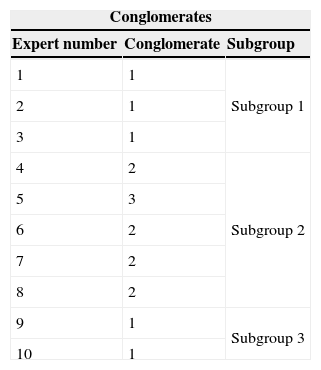
Existing studies on the subject did not agree of the optimum number of panel experts. Although various attempts were made to establish such a number through scientific means, the conclusions were not significant (Galanc & Mikus, 1986). Despite this lack of clear criteria, the majority of the opinions from the literature agreed that the number must be between 10 and 8 experts per panel (Okoli and Pawlowski, 2004). More specifically, the literature advised a number between 8 and 12 experts when using the Delphi method for regulatory purposes. Novakowski and Wellar (2008) and Richey, Mar, and Horner (1985) suggested a similar number of experts and believed that a small panel is sufficient when developing appropriate opinions through consensus. This study opted to establish a panel of 10 experts divided into three subgroups (see Table 1). This classification used two criteria: the agent classification and the type of expert based on Delphi typology (Landeta, 1999; Linstone & Turoff, 2002). Identifying relevant stakeholders and understanding their interests is a prerequisite to the development of an appropriate and meaningful set of indicators (Azapagic, 2004).
Description of the different participants on the panel of experts classified according to type of expert, type of agent classification using the Clarkson (1995) and Freeman (1984) typology and their professional characteristics.
| Sub groups | Type of experts | Agent classification | N° of experts |
|---|---|---|---|
| Subgroup 1:Primary External | Experts in the area | Primary agent | Management companies: 1Consultants: 1 |
| Subgroup 2:Primary Internal | Agents involved | Primary agent | Representatives of the producer collective: 2Trade unions: 1Customers: 1Representatives of local authorities:1 |
| Subgroup 3:Secondary External | Experts in the area | Secondary agents | Academics: 2 |
Step 4: Conducting the first round.
In the first round, we sent the different experts a questionnaire consisting of the indicators taken from the different sections established by the GRI. Specifically, we chose those from the G3 version6 as core indicators (Annex). The questionnaire asked the experts to assess the importance of the inclusion of these indicators in a hypothetical sustainability report for the sector. Therefore, we established a scale of 0–5, where the rating 0 meant eliminating the indicator from the proposed report and 5 meant that the indicator was essential to the report. The questionnaire had two objectives: to eliminate the indicators that the experts thought should not be included in the report and to establish a rating for the information they considered most important when including it in the report, to then determine a ranking of indicators.
Step 5: Incorporating the feedback process.
Once the results were obtained, the responses were given to the different panel members together with the different statistical indicators, including mean, mode, typical deviation and percentages.
During the feedback process, the different experts told us that they were unclear about the meaning of the 0 score: whether the information gathered by the indicator was not essential for this type of business or, if essential, whether obtaining such information from these types of organisations was difficult.
Step 6: Conducting the second round.
The first response showed that subgroup 2 (agents involved) had very different responses. The index of indicators to be eliminated for this subgroup was much higher than in the other two subgroups (which had similar results). In the feedback process received, some of the components of this subgroup argued that for the companies to gather much of the information required by the GRI report was difficult.
Therefore, the second round focused on the other two groups of experts (subgroups 1 and 3). When designing the second questionnaire, the following two aspects were taking into account.
We added information based on one of the feedback points received. We established in the document that the value 0 meant eliminating the indicator for two reasons: that it was not relevant information for these types of farming operations or that, if the information was relevant, providing the required information was too expensive and difficult for these small companies.
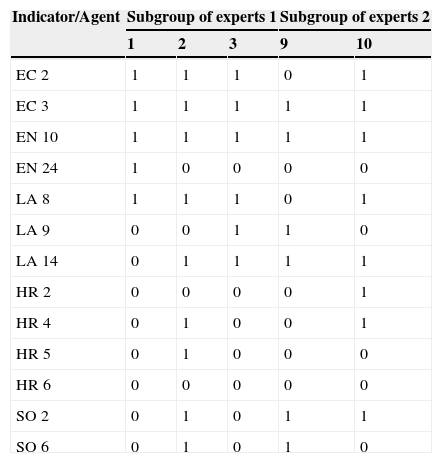
The second questionnaire asked the experts which of the indicators included must be eliminated (therefore, we changed the scale to provide two possible options, 0 or 1). With respect to the indicators chosen to make up this second questionnaire, we included the indicators with the highest number of votes with a value of 0 or 1 among the group of agents involved in the first round.7
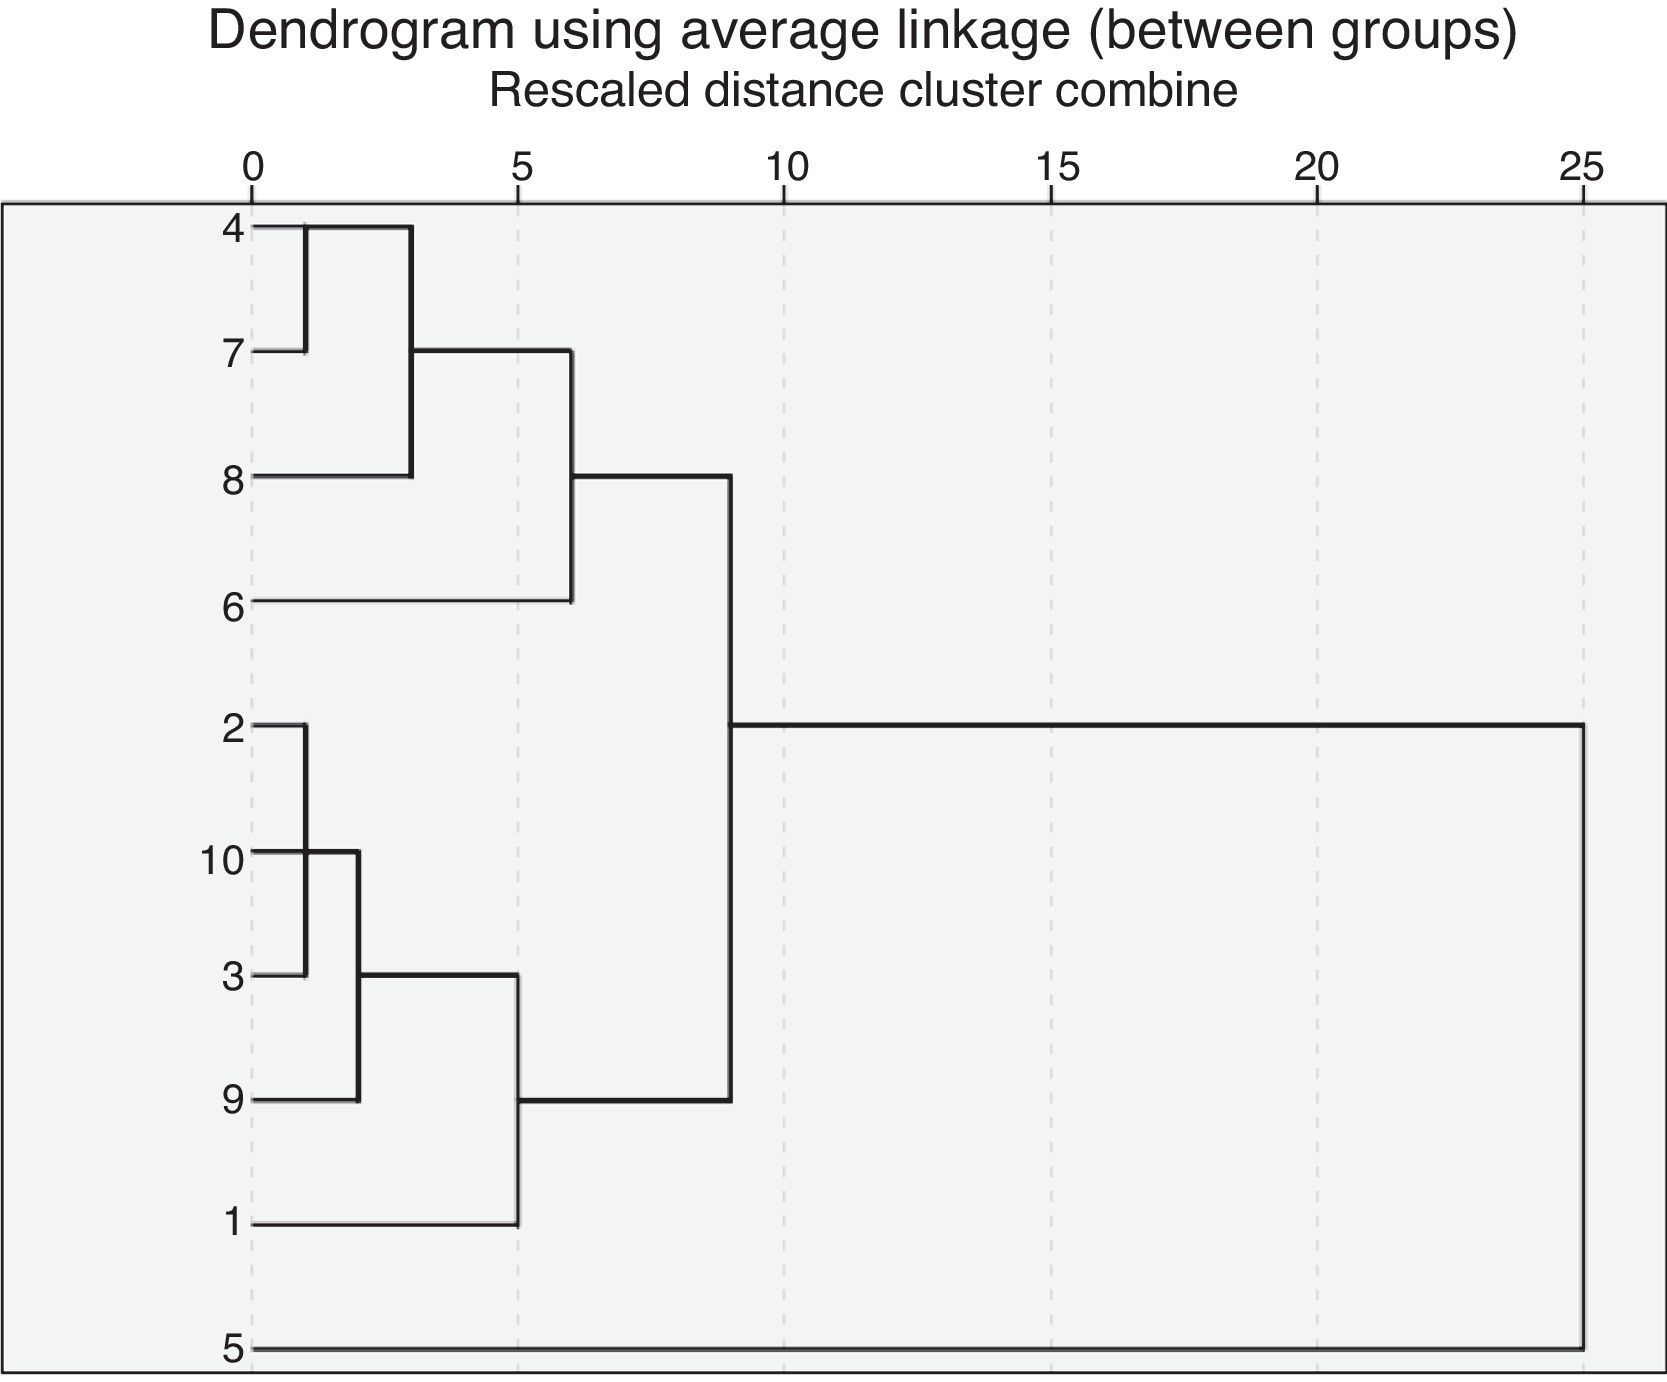
Results obtainedResults from the first roundWe obtained the results from the first round of ratings that the different experts awarded to the different indicators proposed by the G3. The literature stated that the responses might differ if the panellists had different characteristics (Landeta, 1999; Okoli and Pawlowski, 2004). To compare this panel characteristic, a hierarchical cluster was the first analysis performed. This procedure attempted to identify relatively uniform groups of cases (agents) based on the characteristics selected using an algorithm that begins in each case in a different conglomerate and combines the conglomerates until only one remains. Table 2 includes information on the belonging conglomerate, and shows that the hierarchical cluster established three conglomerates. The first is comprised of agents belonging to the two subgroups of experts, that is, those considered secondary agents. The second conglomerate is comprised of the members of the agents-involved subgroup, with the exception of the public authority representatives (expert number 5) who comprise the third conglomerate (see Table 2).
Analysing the dendrogram8 shows how the different conglomerates are formed through linkages. Therefore, analysis of punctuation of these indicators within the different clusters provides very valuable information for identifying the profiles of the different groups. Thus, although the two subgroups of experts form the first cluster, the agents of the second subgroup are joined together before being combined with the experts of the first subgroup. Thus, the first conglomerate is formed (Fig. 1).

Once the cluster analysis compared our distribution of agents among the different subgroups, the next step was to prepare the statistics (mean, median, typical deviation mode, variance and percentages for each of the subgroups regarding an assessment of the different indicators).
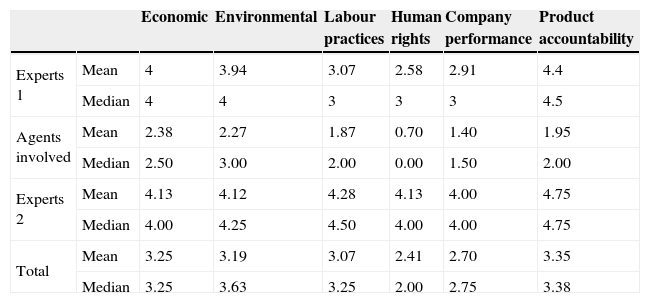
Analysis of the means and medians as measurements of central trends when assessing the indicators shows that the agents-involved subgroup is the most reluctant to incorporate indicators in a hypothetical report on the sector (Table 3). Its ratings are lower than those of the other two expert subgroups, with only the environmental and economic indicators and those of product accountability achieving a mean and median higher than 2.
Statistics of the expert's responses in the first rounda.
| Economic | Environmental | Labour practices | Human rights | Company performance | Product accountability | ||
|---|---|---|---|---|---|---|---|
| Experts 1 | Mean | 4 | 3.94 | 3.07 | 2.58 | 2.91 | 4.4 |
| Median | 4 | 4 | 3 | 3 | 3 | 4.5 | |
| Agents involved | Mean | 2.38 | 2.27 | 1.87 | 0.70 | 1.40 | 1.95 |
| Median | 2.50 | 3.00 | 2.00 | 0.00 | 1.50 | 2.00 | |
| Experts 2 | Mean | 4.13 | 4.12 | 4.28 | 4.13 | 4.00 | 4.75 |
| Median | 4.00 | 4.25 | 4.50 | 4.00 | 4.00 | 4.75 | |
| Total | Mean | 3.25 | 3.19 | 3.07 | 2.41 | 2.70 | 3.35 |
| Median | 3.25 | 3.63 | 3.25 | 2.00 | 2.75 | 3.38 |
Table 3 clearly differentiates the panellists’ ratings. The following two aspects are clearly observed.
- •
The two subgroups of experts are those providing a higher rating of the indicators and the agents involved are the most reluctant to add indicators.
- •
The environmental and economic indicators, and those relating to product accountability, are the most highly rated in the three subgroups.
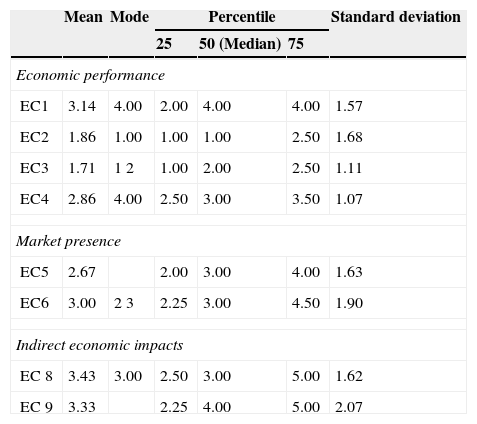
The main result of the first round is that the agents involved were the more reluctant group in the hypothetical application of some indicators in the sustainability report, as Table 4 shows. We analyse the results along with the feedback received from this group.
- (a)
Economic indicators
Economic indicators.
| Mean | Mode | Percentile | Standard deviation | |||
|---|---|---|---|---|---|---|
| 25 | 50 (Median) | 75 | ||||
| Economic performance | ||||||
| EC1 | 3.14 | 4.00 | 2.00 | 4.00 | 4.00 | 1.57 |
| EC2 | 1.86 | 1.00 | 1.00 | 1.00 | 2.50 | 1.68 |
| EC3 | 1.71 | 1 2 | 1.00 | 2.00 | 2.50 | 1.11 |
| EC4 | 2.86 | 4.00 | 2.50 | 3.00 | 3.50 | 1.07 |
| Market presence | ||||||
| EC5 | 2.67 | 2.00 | 3.00 | 4.00 | 1.63 | |
| EC6 | 3.00 | 2 3 | 2.25 | 3.00 | 4.50 | 1.90 |
| Indirect economic impacts | ||||||
| EC 8 | 3.43 | 3.00 | 2.50 | 3.00 | 5.00 | 1.62 |
| EC 9 | 3.33 | 2.25 | 4.00 | 5.00 | 2.07 | |
Although economic indicators were the most highly rated, only three indicators achieved a mean and a median higher than 3 (EC1, EC8, and EC9) and one had a mode of 4 (EC4) but a mean lower than 3. The meaningful piece of information was the major deviation in the ratings by the agents involved. This statistical evidence is complemented with the following feedback.
Feedback
- •
Although the information is interesting to the user, disclosing this type of information is very difficult.
- •
Showing that this kind of business earns money but only in a long and sustainable manner is important.
- •
I believe that an indicator related to sales and public support would be better than one related to the party in power.
- (b)
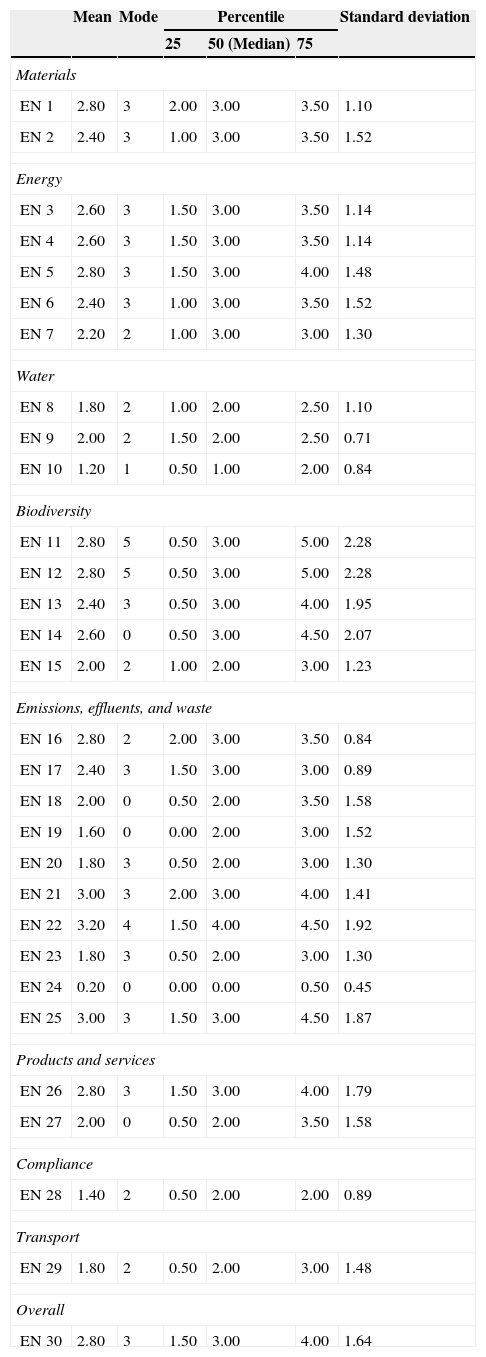
Environmental indicators
Environmental indicators had lower ratings and only two indicators related to emissions had a mean higher than 3 (Table 5). However, most indicators had a mode higher than 3 because of the critical importance of the deviation in those indicators (e.g., if the mode was 5, then the deviation was higher than 2). This situation arose because the cluster analysis established two conglomerates in this subgroup; therefore, the results are very different).
Environmental indicators.
| Mean | Mode | Percentile | Standard deviation | |||
|---|---|---|---|---|---|---|
| 25 | 50 (Median) | 75 | ||||
| Materials | ||||||
| EN 1 | 2.80 | 3 | 2.00 | 3.00 | 3.50 | 1.10 |
| EN 2 | 2.40 | 3 | 1.00 | 3.00 | 3.50 | 1.52 |
| Energy | ||||||
| EN 3 | 2.60 | 3 | 1.50 | 3.00 | 3.50 | 1.14 |
| EN 4 | 2.60 | 3 | 1.50 | 3.00 | 3.50 | 1.14 |
| EN 5 | 2.80 | 3 | 1.50 | 3.00 | 4.00 | 1.48 |
| EN 6 | 2.40 | 3 | 1.00 | 3.00 | 3.50 | 1.52 |
| EN 7 | 2.20 | 2 | 1.00 | 3.00 | 3.00 | 1.30 |
| Water | ||||||
| EN 8 | 1.80 | 2 | 1.00 | 2.00 | 2.50 | 1.10 |
| EN 9 | 2.00 | 2 | 1.50 | 2.00 | 2.50 | 0.71 |
| EN 10 | 1.20 | 1 | 0.50 | 1.00 | 2.00 | 0.84 |
| Biodiversity | ||||||
| EN 11 | 2.80 | 5 | 0.50 | 3.00 | 5.00 | 2.28 |
| EN 12 | 2.80 | 5 | 0.50 | 3.00 | 5.00 | 2.28 |
| EN 13 | 2.40 | 3 | 0.50 | 3.00 | 4.00 | 1.95 |
| EN 14 | 2.60 | 0 | 0.50 | 3.00 | 4.50 | 2.07 |
| EN 15 | 2.00 | 2 | 1.00 | 2.00 | 3.00 | 1.23 |
| Emissions, effluents, and waste | ||||||
| EN 16 | 2.80 | 2 | 2.00 | 3.00 | 3.50 | 0.84 |
| EN 17 | 2.40 | 3 | 1.50 | 3.00 | 3.00 | 0.89 |
| EN 18 | 2.00 | 0 | 0.50 | 2.00 | 3.50 | 1.58 |
| EN 19 | 1.60 | 0 | 0.00 | 2.00 | 3.00 | 1.52 |
| EN 20 | 1.80 | 3 | 0.50 | 2.00 | 3.00 | 1.30 |
| EN 21 | 3.00 | 3 | 2.00 | 3.00 | 4.00 | 1.41 |
| EN 22 | 3.20 | 4 | 1.50 | 4.00 | 4.50 | 1.92 |
| EN 23 | 1.80 | 3 | 0.50 | 2.00 | 3.00 | 1.30 |
| EN 24 | 0.20 | 0 | 0.00 | 0.00 | 0.50 | 0.45 |
| EN 25 | 3.00 | 3 | 1.50 | 3.00 | 4.50 | 1.87 |
| Products and services | ||||||
| EN 26 | 2.80 | 3 | 1.50 | 3.00 | 4.00 | 1.79 |
| EN 27 | 2.00 | 0 | 0.50 | 2.00 | 3.50 | 1.58 |
| Compliance | ||||||
| EN 28 | 1.40 | 2 | 0.50 | 2.00 | 2.00 | 0.89 |
| Transport | ||||||
| EN 29 | 1.80 | 2 | 0.50 | 2.00 | 3.00 | 1.48 |
| Overall | ||||||
| EN 30 | 2.80 | 3 | 1.50 | 3.00 | 4.00 | 1.64 |
Feedback
- •
I also believe that most indicators are not related to this sector – I cannot understand their meaning.
- •
I believe that EN12 is a key aspect. Information on emissions should be related to the manner in which the farm develops, indicating that the information should contain more than independent and unrelated data.
- •
A lot of indicators are very difficult to achieve for these kinds of farms. I also do not agree with the mixing scales.
- (c)
Labour practice indicators
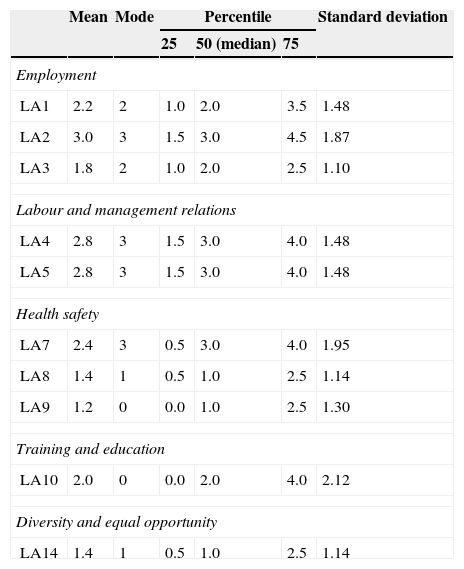
Those indicators were the most highly rated in the social area, but the ratings were lower than the economic and environmental ratings (Table 6). The indicators related to training and diversity were not very important for most of the survey.
Labour practice indicators.
| Mean | Mode | Percentile | Standard deviation | |||
|---|---|---|---|---|---|---|
| 25 | 50 (median) | 75 | ||||
| Employment | ||||||
| LA1 | 2.2 | 2 | 1.0 | 2.0 | 3.5 | 1.48 |
| LA2 | 3.0 | 3 | 1.5 | 3.0 | 4.5 | 1.87 |
| LA3 | 1.8 | 2 | 1.0 | 2.0 | 2.5 | 1.10 |
| Labour and management relations | ||||||
| LA4 | 2.8 | 3 | 1.5 | 3.0 | 4.0 | 1.48 |
| LA5 | 2.8 | 3 | 1.5 | 3.0 | 4.0 | 1.48 |
| Health safety | ||||||
| LA7 | 2.4 | 3 | 0.5 | 3.0 | 4.0 | 1.95 |
| LA8 | 1.4 | 1 | 0.5 | 1.0 | 2.5 | 1.14 |
| LA9 | 1.2 | 0 | 0.0 | 1.0 | 2.5 | 1.30 |
| Training and education | ||||||
| LA10 | 2.0 | 0 | 0.0 | 2.0 | 4.0 | 2.12 |
| Diversity and equal opportunity | ||||||
| LA14 | 1.4 | 1 | 0.5 | 1.0 | 2.5 | 1.14 |
Feedback
- •
Those indicators are not related to this sector in Guipúzcoa. We are owners and workers at the same time.
- •
Those indicators are more related to the industrial sector than to small family farms.
- •
We need special indicators because we are owners and workers at the same time.
- (d)
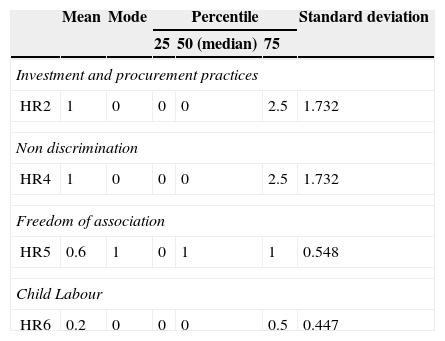
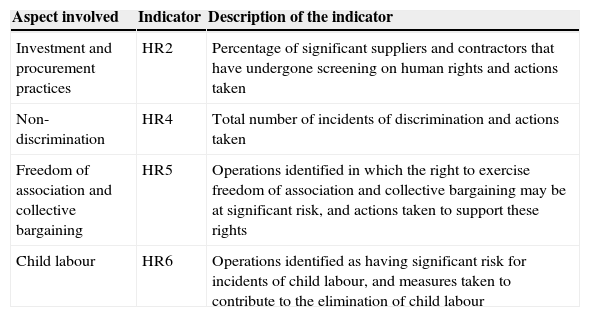
Human rights indicators
This aspect of the social area was not very important to the subgroup, possibly because these types of problem do not normally occur in this region (Table 7).
Feedback
- •
Those indicators are not appropriate for our sector.
- •
I believe that we need more debate on child labour. I believe a lot of hypocrisy exists in this aspect; in farms children tend to help with the housework.
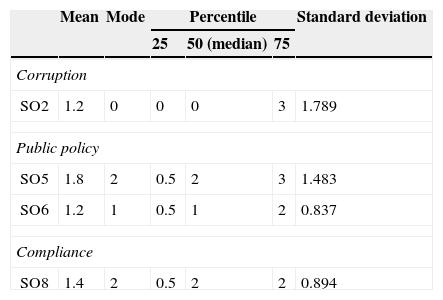
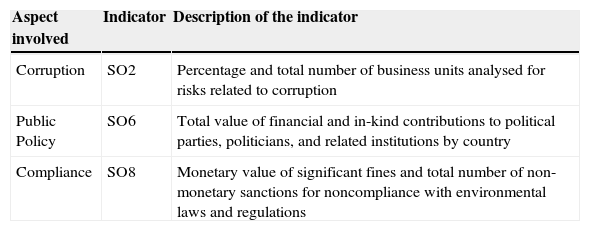
- (e)
Society performance indicators
Only the public policy and compliance indicators displayed any importance.
Feedback
- •
Which indicators are not related to this sector in Guipúzcoa?
- •
The information on lobbying is more related to large-scale industries. We do not have any power; we have no money for these kinds of thing.
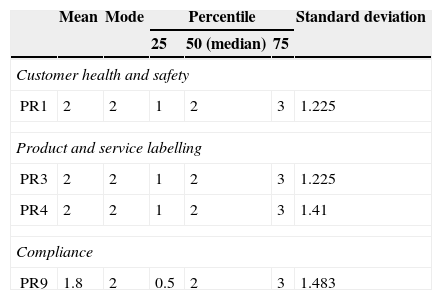
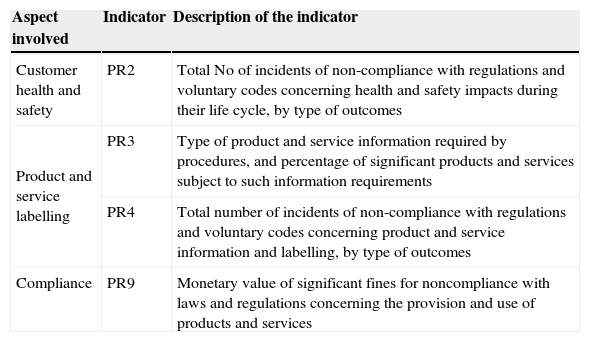
- (f)
Product responsibility indicators
Although their ratings were low, the product responsibility indicators had the highest ratings after the labour practice indicators. As Table 8 shows, all indicators for this social aspect had more or less the same ratings and similar deviations (Table 9).
Feedback
- •
Those indicators are not related to this sector in any region of the world.
Based on the first-round results among the groups and the lowest ratings by the agents involved, the determination was that reaching a consensus would be difficult and repeating the rounds may result in the panellists losing motivation and, therefore, a lack of responses (Landeta, 1999). We complemented this statistical evidence with the feedback from the agents involved, which referred to the difficulty and the cost of preparing the information and took into account the reduced dimensions of the organisation to which the report is addressed. Therefore, the position of this subgroup was very adverse when including them in a potential report for the sector. Furthermore, the agent representing the administration (one of the main users of the information) was the most reluctant because it considered the cost to be excessive and because of the lack of relevance of some of the proposed indicators, particularly the social indicators. The situation clearly reflected the cluster analysis that identified the agent representing the administration as the only member of its conglomerate.
Because the objective of the second round was to reduce the number of indicators, we focused only on the agents who were most favourable towards the inclusion; that is, the two subgroups of agents.
To prepare the second questionnaire, we used mode as the central trend measurement because no rating was being requested in this round, and we only wanted to consider the responses with the greatest consensus. In contrast, we opted for the 50th percentile to measure the dispersion. Taking into account those two characteristics, we prepared a list of the indicators that complied with the following requirements.
- •
The mode changed from 0 to 1 when rating the people involved.
- •
Because more than one mode existed in some indicators and the typical deviation was high (Annex), we established a second condition, which was that the percentile – median – 50 went from 0 to 1 as a dispersion measurement.
The second questionnaire asked the two subgroups of agents to assess the indicators that should be eliminated, taking into account the feedback from the agents involved. The results were as follows (Table 10):
Therefore, all economic indicators were kept and we proceeded to eliminate the EN24 indicator, the labour practice indicator (LA8), all indicators related to human rights (HR2, HR3, HR5 and HR6) and the social performance indicator (SO6).
Conclusions and implications of the studyThe aim of this paper, based on a normative approach to Stakeholder theory, was to discover what kind of sustainable information should be disclosed in a sustainability report for farming operations in Gipuzkoa. This reporting framework involves a democratic approach which sees accountability in general and sustainability reporting in particular as part of the dialogue between society and its organisations.
The first notable conclusion – based on no differences between the different subgroups – is that the different agents involved in the performance of the company place greater importance on environmental and economic performance. The experts did not rate the social indicators as highly, and the product accountability indicators were the only ones with a similar mean valuation to that of the environmental and economic indicators (see Table 3).
The little importance given to social issues is an aspect that would require a more in-depth analysis. The study was conducted in the early years of the present crisis, which at the time had caused only minor negative effects in the social sphere of Gipuzkoa when compared to other regions in Spain. It must be borne in mind that the region of Gipuzkoa has one of the lowest rates of unemployment and one of the largest collective agreements and per capita income of the Spanish State. This situation may explain the lack of interest in these aspects. It is also noted that the farming sector – which in terms of GDP, makes a relatively small contribution – has traditionally been well protected by the Basque Government, encouraging the creation of “labels of quality” which has allowed farms to differentiate Basque farming produce from that produce supplied by external competitors. Another reason may be the typology of the agricultural holdings in Gipuzkoa. The farms are normally managed by owners and family members, a fact which makes labour, gender or corruption issues less relevant.
The second conclusion refers to the difference in the responses of the three subgroups. We noted how the primary internal agents most involved in the development of the farming activity were the most reluctant to incorporate indicators and, therefore, gave the lowest scores to the indicators. This situation was repeated in all of the different indicator groups.9
There is a clear relationship between the ratings of the indicators provided by the agents and those agents’ connections to the hypothetical preparation of the report. The greater the connection is, the greater the commitments (attributable to generating monitoring, management and administrative costs etc.), and the lower the ratings provided. The experts who were external agents provided higher ratings than the experts who, in turn, were internal agents. The feedback provided by the agents allow us to infer that this type of report is seen more as an administrative requirement than as a management tool or a tool for disclosing material information.
Thirdly, the application of the Delphi method is an attempt to find a consensus between the different participants. In the present paper, although we continued with more rounds of questionnaires, the results of the first draft clearly indicated that this consensus was improbable. In public processes to develop sustainability tools, a multi stakeholder dialogue is considered the best way to capture the different perceptions of different groups on different issues contained within the sustainability mega-concept. However, usually in such dialogues the group of experts dominate the other group opinions (Archel & Husillos, 2009), and therefore they drive the discussion to a generally accepted positive concept of sustainability. In our work we have not observed this process of hegemony in the discussions. The agents involved were not “expert” in the CSR area and had their own perception with regard to “what” should count as material in these kinds of reports. These perceptions have not been therefore driven by “expert” opinions.
Fourthly, within this subgroup, we were able to use cluster analysis to detect how the public institution representatives formed their own conglomerate because their ratings were the lowest. This lack of interest (or opposition) by the representative of the local government (an entity, which it can be assumed would be interested, in principle, in this type of project) in demanding many of the indicators proposed by the GRI, makes the development of sustainability reporting by farms in Gipuzkoa more difficult in the short term. The use of the GRI indicators may generate a series of costs that are difficult to meet because of the economic-technical characteristics of these companies. We considered that the information provided by the report should be relevant. However, many of the social and environmental indicators of the GRI reports considered a series of social aspects that do not overtly affect a small organisation. This situation is reflected in the lower rating from agents who are directly involved and in their feedback. In that sense transparent reporting not only fits with this virtuous ideal of rationality and comprehensive information, but also responds to a practical necessity (Boiral, 2013), and in our work involved agents manifested the need to reduce the number of indicators to their supposed necessity.
As a final conclusion, we believe that highlighting the following fact is important. This paper used the stakeholder theory to establish different groups of experts (taking into account the characteristics of the Delphi methodology) and cluster analysis provided important evidence. Although each of the subgroups represents different types of agents according to the Clarkson (1995) and Freeman (1984) classification and, therefore, we could presuppose different interests by using the theory, the information contained in the dendrogram shows that the characteristic of being an expert in the area is more important when performing the conglomerates. In other words, expert status is a more important factor than type of agent when explaining the ratings.
We believe that although introducing reports in this branch of the economy is a first stage, the study provides useful information for public entities (or, as in the case of the GRI, for their voluntary use by organisations when designing this type of sustainability). We believe that a debate considering the meaning of “sustainability” and how it should be managed is necessary. As stated by Milne and Gray (2007, p. 200) “social accounting allows the state, civil society, and organisations to hold the debate with data about the real impacts of material well being and such matter”, although many organisations might have use this kind of information for legitimation it is also possible, by the discussion between the different Stakeholder, to achieve reports that helps us to do what they believe is the right thing, not simply what other tell us that it can be done.
Conflicts of interestThe authors have no conflicts of interest to declare.
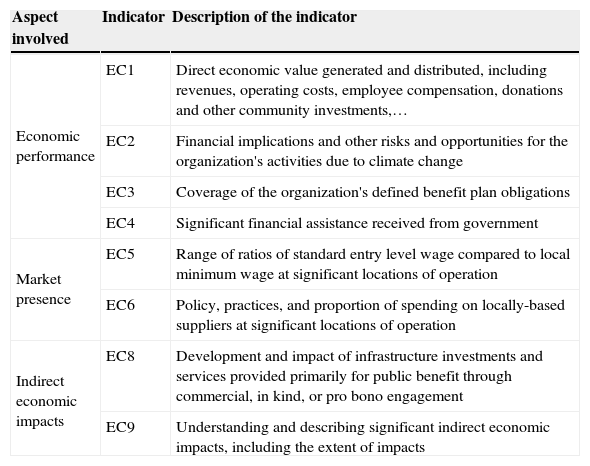
Area: economic performance.
| Aspect involved | Indicator | Description of the indicator |
|---|---|---|
| Economic performance | EC1 | Direct economic value generated and distributed, including revenues, operating costs, employee compensation, donations and other community investments,… |
| EC2 | Financial implications and other risks and opportunities for the organization's activities due to climate change | |
| EC3 | Coverage of the organization's defined benefit plan obligations | |
| EC4 | Significant financial assistance received from government | |
| Market presence | EC5 | Range of ratios of standard entry level wage compared to local minimum wage at significant locations of operation |
| EC6 | Policy, practices, and proportion of spending on locally-based suppliers at significant locations of operation | |
| Indirect economic impacts | EC8 | Development and impact of infrastructure investments and services provided primarily for public benefit through commercial, in kind, or pro bono engagement |
| EC9 | Understanding and describing significant indirect economic impacts, including the extent of impacts |
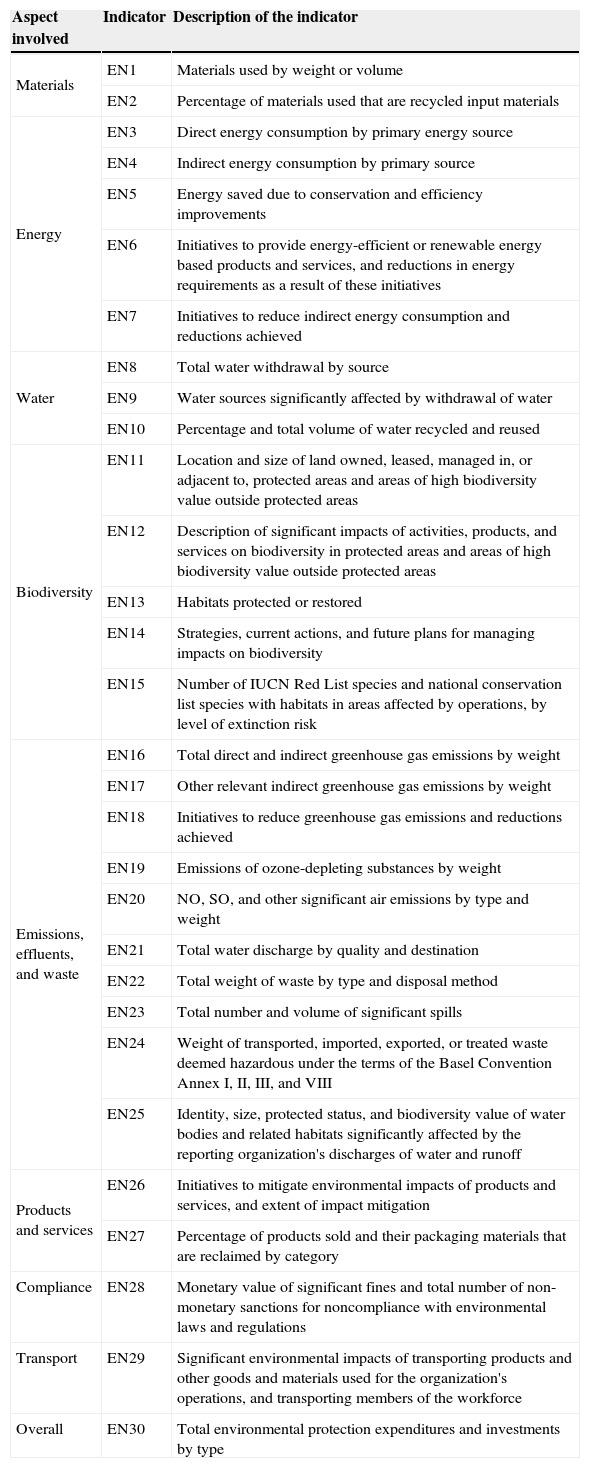
Area: environmental performance.
| Aspect involved | Indicator | Description of the indicator |
|---|---|---|
| Materials | EN1 | Materials used by weight or volume |
| EN2 | Percentage of materials used that are recycled input materials | |
| Energy | EN3 | Direct energy consumption by primary energy source |
| EN4 | Indirect energy consumption by primary source | |
| EN5 | Energy saved due to conservation and efficiency improvements | |
| EN6 | Initiatives to provide energy-efficient or renewable energy based products and services, and reductions in energy requirements as a result of these initiatives | |
| EN7 | Initiatives to reduce indirect energy consumption and reductions achieved | |
| Water | EN8 | Total water withdrawal by source |
| EN9 | Water sources significantly affected by withdrawal of water | |
| EN10 | Percentage and total volume of water recycled and reused | |
| Biodiversity | EN11 | Location and size of land owned, leased, managed in, or adjacent to, protected areas and areas of high biodiversity value outside protected areas |
| EN12 | Description of significant impacts of activities, products, and services on biodiversity in protected areas and areas of high biodiversity value outside protected areas | |
| EN13 | Habitats protected or restored | |
| EN14 | Strategies, current actions, and future plans for managing impacts on biodiversity | |
| EN15 | Number of IUCN Red List species and national conservation list species with habitats in areas affected by operations, by level of extinction risk | |
| Emissions, effluents, and waste | EN16 | Total direct and indirect greenhouse gas emissions by weight |
| EN17 | Other relevant indirect greenhouse gas emissions by weight | |
| EN18 | Initiatives to reduce greenhouse gas emissions and reductions achieved | |
| EN19 | Emissions of ozone-depleting substances by weight | |
| EN20 | NO, SO, and other significant air emissions by type and weight | |
| EN21 | Total water discharge by quality and destination | |
| EN22 | Total weight of waste by type and disposal method | |
| EN23 | Total number and volume of significant spills | |
| EN24 | Weight of transported, imported, exported, or treated waste deemed hazardous under the terms of the Basel Convention Annex I, II, III, and VIII | |
| EN25 | Identity, size, protected status, and biodiversity value of water bodies and related habitats significantly affected by the reporting organization's discharges of water and runoff | |
| Products and services | EN26 | Initiatives to mitigate environmental impacts of products and services, and extent of impact mitigation |
| EN27 | Percentage of products sold and their packaging materials that are reclaimed by category | |
| Compliance | EN28 | Monetary value of significant fines and total number of non-monetary sanctions for noncompliance with environmental laws and regulations |
| Transport | EN29 | Significant environmental impacts of transporting products and other goods and materials used for the organization's operations, and transporting members of the workforce |
| Overall | EN30 | Total environmental protection expenditures and investments by type |
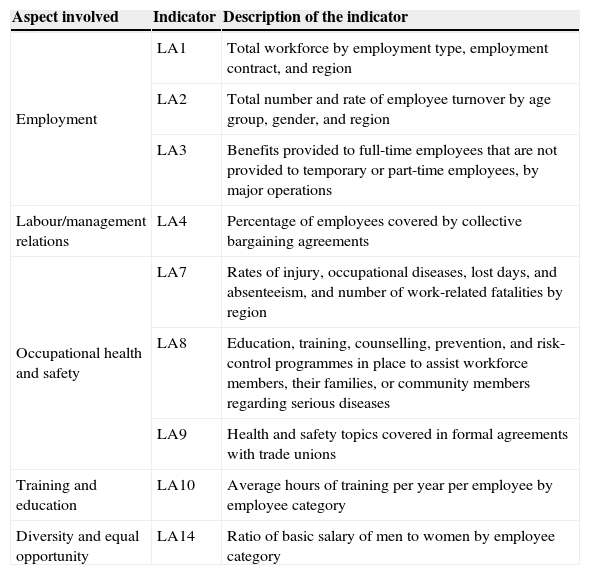
Area: social performance. Labour practices and decent work.
| Aspect involved | Indicator | Description of the indicator |
|---|---|---|
| Employment | LA1 | Total workforce by employment type, employment contract, and region |
| LA2 | Total number and rate of employee turnover by age group, gender, and region | |
| LA3 | Benefits provided to full-time employees that are not provided to temporary or part-time employees, by major operations | |
| Labour/management relations | LA4 | Percentage of employees covered by collective bargaining agreements |
| Occupational health and safety | LA7 | Rates of injury, occupational diseases, lost days, and absenteeism, and number of work-related fatalities by region |
| LA8 | Education, training, counselling, prevention, and risk-control programmes in place to assist workforce members, their families, or community members regarding serious diseases | |
| LA9 | Health and safety topics covered in formal agreements with trade unions | |
| Training and education | LA10 | Average hours of training per year per employee by employee category |
| Diversity and equal opportunity | LA14 | Ratio of basic salary of men to women by employee category |
Area: social performance. Human rights.
| Aspect involved | Indicator | Description of the indicator |
|---|---|---|
| Investment and procurement practices | HR2 | Percentage of significant suppliers and contractors that have undergone screening on human rights and actions taken |
| Non-discrimination | HR4 | Total number of incidents of discrimination and actions taken |
| Freedom of association and collective bargaining | HR5 | Operations identified in which the right to exercise freedom of association and collective bargaining may be at significant risk, and actions taken to support these rights |
| Child labour | HR6 | Operations identified as having significant risk for incidents of child labour, and measures taken to contribute to the elimination of child labour |
Area: social performance. Society performance indicators.
| Aspect involved | Indicator | Description of the indicator |
|---|---|---|
| Corruption | SO2 | Percentage and total number of business units analysed for risks related to corruption |
| Public Policy | SO6 | Total value of financial and in-kind contributions to political parties, politicians, and related institutions by country |
| Compliance | SO8 | Monetary value of significant fines and total number of non-monetary sanctions for noncompliance with environmental laws and regulations |
Area: social performance. Product responsibility.
| Aspect involved | Indicator | Description of the indicator |
|---|---|---|
| Customer health and safety | PR2 | Total No of incidents of non-compliance with regulations and voluntary codes concerning health and safety impacts during their life cycle, by type of outcomes |
| Product and service labelling | PR3 | Type of product and service information required by procedures, and percentage of significant products and services subject to such information requirements |
| PR4 | Total number of incidents of non-compliance with regulations and voluntary codes concerning product and service information and labelling, by type of outcomes | |
| Compliance | PR9 | Monetary value of significant fines for noncompliance with laws and regulations concerning the provision and use of products and services |
The primary sector supposes less than 1% of the Basque GDP, EUSTAT (2013).
Survey results showed that 77% of the G250 (Global Fortune Global 250) and 69% of the largest 100 companies in 22 countries (N100) disclose reports based on GRI guidelines.
The number of reports issued worldwide is currently 3402, divided among 54 countries on the seven continents (Alvarez, 2010).
Normally, such companies are financed by local authorities to help small businesses with their management obligations.
Although Wheeler and Sillanpaa (1998) defined local authorities as secondary agents, in our paper, one main user of the information is public administration; therefore, we consider it the primary agent.
Report model developed by the GRI in 2006, available at www.globalreporting.org.
We considered that if the majority of agents involved rated the indicator as 0 or 1, proposing that the criterion was valid for elimination in this second round was valid.
Dendrogram shows the distances and the process of grouping together the different records labelled with the value of various indicators taken as the explanatory variables. Similar objects are connected by means of links whose position on the diagram is determined by the level of similarity/difference between objects.
This conclusion can be checked using the mean valuation of the proposed indicators and based on the indicators that they thought should be eliminated.

www.publicationethics.org.