The literature review on the success of management information systems (IS) provides empirical evidence that mere investment in IS and New Management Tools (NMTs) does not guarantee better business results. Aiming to contribute to the knowledge of the factors explaining the success of IS implementation, this paper classifies them through cluster analysis, with a sample of Spanish companies according to the valuation given by their finance directors (CFOs) to the quality of such systems and their use for strategic purposes. This classification helps to answer three questions: do companies that better rate their IS improve their performance? How do IS quality and strategy affect results? Is there a positive relationship between the use of NMTs and improvement in performance?
Through the non-parametric Kruskal–Wallis test and a partial least squares (PLS) model results are yielded that support the first question and show the positive effect of the IS quality and strategy on improving corporate profitability. Logistic regression showed an interaction between the use of NMTs and the IS strategic approach with positive effects on improving profitability.
The results of this study have significant implications for companies, suggesting that investment in new IS and NMTs must be coupled with a clear sense of strategy.
La revisión de la literatura sobre el éxito de los sistemas de información de gestión (IS) aporta evidencia empírica que señala que la mera inversión en IS y en nuevas herramientas de gestión (NMT) no garantiza la mejora de los resultados empresariales. Con el fin de contribuir al conocimiento de los factores explicativos del éxito de los IS, este trabajo realiza una clasificación de los mismos a través de un análisis cluster para una muestra de empresas españolas en función de la valoración realizada por los directores financieros (CFOs) sobre la calidad de tales sistemas y su uso con fines estratégicos. Esta clasificación contribuye a responder a tres cuestiones: ¿mejoran más su rentabilidad las empresas con mayor valoración en su IS?, ¿cómo afectan la calidad de los sistemas de información y su enfoque estratégico a los resultados empresariales?, ¿existe una relación positiva entre el uso de NMT y la mejora de los resultados?
A través del test no paramétrico de Kuskal-Wallis y de un modelo Partial Least Squares (PLS) los resultados dan soporte a la primera cuestión, al igual que muestran un efecto positivo de la calidad de los IS y de su enfoque estratégico sobre la mejora de la rentabilidad empresarial. La regresión logística encuentra una interacción entre el uso de NMT y el enfoque estratégico del IS con efectos positivos sobre la mejora de la rentabilidad.
Los resultados de este trabajo presentan implicaciones relevantes para las empresas, ya que la inversión en nuevos IS y NMT debe realizarse con sentido estratégico.
The objective of management accounting is to provide timely and value-relevant information to managers to help them take short and long-term decisions (Gupta & Gunasekaran, 2005).
Nowadays, the environment is extremely competitive and globalised, and technologies are evolving constantly. Firms need more effective and sophisticated management accounting systems to successfully face the new conditions and improve their financial performance (Al-Omiri & Drury, 2007; Gupta & Gunasekaran, 2005; Libby & Waterhouse, 1996; Mia & Clarke, 1999).
In recent years, increasing global competition has intensified the challenges faced by managers, and many experts warn that management accounting needs to adapt to meet managers’ changing needs if it is to maintain its relevance (Chenhall & Langfield-Smith, 1998a). Many innovations in management accounting have been introduced in response, in an attempt to improve its utility.
Traditional techniques in management accounting, such as sections costs, budgets, standard costs, and direct costs have been combined with more recent techniques over the last three decades. There is no universal consensus on which techniques constitute New Management Tools (NMTs) (Cadez & Guilding, 2008). Nevertheless, most authors consider as NMTs or non-traditional techniques: activity-based costing (ABC), activity-based management (ABM), balanced scorecard (BS), just in time (JIT), total quality management (TQM), target costing (TC), strategic management accounting (SMA), lifecycle costing (LCC), benchmarking and theory of constraints (TOC). The prevalence of these techniques indicates that firms need increasingly accurate and sophisticated management information systems (IS) that adapt to managers’ changing needs.
Researchers assume that managers, as rational agents, are unlikely to adopt a management IS that does not help them improve their firm's financial performance (Chenhall, 2003). Thus, management information will conceivably help improve decision-making and, as a consequence, financial performance. Likewise, firms that rate their management IS highly will conceivably adopt NMTs to a greater extent, with the ultimate objective of maintaining and/or improving their financial performance. The current piece of work follows the approach of the abovementioned contributions to the accounting literature and considers that a management IS is successful if it enables the firm to take better decisions and improve its financial performance.
Internal accounting IS differ between companies, for example, in terms of quality, level of use and strategic relevance. Studies in the accounting literature tend to focus on the impact of specific management techniques on financial performance, while few look at the evaluation firms make of their own IS and the relation of these to financial performance. Empirical evidence shows that investment in NMTs does not guarantee better results. The mechanisms through which IS affect a firm's performance are therefore under-examined. This study aims to contribute to this line of research by analysing to what extent quality and the strategic approach of IS improve firm's performance, evaluating the effect that the use of NMTs has on performance.
This study evaluates the management IS of a sample of Spanish firms on the basis of the scores that their financial directors (CFOs) give in two areas: quality of IS (IS quality) and strategic use of the IS (IS strategy), which are identified in a principal components analysis. We use these elements to accomplish a cluster analysis, which identifies three different types of firms depending on their management IS. This typology of firms is then used to answer the following questions:
- -
Do firms whose management IS scores highly improve their performance?
- -
How do IS strategy and IS quality affect firms’ performance?
- -
Does a positive relationship exist between the use of NMTs and increased profitability?
The following section analyses the success of IS, their relationship with economic results and the effect of new tools or techniques (henceforth “techniques”, NMTs). Then, the research hypotheses and the methodology followed are described, including the sample and the variables used. The fifth section presents the results of the empirical study, while the final section offers the most important conclusions of the research and its limitations.
Literature reviewThis article deals manly with three basic concepts: the success of IS, financial performance, and the relation between NMTs and performance. First, we will analyse the literature dealing with success in IS, focusing on its effect on corporate results. NMTs are also taken into account.
Success of information systemsThis work aims to evaluate the success of management IS and of NMTs; hence, the first step is to define what is meant by success in this context.
The evaluation of IS is a difficult task for researchers (Limayem, Banerjee, & Ma, 2006; Serafeimidis & Smithson, 2000). Similarly, deciding whether an IS or management technique is successful is by no means simple either. According to Petter, DeLone, and McLean (2008), measurement of IS success is both complex and illusive. Thus, for example, it is extremely difficult to define what success is in the case of ABC (Shields, 1995), and some apparent failures of a particular technique may in fact be a consequence of a limited appreciation of the uses for which it was put into practice (Malmi, 1997).
DeLone and McLean (1992) examine the literature on the success of IS and conclude that researchers do not use a single measure of success, but various. These authors established a success evaluation method from 6 different and interrelated dimensions. Later, DeLone and McLean (2003) updated and improved the previous model with 7 variables or dimensions to measure IS success: information quality, service quality, system quality, intention to use, use, user satisfaction and net benefits. These models have been widely used by IS researchers for understanding and measuring the success of IS.
User satisfaction is one of the most important measures of IS success (Urbach & Müller, 2012); it remains, however, an uncertain concept (Livari, 2005). IS users expect the system to be of high quality, to have quality information and to provide substantial benefits (Wu & Wang, 2006). The main determinants of user satisfaction with IS are relevance, content, accuracy, and timeliness (Seddon & Yip, 1992). These elements were all gathered in the IS survey conducted for this study. It is therefore understood that a high score of these factors is related to high IS user satisfaction (in this case, CFOs).
One possible way of evaluating the success of an IS is to determine if its objectives have been met. In other words, if the firm has achieved the benefits that theory suggests it would achieve. This is difficult to decide because such systems often lack clearly defined specific objectives. The objectives are usually generic, such as to improve the process of decision-making, which is extremely difficult to test a posteriori.
Accountancy literature has not reached a consensus about the objectives of IS. In a global context, most objectives can be considered intermediate. That is, they are not the final goals but rather stepping-stones on the road to the firm's ultimate objective. This is generally assumed to be to ultimately obtain the greatest possible profit, or more specifically to achieve sustainable improvements in profitability (Chenhall, 1997). This amounts to saying that no firm would want to implement a new management IS if it did not expect the system to ultimately generate an improvement in its financial performance, even if the firm adopts the system with some specific objectives of management improvement. When a firm commits to implementing, using, and supporting an IS, the firm often does so because some type of positive organisational impact is desired, such as improved profitability or productivity (Petter, DeLone, & McLean, 2013).
Information systems and performanceAs has been suggested previously, the success of the IS can be obtained by measuring its effect on results. Various authors agree with this idea, and affirm directly that the aim of a management IS should be to achieve an improvement in the firm's financial performance. For instance, authors say that ABC should help firms take better decisions or improve their financial performance (Dopuch, 1993); the objective of ABC is to improve financial performance, not to obtain more exact costs (Cooper & Kaplan, 1992); firms adopt an innovation to achieve benefits that directly or indirectly affect financial performance indicators (Cagwin & Bouwman, 2002); or the main objective of an IS is to improve and enhance the potential role of the system in improving the firm's overall financial performance (Ranganathan & Kannabiran, 2004).
Using financial performance as an indicator of the success or failure of IS has various advantages. On the one hand, performance measurement is critical to the success of the firm because it creates understanding, shapes behaviour, and improves competitiveness (Gunasegaran, Williams, & McGaughey, 2005). On the other hand, financial performance represents a common objective of all the firm's IS and/or management techniques, which makes it easier to evaluate their utility. Finally, despite their limitations, financial data have the advantage of being precise and objective (Parker, 2000), while intermediate, non-financial goals are often subjective, since they depend on personal opinions. Hence, the evaluation of non-financial goals may depend on the job held by the respondent (Anderson & Young, 1999).
Given the above advantages, the current study uses the firm's financial performance to measure the success of management IS and NMTs.
New management techniques and performanceFirms adopt NMTs with the purpose of improving the decision-making processes, their flexibility and output costs, and, ultimately, to improve results (Henry & Mayle, 2003; Hatif AlMaryani & Sadik, 2012). Despite the limitations, a number of empirical studies attempt to relate financial performance to management IS or NMTs. The majority of them analyse the individual effect of a particular management technique, albeit with a degree of divergence in results.
Some authors find that a set of management techniques and management accounting practices improve financial performance if firms follow certain strategic priorities (Chenhall and Langfield-Smith, 1998b; Naranjo-Gil, 2004). In contrast, other empirical studies find that firms that use traditional management accounting techniques are more profitable than those that use NMTs (Chenhall & Langfield-Smith, 1998a).
Abernethy and Bouwens (2005), citing various studies, observe increasing evidence that innovation in management accounting does not improve either the decision-making or the firm's financial performance. Theodorou and Florou (2008) analyse the effect of a particular information technology (IT) on financial performance considering five types of strategy, and in all the strategies they find improvements in financial performance when firms use advanced ITs. Therefore, there are difficulties providing evidence on a positive relationship between IT investments and firms’ financial performance (Ismail, 2007; Mahmood & Mann, 1993).
The three NMTs that are most used by the sample firms are TQM, BS, and ABC. Various empirical studies have analysed the possible relationship between applying TQM and financial performance; although some find no relation between the two variables (Corredor & Goni, 2011; Ittner & Larcker, 1995), or only a partial relationship (Samson & Terziovski, 1999), the majority conclude that a positive relationship exists between the TQM technique and the firm's financial performance (Choi & Eboch, 1998; Easton & Jarrell, 1998; Lam, Lee, Ooi, & Lin, 2011; Sila, 2007), although some authors consider that such a relationship is negative (Wali & Boujelbene, 2011).
Few studies have investigated the possible relationship between the use of BS and financial performance. This system has been shown to lead to superior financial performance in comparison to traditional results measurement systems based only on financial measures (Chi & Hung, 2011; Davis & Albright, 2004; De Geuser, Mooraj, & Oyon, 2009). Braam and Nijssen's (2004) findings suggest that the use of BS does not automatically improve results. Only if the technique complements the strategy does the technique have a positive impact on financial performance. The majority of members of the Institute of Management Accountants (IMA) use BS and obtain improvements in operational performance, while those that do not improve operational performance tend not to use BS. Despite this, many applications of this system fail (DeBusk & Grabtree, 2006).
With regard to the ABC system, the various studies consulted analyse the effects of using ABC on financial performance using different methodologies and financial performance indicators. ABC has been found to improve firms’ relative profitability in terms of both accounting and market-based measures (Jänkälä & Silvola, 2012; Kennedy & Affleck-Graves, 2001; Rafiq & Garg, 2002). Another study finds a positive association between ROI (return on investment) and ABC, and that synergies exist between ABC and other management techniques such as JIT and TQM (Cagwin & Bouwman, 2002). In contrast, other studies find no association between the use of ABC and firm performance (Gordon & Silvester, 1999; Innes & Mitchell, 1995; Ittner, Lanen, & Larcker, 2002). Firms have used ABC now for more than 20 years, but the literature has still failed to find sufficient empirical evidence that adopting the system has an effect on financial performance (Gosselin, 2006).
The above discussion means that the productivity paradox remains unresolved. According to this paradox, despite the massive investment in new IS, researchers have still failed to demonstrate a consistent correlation between this investment and productivity (Brynjolfsson & Hitt, 1996). The current study offers an empirical contribution that analyses this correlation, highlighting the role it plays in the success of IS, taking into account the strategic approach adopted, and the quality and implementation of NMTs.
HypothesesWe carried out an empirical study based on a questionnaire sent to a sample of Spanish firms to try to respond to the questions raised in the introduction. Based on this information certain hypotheses may be drawn and are presented below.
It can be said that the main aim of an IS is to improve and enhance the overall performance of the organisation (Ranganathan & Kannabiran, 2004); this is the reason why this criterion is used to evaluate the IS in this study.
The measure of IS user satisfaction provides a useful assessment of the system's success (DeLone & McLean, 1992; Escobar Pérez & Vélez Elorza, 1997; Raymond, 1987). The degree of IS utility perceived by users is similar to the expectations of future benefits to be realised by using the system (Rai et al., 2002). Users are likely to be satisfied with their firm's IS and rate it highly when they feel the system will help them improve their decisions and consequently improve the firm's financial performance. Thus, a positive relationship conceivably exists between the score managers give to their IS and the firm's financial performance. Obviously, the users of the information obtained with an IS will rate it highly when they are satisfied with the system. DeLone and McLean's IS success model (DeLone & McLean, 2003) is the method most widely used by researchers, both at theoretical and empirical levels (Dörr et al., 2013); this model, as has been previously explained, establishes, among others, the user satisfaction and net benefits variables in order to evaluate the IS. Following this, Halawai, McCarthy, and Aronson (2007) find a relation between user satisfaction and knowledge management systems success. However, IS success does not always imply a significant improvement of the firm's performance (Lee, 2012).
Bearing all this in mind, in order to clarify whether a relationship exists between user satisfaction (measured by the user's evaluation of IS quality and strategy) and performance, the first hypothesis is as follows:H1 Information systems with high scores are positively associated with the firms’ financial performance improvement.
The possible effect of firms’ IS on financial performance can be evaluated in two ways: first, by studying the change in the financial performance over a period of time; and second, by examining the financial performance observed at a particular moment in time. As the issues covered in the survey refer to the characteristics and the implementation of the IS during the last analysed period, we will be studying the effect the IS has on the improvement of the firm's performance.
Since the valuation given by the CFOs regarding information systems is summarised in two main factors, IS strategy and IS quality, Hypothesis 1 has been augmented with two additional hypotheses: H1.1 and H1.2.
“IS strategy alignment is assumed to facilitate the performance of all organisations, regardless of type or business strategy” (Chan, Sabherwal, & Thatcher, 2006: 27). Some empirical studies have found IS strategy alignment to influence the firm's financial performance (Chan, Huff, Barclay, & Copeland, 1997; Chan et al., 2006; Jarvenpaa & Ives, 1993; Teo & Ang, 1999). Thus, we propose the following hypothesis:H1.1 IS strategy is positively associated with performance improvement
Theoretically, it seems fairly clear that quality information may improve financial performance, given that this information should allow better management decisions to be made, which may in turn result in improved financial performance. Some researchers have found a positive correlation between IS quality and improvement in performance (Byrd, Thrasher, Lang, & Davidson, 2006; Xing-qiang & Ze-jiang, 2009). Byrd et al. (2006) find that an IS quality plan is essential for the success of an IS, particularly since the plan improves the quality of the IT system. Consequently, the following hypothesis is presented:H1.2 IS quality is positively associated with performance improvement.
Organizations’ dissatisfaction with their traditional accounting techniques is a major motivation for the diffusion of NMTs (Beng, Schoch, & Yap, 1994; Gosselin, 2006).
The literature review suggests the possibility of a positive relationship between the use of NMTs and financial performance. The adoption of recent management accounting changes are growing due to their contribution to overall performance of organisations (Adam & Fred, 2008; Vera-Muñoz, Shackell, & Buelner, 2007).
Organisations have increased their investments in IS significantly with the expectation that these investments will improve the firm's financial performance (Ravichandran & Lertwongsatien, 2005). Top managers use new management accounting systems or techniques when they believe that they will improve the firm's financial performance (Abernethy & Bouwens, 2005). There are many empirical studies that analyse the effect of using a NMT on financial performance, but few studies have been done considering several of these techniques simultaneously (Kannan & Tan, 2005; Feridun, Korhan et al., 2005; Al-Khadash & Feridun, 2006; Cua, McKone, & Schroeder, 2001). Therefore, more research is needed in this line of study.
Consequently, we advance the following hypothesis for testing:H2 The use of NMT has a positive effect on firms’ financial performance improvement.
Before testing the hypotheses, we ran a principal components analysis1 and obtained three factors relating to the management IS in the sample firms (use of cost systems, IS quality and IS strategy). The variables used to form the factors were obtained from Likert-type questions in a questionnaire sent to the CFOs of the sample firms.
From the factors identified, which define and evaluate the management IS, we ran a cluster analysis. This led to three types of firm differentiated by the scores given to their management IS.
We tested the first hypothesis by studying the evolution of the financial performance variables in the period analysed (1996–2004), using the non-parametric Kruskal–Wallis test, the non-parametric Mann–Whitney test and partial least squares (PLS).
The Kruskal–Wallis analysis is a non-parametric method for testing whether samples originate from the same distribution. It is used for comparing more than two samples that are independent or not related. When the Kruskal–Wallis test produces significant results, then at least one of the samples is different from the other samples. The Mann–Whitney test is useful for analysing the specific sample pairs for significant differences.
Through PLS, which is a technique based on structural equations that allows the building of models with complex relationships between observable and latent variables, a model was constructed to analyse the effects of IS quality and IS strategy in the improvement of corporate performance. PLS path modelling is recommended in the early stage of theoretical development in order to test and validate exploratory models, being particularly suitable for prediction-oriented research (Henseler, Ringle, & Sinkovics, 2009).
Pearson's chi-square (χ2) test is used to determine the association or independence of two qualitative variables, such as those related to cluster membership and the use or not of a particular management tool.
To test Hypothesis 2, we use the logistic regression technique, which allows the identification of characteristics that differentiate the companies that have improved their financial results. Among the variables that explain the improved economic results are the factors defining the IS and use of NMTs.
SampleUsing information from the SABI database, from the firm Informa, which holds accountancy data on Spanish companies, we chose 450 firms as the object of analysis. The firms complied with the following requisites:
- -
Spanish for-profit firms, operating, and founded before 1996.
- -
Revenues from ordinary activities exceeding €10 million in 2004.
During 2006, we contacted the CFOs of the firms by phone to inform them of the objectives of the study and request their participation.2 The questionnaire was sent by e-mail to those CFOs who agreed to receive the survey. The questionnaire was sent again to firms that had not initially responded. Eventually, 56 valid responses were received, which represent a response rate of 12.4%.
The 56 respondent firms are distributed by sector as follows:
- -
Industry: 75%
- -
Commerce: 10.7%
- -
Services: 14.3%.
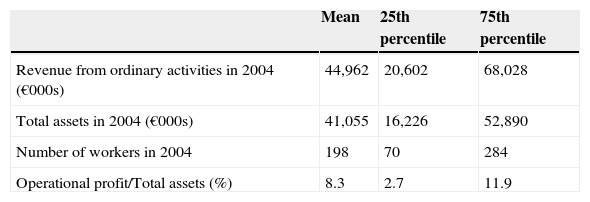
Table 1 reports on the mean values and the 25th and 75th percentiles for some of the variables in the sample.
To test for non-response bias, we compared by sectors the responding and non-responding firms’ revenue, total assets, number of workers and the ratio of operational profit divided by total assets in 2004. There were no significant differences across these variables (at p=0.05) with the exception of revenue, that has a lower value in the case of non-respondents in the industry (€35,091,900 vs. €40,994,870). It was then understood that there were no fundamental differences between respondents and non-respondents.
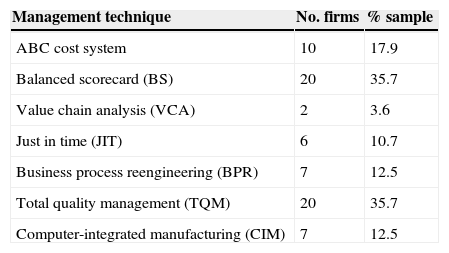
Of the 56 firms analysed, 58.9% apply at least one NMT (see Table 2). The following are the most widely used: BS (35.7%), TQM (35.7%), and ABC (17.9%).
Use of new management techniques (NMT).
| Management technique | No. firms | % sample |
|---|---|---|
| ABC cost system | 10 | 17.9 |
| Balanced scorecard (BS) | 20 | 35.7 |
| Value chain analysis (VCA) | 2 | 3.6 |
| Just in time (JIT) | 6 | 10.7 |
| Business process reengineering (BPR) | 7 | 12.5 |
| Total quality management (TQM) | 20 | 35.7 |
| Computer-integrated manufacturing (CIM) | 7 | 12.5 |
The dependent variables are ratios to facilitate comparison between the firms. They are all based on objective data from firms’ balance sheets, not on the respondents’ opinions. They all measure financial performance, and are as follows:
- -
MARGIN 1. Resources generated by ordinary activities over revenue from ordinary activities: ratio of operational profit plus depreciation to revenue from ordinary activities.
- -
MARGIN 2. Operational profit over revenue from ordinary activities: ratio of operational profit to revenue from ordinary activities.
- -
ROI 1. Operational profit over total assets: ratio of operational profit from profit and loss account to total assets from balance sheet.
- -
ROI 2. Profit from ordinary activities over total assets: ratio of operational profit plus financial profit (less financial costs) to total assets from balance sheet.
- -
ROI 3. Operational profit over operational assets: ratio of operational profit from profit and loss account to total assets from balance sheet less financial investments.
- -
ROI HC. ROI of human capital: operational profit before subtracting labour costs divided by labour costs.
- -
COSTS/OI. Operating costs over ordinary income.
To study the change in the results, we chose the period 1996–2004. The reason for this relatively long time period is that it conceivably takes time for the effects of changes in the IS on the financial performance to become evident. Researchers have found that the benefits of new IS may not become apparent for two or three years (Brynjolfsson, Gurbaxani, & Kambil, 1994). The initial financial performance is measured as the mean value of the period 1996–1997, and the final financial performance as the mean value of the period 2003–2004.
In order to analyse the initial and final relative positions and their change in the period 1996–2004 for the profitability variables, we re-calculated these variables dividing their values by the median of the firm's sector (Cagwin & Bouwman, 2002). The variables are interpreted as their relative distance from the sector median.3 The change in performance variables over time is calculated as shown in the following formula:

It should be made clear that this expression does not measure changes in profitability of each company in absolute terms, but rather evaluates the relative performance change for the period 1996–2004 by sector position, irrespective of macroeconomic developments, since such influence will be the same for all firms in the same sector.
In applying the PLS technique, a latent variable is used that measures the change in the ROI from the beginning to the end of the period, and is constructed via the changes in three indicators: ROI 1, ROI 2 and ROI 3.
Control variablesThis work uses two control variables commonly used in similar studies: firm size and sector.
For the development of the PLS model, the chosen approach is similar to that taken by Serrano-Cinca, Fuertes-Callén, and Gutiérrez-Nieto (2007), in that it uses a construct expressing the size of the company through the variables: total assets, sales and number of employees.
When the logistic regression is applied, firm size is measured by a dichotomous variable that equals 0 if the firm's revenue from ordinary activities in the final year (2004) is below the median and 1 otherwise. Larger firms have more resources, professionals and management experts to apply new techniques (Finch, 1986).
Various authors use sector as a control variable (Braam & Nijssen, 2004; Cagwin & Bouwman, 2002). Due to the small number of firms from the commerce and services sectors in the sample, the three initial sectors are re-grouped into industry and non-industry (commerce and services).
Independent variablesIn order to identify the main factors underlying the set of Likert-type variables obtained in the questionnaire (from 1=totally disagree, to 5=totally agree), we used principal components analysis.
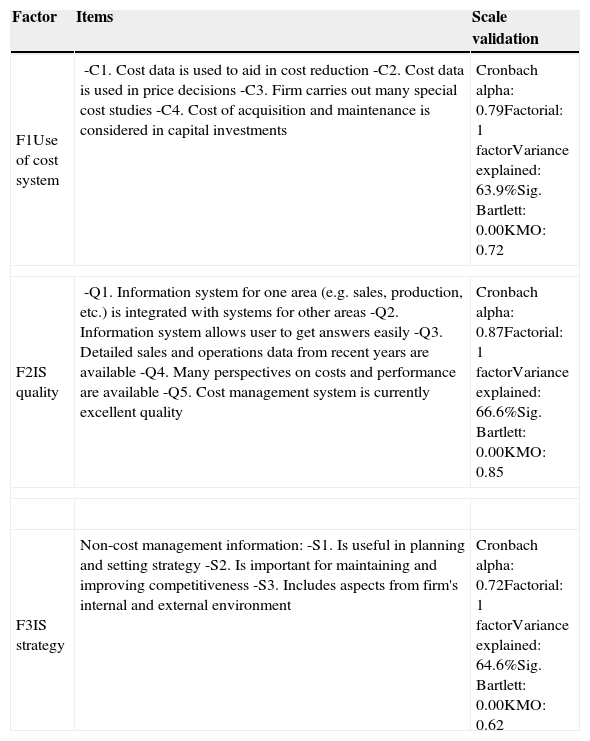
This technique identified three factors. Table 3 reports the items making up each factor, along with their validation values.
Factors obtained in principal components analysis.
| Factor | Items | Scale validation |
|---|---|---|
| F1Use of cost system | -C1. Cost data is used to aid in cost reduction-C2. Cost data is used in price decisions-C3. Firm carries out many special cost studies-C4. Cost of acquisition and maintenance is considered in capital investments | Cronbach alpha: 0.79Factorial: 1 factorVariance explained: 63.9%Sig. Bartlett: 0.00KMO: 0.72 |
| F2IS quality | -Q1. Information system for one area (e.g. sales, production, etc.) is integrated with systems for other areas-Q2. Information system allows user to get answers easily-Q3. Detailed sales and operations data from recent years are available-Q4. Many perspectives on costs and performance are available-Q5. Cost management system is currently excellent quality | Cronbach alpha: 0.87Factorial: 1 factorVariance explained: 66.6%Sig. Bartlett: 0.00KMO: 0.85 |
| F3IS strategy | Non-cost management information:-S1. Is useful in planning and setting strategy-S2. Is important for maintaining and improving competitiveness-S3. Includes aspects from firm's internal and external environment | Cronbach alpha: 0.72Factorial: 1 factorVariance explained: 64.6%Sig. Bartlett: 0.00KMO: 0.62 |
A brief explanation of the questions in each factor follows, along with their source.
F1, Use of cost system. Using information about costs for various management objectives will facilitate management thereof, which in turn should conceivably enhance the managers’ perception of that information and improve the firm's financial performance. The questions for this factor are adapted from Krumwiede (1998) and Byrd et al. (2006). In the questionnaire, the item “Product costs are adequately assessed to be able to compete in the market” is also valued, however this has not been included within the F1 factor as it negatively affects its validation.
F2, IS quality. Using quality internal information means that the information will be more relevant and timely, which in turn will conceivably enhance the perception of the quality of the information and improve the firm's financial performance. The questions for this factor are based on Krumwiede (1998) and Byrd et al. (2006). Due to issues relating to the validation of the F2 factor, the item “Operations data are updated in real time” has been omitted.
F3, IS strategy. Given the importance of the strategy for achieving superior financial performance, it is useful to measure the importance of the internal information for the implementation and development of the strategy. The questions for this factor are based on Cagwin and Bouwman (2002), and Braam and Nijssen (2004). The item “Timeliness and relevance are more important than accuracy” has not been taken into consideration in the F3 due to validation issues.
ResultsTypology of firms according to their management information systemIn order to analyse the heterogeneity in the firms’ management IS, we produced a typology of the sample firms using cluster analysis. Cluster analysis is a multivariate technique that classifies observed cases into homogenous groups with respect to some predetermined selection criterion. The cases in each cluster can be considered “similar”, while the different clusters are assumed to be “distinct” from each other (Aldenderfer & Blashfield, 1984; Hair, Anderson, Tatham, & Black, 1999). Researchers argue that cluster analysis can be used to show different combinations of variables that identify the management IS, which is useful for testing the effect of the system on financial performance (Chenhall & Langfield-Smith, 1998b).
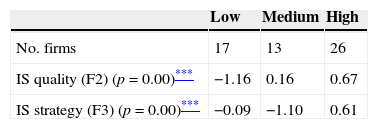
We used the k-means technique to carry out the cluster analysis, taking as classification variables two factors, IS quality and IS strategy, because they indicate the managers’ satisfaction with the use and quality of the management IS. Since there is a strong correlation between the factor F1 (use of cost system) and factor F2 (IS quality), it was decided not to include the first one in the production of cluster groups. The cluster analysis resulted in three groups of firms distinguished by the values of these two dimensions (Table 4).
We calculated the mean of the two factors that characterise the management IS for each firm, and then the mean for each cluster. Based on that value, the groups were labelled: high (26 firms), medium (13), and low (17). The high group contains firms with a high value in the two dimensions of the management IS; the low group contains firms with the worst mean value in IS quality; and the medium group contains firms with the lowest value in IS strategy. The non-parametric Kruskal–Wallis test for k independent samples shows that statistically significant differences exist between the three clusters in the two factors.
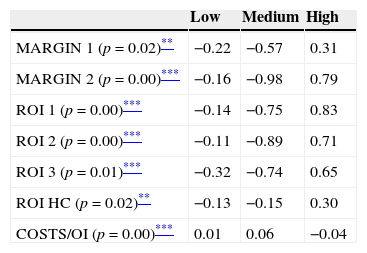
Hypothesis testsHypothesis 1This hypothesis postulates that firms that score their management IS highly achieve superior improvements in their financial performance than the rest of the firms. Table 5 shows the mean change in the relative profitability indicators over the period 1996–2004 for the three groups of firms identified.
Change in financial performance.
We used the non-parametric Kruskal–Wallis test for k independent samples to investigate the existence of significant differences between the three clusters of firms in the change in the financial performance. The results show that significant differences exist in all the financial performance variables in favour of the group of firms giving the highest score to their management IS. The medium group achieves the lowest changes. This may be because these firms have a low score in terms of their IS strategy.
We also ran a non-parametric Mann–Whitney U test on the clusters taken in pairs. The results show that statistically significant differences exist between the high cluster and the low and medium clusters. When comparing the low and medium clusters, only significant differences are observed in the change in ROI 1 and ROI 2 against medium group.
Hypotheses 1.1 and 1.2In order to analyse the effect that the variables that determine the cluster groups (IS strategy and IS quality) have on improving business performance, the partial least squares (PLS) technique was used. The model also included the firm size factor.
PLS is a technique based on structural equations that allows the building of models with complex relationships between observable and latent variables. A latent variable is not directly observable; it is a construct made from other variables that theoretically form (formative indicators) or reflect (reflective indicators) a factor of interest for the study (represented by the latent variable). This technique has been widely used to analyse relationships between variables obtained from survey responses.
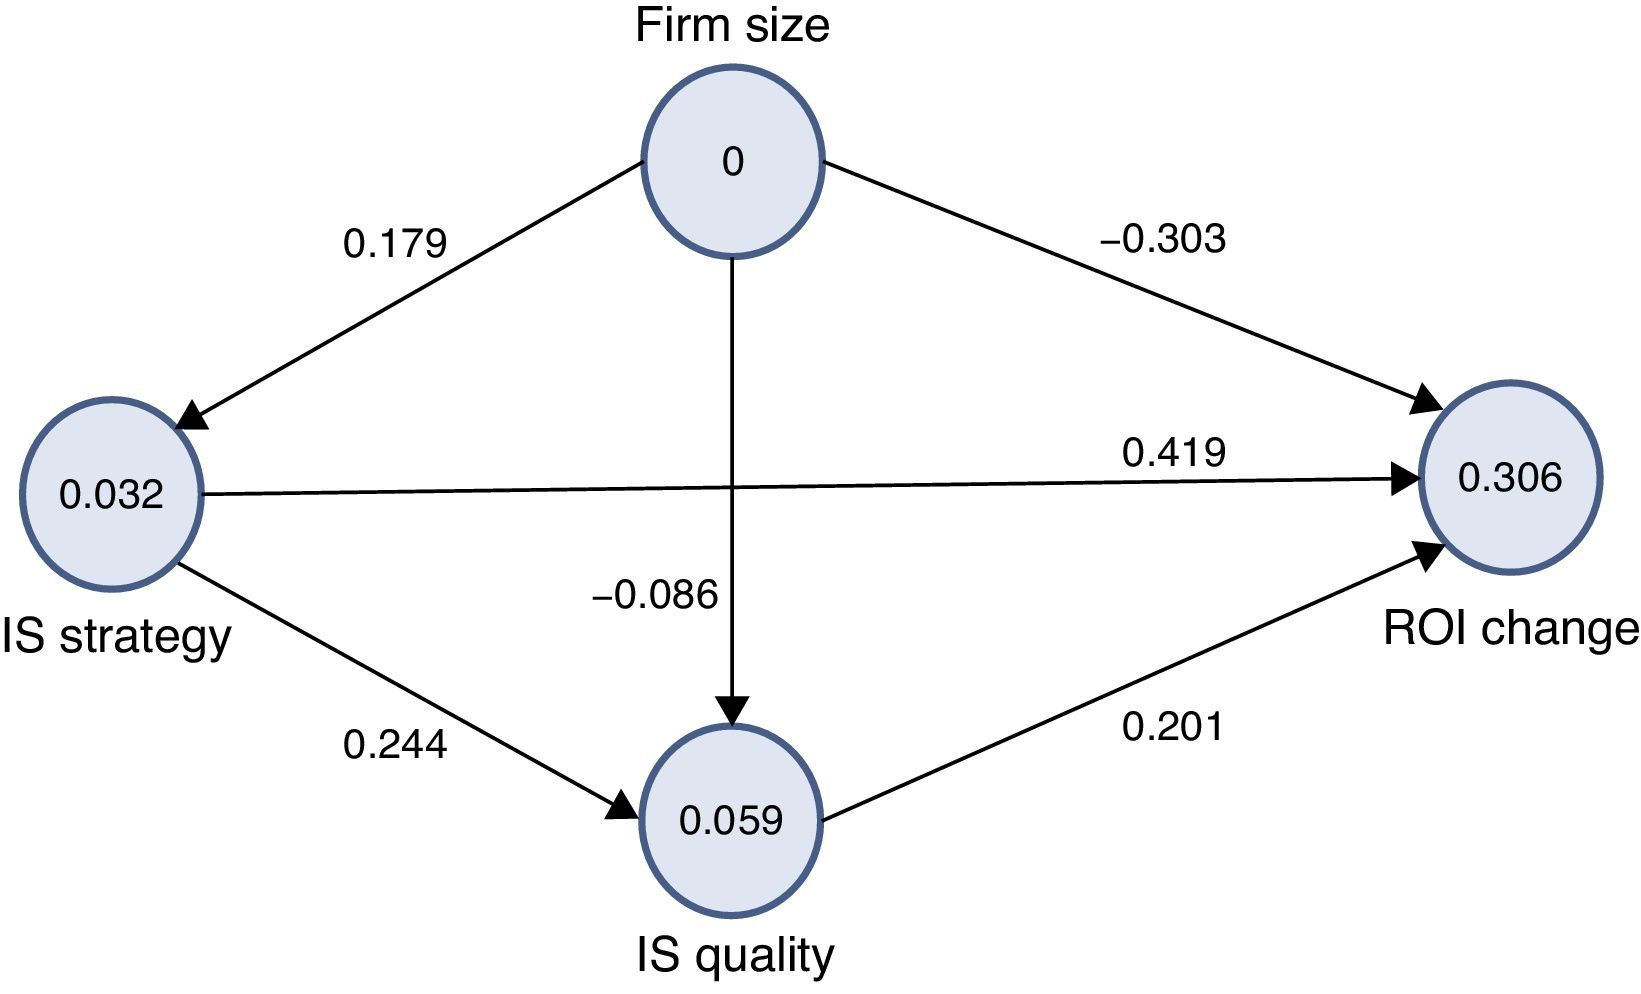
The model shows six relationships between factors or constructs. The factors represented by circles in Fig. 1 are not directly observable variables; they are obtained from indicators that are in turn responses to different questions in the questionnaire (except ROI change and firm size). The constructs employed and the indicators that comprise them are presented next. We use reflective indicators, which implies that the non-observed construct gives rise to observed indicators. The four constructs used in the model are factors F2 (IS quality) and F3 (IS strategy), identified in the principal component analysis (Table 3), and the following two:

Firm size. Formed by three indicators:
- -
FS 1. Ln of total assets at end of period.
- -
FS 2. Ln of sales at end of period.
- -
FS 3. Ln of number of employees at end of period.
ROI change. The change in financial performance throughout the period, integrated by ROI 1 change, ROI 2 change and ROI 3 change.
In the annex it may be seen that the requirements ensuring internal consistency (unidimensionality, reliability, convergent validity and discriminant validity) were met. Latent variables can then be used to test the relationships in the model.
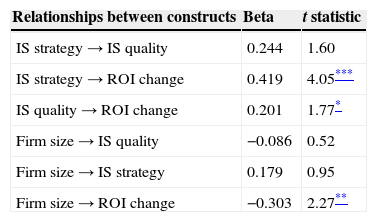
The structural model. R2 and BetasPLS is used to estimate the structural equations with the aid of the SmartPLS software (Ringle, Wende, & Will, 2005), which allows standardised Beta regression coefficients called “path coefficients” to be obtained. These coefficients test whether the proposed hypotheses are supported or not. R2 values measure the amount of variance of the construct that is explained by the model. The results of the estimation are shown in Fig. 1 and Table 6.
The R2 are shown in Fig. 1, within the circles. The R2 of the latent variable to be explained, ROI change, is 0.306. Table 6 shows the standardised path coefficients (these are also on the lines connecting the constructs in Fig. 1) and the Student's t values (obtained with a bootstrapping procedure with 500 samples).
Out of the 6 path coefficients of the model, two correspond to the hypotheses H1.1 and H1.2 already mentioned, while the remainder will be justified ahead.
The relationship between firm size and ROI changeAccording to several studies, increased firm size can help improve financial performance for a number of reasons: larger firms are more able to take advantage of economies of scale, regarding operating costs and the costs of innovation (Hardwick, 1997), while greater size means the possibility of more diversification of activities, allowing firms to cope more successfully with possible market changes, as well as with high risk situations (Goddard, Tavakoli, & Wilson, 2005; Winter, 1994). However, the conclusions of the various studies do not coincide in this respect, and researchers have yet to establish a clear relationship between profitability and size. González Pérez, Rodríguez, and Acosta Molina (2002) provide a review of the various Spanish studies grouped according to their conclusion regarding the relationship: positive, negative, or non-existent.
Relationship between firm size and IS strategyThe large firms are generally more complex and require more formalised, decentralised, specialised and integrated information systems (Mintzbert, 1979). These systems provide the firms with a greater degree of functional and organisational structure and coordination that aids in effective managerial decision-making (Hendricks, Hora, Menor, & Wiedman, 2012).
Relationship between IS strategy and IS qualityIn order to properly serve its purpose, IS strategy needs to be based on quality information. In fact, an IS strategy may be said to implicitly entail a quality IS, because otherwise it would hardly be strategic. Kearns and Sabherwal (2006) found business information technology strategic alignment to be positively associated with quality information technology.
Relationship between firm size and IS qualityLarge firms are organised in more complex ways, such that they are forced to use more sophisticated and better quality information systems in order to be able to meet their greater coordination and management needs. The firm size is an essential factor affecting the effectiveness of an IS (Mahmood, Hall, & Swanberg, 2001). IS satisfaction is greater in organisations that are large because smaller organisations tend to be less mature (Lees, 1987).
There are three non-significant path coefficients, namely those measuring the relationship between IS strategy and IS quality, the relationship between firm size and IS quality and the relationship between firm size and IS strategy.
As the remaining path coefficients are significant, the model results indicate that:
- –
IS strategy has a positive effect on ROI change.
- –
IS quality positively affects ROI change.
- –
In the analysed sample, size negatively affects the ROI change.
The results found with the PLS technique show that the IS strategic approach is the most striking factor in improving the business’ performance, which was previously mentioned when interpreting the difference in results between the high and medium clusters.
In order to analyse the effect of sector variations, a multigroup analysis should be carried out with the objective of identifying the differences in the proposed PLS model results between the two sectors that have been identified: industrial and non-industrial (services and commerce). Given the small sample of non-industrial firms (14), the multigroup analysis has been omitted. The PLS model has been replicated for the industrial firms subset (42 firms) and the results are similar to those obtained for the total sample, though it must be pointed out that the IS strategy – IS quality relation is found to be significant, while the IS strategy – ROI change positive effect also increases.
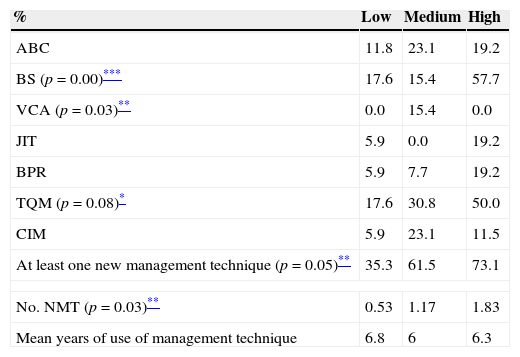
New management techniques and cluster groupsTable 7 allows us to check the level of use of NMTs in the three clusters, as well as the average number of techniques used and the average years of use of these techniques. The chi-square test (χ2) enables us to identify significant differences for the variables expressed as a percentage of use of different techniques, which correspond to the first 8 rows of Table 7, while for the last two variables, the non-parametric Kruskal–Wallis test applies.
Percentage use of new management techniques (NMT).
| % | Low | Medium | High |
|---|---|---|---|
| ABC | 11.8 | 23.1 | 19.2 |
| BS (p=0.00)*** | 17.6 | 15.4 | 57.7 |
| VCA (p=0.03)** | 0.0 | 15.4 | 0.0 |
| JIT | 5.9 | 0.0 | 19.2 |
| BPR | 5.9 | 7.7 | 19.2 |
| TQM (p=0.08)* | 17.6 | 30.8 | 50.0 |
| CIM | 5.9 | 23.1 | 11.5 |
| At least one new management technique (p=0.05)** | 35.3 | 61.5 | 73.1 |
| No. NMT (p=0.03)** | 0.53 | 1.17 | 1.83 |
| Mean years of use of management technique | 6.8 | 6 | 6.3 |
The results indicate that the firms from the high cluster use NMTs more than the rest. This result holds both for percentage of firms using at least one technique and for number of techniques employed per firm. The firms from the low cluster use the least number of techniques. In particular, the use of BS and TQM is significantly higher in the high cluster than in the other two clusters.
In order to consider the firms’ experience in using NMTs, we calculated the mean number of years each technique had been used in each firm, and then the mean for each cluster. But the results show no statistically significant differences among the three clusters in this variable.
Hypothesis 2Hypothesis 2 tests whether a positive relationship exists between use of NMTs and financial performance change. In view of the previous results, if the NMTs form part of a management system in which the information has strategic relevance, these techniques can contribute to improved financial performance. This is the case of the high cluster.
Using NMTs on their own, without a strategic perspective, may not have a positive effect on financial performance. This is what seems to be happening with the medium cluster, which uses NMTs more than the low cluster but has the worst financial performance. Most firms in the high cluster use BS, which seems to be an effective technique for implementing and controlling a strategy that improves financial performance. The effect of the IT on financial performance is not the same for all firms. It depends on the strategy chosen, perhaps due to the fact that IT and strategy are complementary in their effect on firms’ financial performance (Shin, 2006). In this line, Chan et al. (2006) find empirical evidence that use of IS for strategic purposes has a positive effect on a firm's financial performance, and Teo and Ang (1999) conclude that using IT for strategic purposes is one of the key success factors in management.
The results of the logistic regression that are presented below provide additional empirical evidence concerning Hypothesis 2.
Application of logistic regressionHaving found that the margins and profitabilities differ depending on the characteristics of the management IS that firms use, the task now is to determine if the different dimensions identified for the IS and the use of NMTs help explain the different margins and profitability change obtained by the firms. For this analysis, we used logistic regression.
The sample is ranked for each financial performance-change variable in increasing order, and the 28 cases with the lowest value are given 0, and the 28 cases with the highest value, 1 (except for operational costs over operational income, where the criterion adopted is the reverse).4 This results in a dichotomous variable for each of the financial performance-change variables, which are used as dependent variables in the subsequent logistic regression.
The logistic regression is a conditional probability model for calculating the probability of obtaining each value of a dichotomous dependent variable given a set of predictor variables (Hair et al., 1999).
We divide the sample firms into two groups depending on the value of a particular variable of performance change: half of the firms with high values (1) and the other half with low values (0). Thus a functional relation can be established for classifying the sample into each of the two groups. The aim is to identify the characteristics of the IS that serve to characterise the firms that obtain the best change in the financial performance.
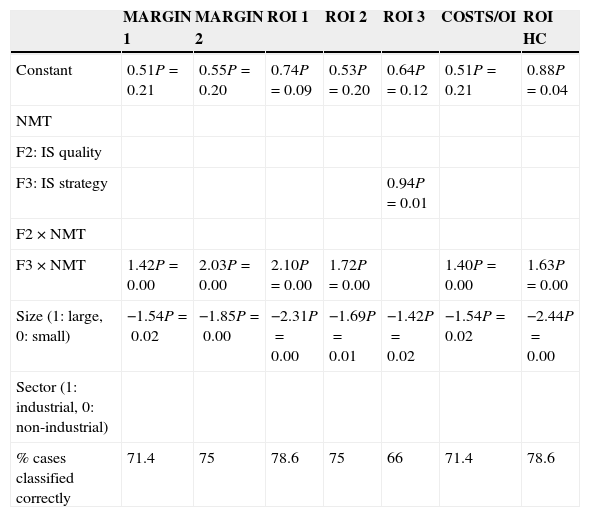
Results of logistic regressionThe following variables explain the financial performance ratio change. With a plus sign, IS strategy, interaction between NMTs (1: use at least one; 0: do not use any) and IS strategy; and with a minus sign, the firm size variable (Table 8). It should be noted that the effect of the interaction between the NMTs variable and IS strategy would be negative if NMTs were applied and IS strategy had a negative value (little relevance). These results are in line with the results above in the cluster analysis and with what was said about Hypothesis 1.
Logistic regression of profitability change variables.
| MARGIN 1 | MARGIN 2 | ROI 1 | ROI 2 | ROI 3 | COSTS/OI | ROI HC | |
|---|---|---|---|---|---|---|---|
| Constant | 0.51P=0.21 | 0.55P=0.20 | 0.74P=0.09 | 0.53P=0.20 | 0.64P=0.12 | 0.51P=0.21 | 0.88P=0.04 |
| NMT | |||||||
| F2: IS quality | |||||||
| F3: IS strategy | 0.94P=0.01 | ||||||
| F2×NMT | |||||||
| F3×NMT | 1.42P=0.00 | 2.03P=0.00 | 2.10P=0.00 | 1.72P=0.00 | 1.40P=0.00 | 1.63P=0.00 | |
| Size (1: large, 0: small) | −1.54P=0.02 | −1.85P=0.00 | −2.31P=0.00 | −1.69P=0.01 | −1.42P=0.02 | −1.54P=0.02 | −2.44P=0.00 |
| Sector (1: industrial, 0: non-industrial) | |||||||
| % cases classified correctly | 71.4 | 75 | 78.6 | 75 | 66 | 71.4 | 78.6 |
NMT: 1: use at least one, 0: do not use any.
In this study we have obtained valuations about different aspects of management IS from the CFOs of a sample of Spanish firms. We ran a cluster analysis which identified three types of firm that differ in the scores given to two factors that characterise the IS: IS quality and IS strategy.
The group of firms with the highest scores in the two dimensions considered obtains the best improvement in relative profitability over the period analysed. At the same time, these firms also use NMTs more than the rest.
The group of firms with intermediate scores in the set of two factors is of particular interest since these firms perform the worst in terms of financial results change. This has to do with the fact that the firms in this cluster have the lowest score in terms of IS strategy.
The PLS model shows the positive effect that IS strategy has on firm's financial results. The IS quality also has a positive association with improved financial results, but the effect of IS strategy is more important and significant.
The results from a logistic regression analysis show a positive effect of NMTs on profitability improvement as long as they form part of an IS with a high strategic relevance. These results are in line with those of previous studies (Braam & Nijssen, 2004; Chan et al., 2006; Teo & Ang, 1999).
The results of this study have significant implications for companies as investment in new IS and management techniques should be done with strategic direction, aligning said tools with business strategy, which requires a high level of involvement on the part of companies’ managers. The profitability of the IS depends on its utility to manage and improve key strategic areas of the business (Ravichandran & Lertwongsatien, 2005). In this sense, it requires proper planning when designing and investing in IS, in order to ensure their quality and relevance to the development of business strategy (Byrd et al., 2006).
Finally, this work suffers from a number of limitations and there are possible lines of development that should be considered in future research:
- –
The sample is small, so the conclusions should be taken with caution.
- –
Future research should include other variables not available through the questionnaire used here, and which conceivably affect the firm's internal management system, such as: level of support of top management; resistance to change among users; employees’ educational background; and perceived need for more-sophisticated management IS among managers and management accountants. Additionally, given that companies are in a dynamic environment, studies are needed to collect the effects of new variables of IS and their evolution.
- –
The work refers to a time period (1996–2004) prior to the current economic crisis. It would be of great interest to carry out an investigation for the period immediately afterwards until present, in order to know how the different variables that make up the IS affect the firms’ performance.
The authors declare no conflict of interest.
The authors wish to thank anonymous reviewers for their comments and suggestions.
The measurement model includes the relationships between each construct and its indicators and is based on the calculation of the principal components. The constructs must fulfil certain internal consistency properties: unidimensionality, reliability, convergent validity and discriminant validity.
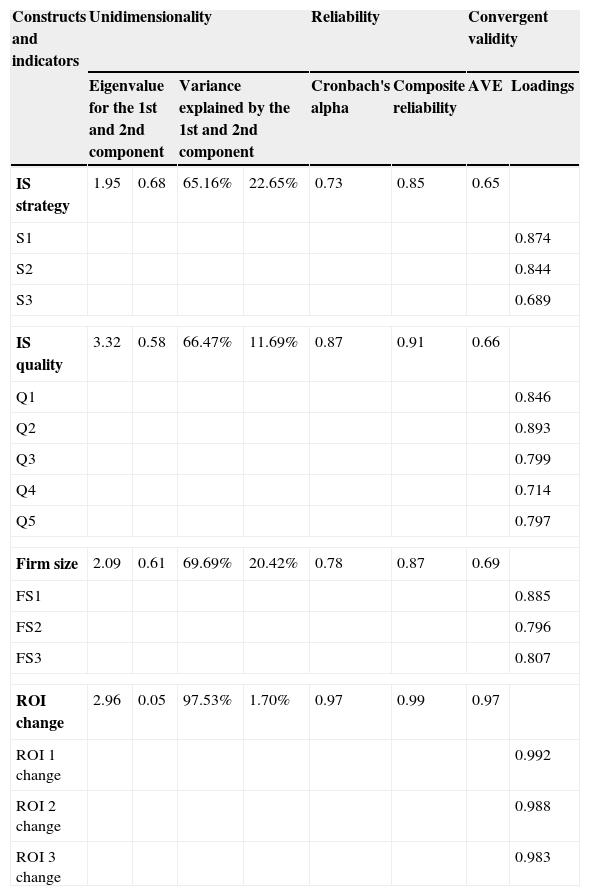
Unidimensionality. A principal component analysis is carried out for each construct, subsequently applying Kaiser's criterion (Kaiser, 1960), such that the eigenvalue is greater than 1 only for the first principal component. A different principal component analysis was carried out for each construct. Another important factor is the percentage of variance explained: the first component being required to explain most of the variance. Table A.1 shows that the requirement of unidimensionality is met for all the constructs analysed.
Unidimensionality, reliability and convergent validity.
| Constructs and indicators | Unidimensionality | Reliability | Convergent validity | |||||
|---|---|---|---|---|---|---|---|---|
| Eigenvalue for the 1st and 2nd component | Variance explained by the 1st and 2nd component | Cronbach's alpha | Composite reliability | AVE | Loadings | |||
| IS strategy | 1.95 | 0.68 | 65.16% | 22.65% | 0.73 | 0.85 | 0.65 | |
| S1 | 0.874 | |||||||
| S2 | 0.844 | |||||||
| S3 | 0.689 | |||||||
| IS quality | 3.32 | 0.58 | 66.47% | 11.69% | 0.87 | 0.91 | 0.66 | |
| Q1 | 0.846 | |||||||
| Q2 | 0.893 | |||||||
| Q3 | 0.799 | |||||||
| Q4 | 0.714 | |||||||
| Q5 | 0.797 | |||||||
| Firm size | 2.09 | 0.61 | 69.69% | 20.42% | 0.78 | 0.87 | 0.69 | |
| FS1 | 0.885 | |||||||
| FS2 | 0.796 | |||||||
| FS3 | 0.807 | |||||||
| ROI change | 2.96 | 0.05 | 97.53% | 1.70% | 0.97 | 0.99 | 0.97 | |
| ROI 1 change | 0.992 | |||||||
| ROI 2 change | 0.988 | |||||||
| ROI 3 change | 0.983 | |||||||
Reliability. This measures the consistency of the indicators that make up the construct; i.e., the indicators should be measuring the same concept. Cronbach's alpha (Cronbach, 1970) and the composite reliability (Werts, Linn, & Jöreskog, 1974) are calculated, ranging from 0 (absence of homogeneity) to 1 (maximum homogeneity). Cronbach's alpha assumes a priori that each indicator of a construct contributes in the same way, while the composite reliability uses the loadings of items as they exist in the causal model. When speaking of reliability, the usual requirement is that the values of both indices should be above 0.7. It can be seen in Table A.1 that these indices exceed this minimum threshold in all cases.
Convergent validity. This is the degree to which the indicators reflect the construct. The Average Variance Extracted (AVE) was calculated, which indicates the extent to which the construct variance can be explained by the chosen indicators (Fornell & Larcker, 1981). The minimum recommended value is 0.5 (Baggozi & Yi, 1988), which means that over 50% of the variance of the construct is due to its indicators. Table A.1 shows that the AVE of all the latent variables exceeds the value of 0.5.
A second approach to analysing the fulfilment of convergent validity is to check that the factorial loadings of the principal component matrix are greater than 0.5 for each of the indicators (Jöreskog & Sörbom, 1993) or that they are above 0.7 according to some authors (Chin, 1998). The last column of Table A.1 shows that the aforementioned criterion is met in all cases.
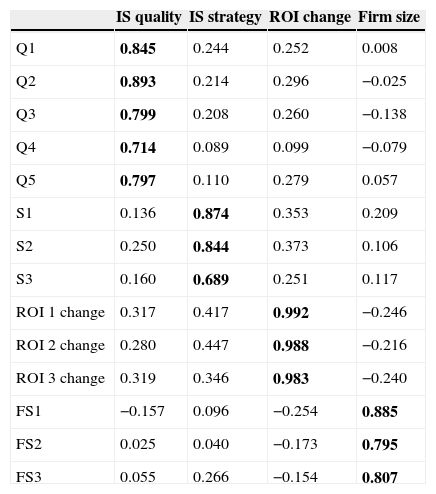
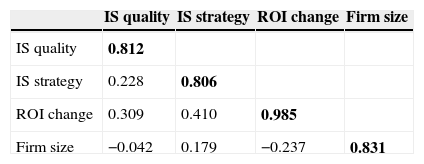
Discriminant validity. This means that each construct should be significantly different from the other constructs. A factorial loadings matrix was obtained to analyse the discriminant validity, as well as the cross-factor loadings. The factorial loadings are Pearson correlation coefficients between the indicators and their own construct. The cross-factor loadings are Pearson correlation coefficients between the indicators and the other constructs. The factorial loadings should be greater than the cross-factor loadings. Therefore, the indicators should be more closely correlated with their own construct than with the other constructs. This criterion is met in the proposed model, as shown in Table A.2.
Factorial loadings matrix.
| IS quality | IS strategy | ROI change | Firm size | |
|---|---|---|---|---|
| Q1 | 0.845 | 0.244 | 0.252 | 0.008 |
| Q2 | 0.893 | 0.214 | 0.296 | −0.025 |
| Q3 | 0.799 | 0.208 | 0.260 | −0.138 |
| Q4 | 0.714 | 0.089 | 0.099 | −0.079 |
| Q5 | 0.797 | 0.110 | 0.279 | 0.057 |
| S1 | 0.136 | 0.874 | 0.353 | 0.209 |
| S2 | 0.250 | 0.844 | 0.373 | 0.106 |
| S3 | 0.160 | 0.689 | 0.251 | 0.117 |
| ROI 1 change | 0.317 | 0.417 | 0.992 | −0.246 |
| ROI 2 change | 0.280 | 0.447 | 0.988 | −0.216 |
| ROI 3 change | 0.319 | 0.346 | 0.983 | −0.240 |
| FS1 | −0.157 | 0.096 | −0.254 | 0.885 |
| FS2 | 0.025 | 0.040 | −0.173 | 0.795 |
| FS3 | 0.055 | 0.266 | −0.154 | 0.807 |
A second criterion for verifying the discriminant validity is to check that the square root of the AVE of the construct is greater than the correlation between that construct and all the others (Chin, 1998). Table A.3 shows the correlation coefficients between the constructs. The square root of the AVE is shown on the diagonal. The condition of discriminant validity is also met following this criterion.
Furthermore, for Bagozzi (1994) the correlations between the different factors that make up the model should not be higher than 0.8, as occurs in this case.
SPSS 19.0 and SmartPLS 2.0 were used for the statistical analyses.
Before elaborating the final questionnaire, a pilot questionnaire was sent to five companies, asking who the most appropriate person to answer it was. In all the cases, the answer was the CFO. In the SMEs, as with the companies of the sample, the CFO is the person in charge of the IS as its main user.
This procedure has been used earlier, for example in studies predicting firm failure (Izan, 1984; Platt and Platt, 1990), or analysing profitability (De Andrés Suárez, 2000; Fernández Sánchez, Montes Peón, & Vázquez Ordás, 1996).
In various studies that examine firms based on their level of profitability the authors remove the middle 50% of the sample, and run their analysis on the two extreme profitability quartiles in an attempt to define the characteristics of high and low profitability (De Andrés Suárez, 2000). In other studies the researchers take as high- and low-profitability groups the areas outside an interval of plus/minus various percentage points around the mean sector profitability (Fernández Sánchez et al., 1996). The current authors are working with a relatively small sample (56 cases), so chose to not omit any cases.

www.publicationethics.org.