


To evaluate the relationship of body composition indexes with altered metabolic analytical parameters that show higher risk of cardiovascular disease in young adults.
Material and methodsA cross-sectional study. Sample of 1351 young adults, different body composition parameters were obtained such as Waist Circumference (WC), Hip Circumference (HC), Body Mass Index (BMI), Body Fat% (BF%), Waist-to-height Ratio (WHtR), and Waist-Hip Ratio (WHR), conicity index (C-Index), body surface area (BSA), abdominal volume index (AVI) and deep abdominal adipose-tissue (AT). Areas under receiver operating characteristic curves (AUCs) and odds ratios for the parameters were analyzed and their optimal cut-offs. Separately a MANOVA was applied to altered metabolic analytical parameters and two body composition indexes (BMI and BSA) and their interaction.
ResultsBMI correlate significantly with metabolic analytical parameters (FPG r=0.08, TCh r=0.14, TGL r=0.23, HDL-C r=−0.23, LDL-C r=0.2, UA r=0.22, All P<0.01), BSA correlate with all (All P<0.001) except FPG. BMI and BSA correlate significantly with all metabolic analytical parameters (All P<0.001). The BMI individually predicts the changes of the six metabolic analytical parameters as a set [Wilk's λ=0.89, F(18,1570)=3.4, P<0.0001], but not BSA [Wilk's λ=0.98, F(6,555)=1.4, P=0.18], the interaction between these two indexes (BMI and BSA altered in the same individual) significantly predicts changes of the six metabolic analytical parameters of cardiovascular disease risk [Wilk's λ=0.97, F(6,555)=2.3, P=0.03].
ConclusionsBMI and BSA correlate with cardiovascular disease risk factor. They are superior to WC, WHtR, WHR, BF%, C-index, AVI and AT.
Evaluar la relación de los índices de composición corporal con los parámetros analíticos metabólicos alterados que muestran mayor riesgo de enfermedad cardiovascular en adultos jóvenes.
Material y métodosEstudio transversal. Muestra de 1.351 adultos jóvenes, se obtuvieron diferentes parámetros de composición corporal: circunferencia de cintura (WC), circunferencia de cadera (HC), índice de masa corporal (IMC), % de grasa corporal (BF%), índice cintura-altura (WHtR) e índice cintura-cadera (WHR), índice de conicidad (C-index), superficie corporal (BSA), índice de volumen abdominal (AVI) y tejido adiposo abdominal profundo (AT). Se analizaron áreas bajo la curva y razones de momios de los parámetros y sus puntos de corte óptimos. Se aplicó un MANOVA por separado a los parámetros analíticos metabólicos alterados y 2 índices de composición corporal (IMC y BSA) y su interacción.
ResultadosEl IMC se correlacionó con los parámetros analíticos metabólicos (FPG r=0,08, TCh r=0,14, TGL r=0,23, HDL-C r=−0,23, LDL-C r=0,2, UA r=0,22; todos p<0,01), BSA correlacionó con todos (p<0,001) menos con FPG. El IMC, por sí solo, predice los cambios en los 6 parámetros analíticos metabólicos del riesgo de enfermedad cardiovascular en conjunto (Wilk's λ=0,89, F [18,1570]=3,4; p<0,0001), pero no la BSA (Wilk's λ=0,98, F [6,555]=1,4; p=0,18), la interacción entre estos 2 índices (IMC y BSA alterados en el mismo individuo) predice significativamente los cambios de los 6 componentes metabólicos (Wilk's λ=0,97, F [6,555]=2,3; p=0,03).
ConclusionesEl IMC y la BSA están relacionados con los factores de riesgo de enfermedad cardiovascular. Son superiores a WC, WHtR, WHR, BF%, C-index, AVI y AT.
Central obesity is known as a factor in the development of diabetes and atherosclerosis.1 There are different ways to determine the central obesity, being the waist circumference (WC), or waist–hip ratio, the most used (WHR). It is common to associate the anthropometric parameters of body composition with the development of different metabolic disorders, such as diabetes mellitus type 2 (DM2), ischemic heart disease or gout.1 The waist to height ratio (WHtR) has been shown to be one of the best predictors of metabolic alterations.2 Considering the cut-off at 0.5.2,3 Studies have concluded that WHtR shows an active link with the risk of CVD.4
Although BMI is considered an index of total obesity, several studies3,5 have shown that both total obesity rates and those of central obesity do not differ significantly of their cardiovascular risk predictive capabilities.
On the other hand, there are other anthropometric parameters of body composition and central obesity studies concerning the prediction of metabolic or cardiovascular risk alterations. The conicity index (C-Index) is a useful relationship for the detection of central obesity, and its usefulness for predicting alterations in blood pressure, insulin, and triglyceride levels6 has been studied. Thus, it has been found to be an excellent predictor of cardiovascular risk. The body surface area (BSA) is a parameter of body composition that has been used together with other parameters to determine usual physiological standards,7 or the prediction of coronary artery disease.8 The relationship of BSA with cardiovascular risk factors or metabolic alterations is little known. The abdominal volume index (AVI) is another anthropometric parameter of central obesity associated with glucose intolerance and DM2, risk factors for cardiovascular disease.9 The deep abdominal adipose-tissue (AT) is associated with the development of metabolic syndrome, and metabolic alterations.10 This tissue may be estimated from anthropometric measurements,11 suggesting that AT is another parameter of central obesity that can be associated with cardiovascular disease.
All the indexes mentioned above of body composition have been studied mostly in two central populations, infantile and adult, but research in the population of young adults is little. Therefore, the objective of this study was to evaluate the relationship of body composition indexes with altered metabolic analytical parameters that show higher risk of cardiovascular disease in young adults.
Material and methodsStudy design and participantsThis study was approved by the Ethics and Research Committee of School of Medicine of the Benemérita Universidad Autónoma de Puebla, with the number 279. A cross-sectional study was conducted with sample of 1351 young adults, from August 2015 to June 2016, from a universe of 6000 newly-enrolled students from a higher education institution (HEI) in the city of Puebla, Pue.
The inclusion criteria were: fasting of 12–14h, an age of 18–22 years, to have informed consent. Those who did not want to continue the study or who had samples of hemolyzed or lipemic serum were excluded. The individuals presented themselves within the facilities of Biochemistry Department, where they were made taking anthropometric variables (weight, height, waist and hip circumference), and preparation of your clinical history.
VariablesAnthropometrical analysisCertified clinicians (ISAK 1) measured weight and height, and equally standardized instruments were used. Every participant wore light clothing. Weight measurement had an accuracy of 100g and height to 0.1cm WC was measured at the midpoint between the lower edge of the rib cage and the iliac crest. The Hip Circumference (HC) was measured in the most prominent part of the hip. BMI was then calculated as weight (kg) divided by height squared (m2). The calculation of BF% was made from the Deuremberg12 formula [body fat percentage: (1.2*BMI)+(0.23*age in years)−(10.8*gender)−5.4, where gender=0 for women and 1 for men]. WHtR was calculated as WC divided by height. WHR was calculated as WC divided by HC.
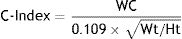
The Weight (Wt) in kg, WC in centimeters (cm), and the height (Ht) in meters (m) were used to calculate C-Index, with the following formula6:
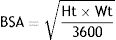
The body surface area (BSA) was determined13 (where the Ht is in cm) by:
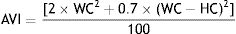
Abdominal volume index (AVI) was determined9 by:
The deep abdominal adipose-tissue (AT) was determined11 by:

BMI and waist-hip ratio were interpreted according to the WHO for adults14 and the WHtR according to Maffeis et al., 2008.4 The C-Index, BSA, AVI and AT were not interpreted until the receiver operating characteristic curves analysis, the cut-off point was obtained.
Biochemical analysisGlucose, triglycerides, total cholesterol, high-density lipoprotein cholesterol (HDL-C), low-density lipoprotein cholesterol (LDL-C) and uric acid (UA) were determined in a VITROS DT60 II analyzer.
Cardiovascular disease risk factorsThe cardiovascular disease risk factors were defined by altered metabolic analytical parameters like hyperglycemia (FPG≥100mg/dL), high ChT (ChT≥200), high TGL (TG≥150mg/dL), low HDL-C (HDL-C<40mg/dL in men or <50mg/dL in women), high LDL-C (LDL≥100mg/dL); in accordance with National Cholesterol Education Program, Adult Treatment Panel (USNCEP-ATP) III guideline.15 High UA was defined when patients had serum uric acid levels more than 7.2mg/dl in males and more than 6.0mg/dl in females.
Statistical methodsAnalyzes were made in the statistical package SPSS v.21 for Mac. The continuous variables are shown as mean±standard deviation (SD). The normality of the variables was analyzed by a Kolmogorov-Smirnov statistic, as well as by the expected values in Q-Q graphs. All the comparison in quantitative variables was performed using a parametric test, Student's t-test. Pearson's correlation coefficients were used to assess the interrelationship between the obesity indexes and altered metabolic analytical parameters of cardiovascular disease risk. Receiver operating characteristic (ROC) curves were constructed and cut-off points were determined to evaluate the accuracy of each indexes of body composition as predictors of metabolic components of cardiovascular disease risk. The risk of metabolic alterations from body composition was determined by OR at 95% confidence intervals; C-Indexes, BSA, AVI, AT, use the cut-off points generated by ROC curve to determine the OR. A two-sided level of significance of 0.05 was used to reject null hypothesis.
A multivariate analysis of variance (MANOVA) was separately applied to the altered metabolic analytical parameters of cardiovascular disease risk, and the two body composition indexes (BMI and BSA) and their interaction included as predictors, and then a multiple linear regression analysis to BMI and BSA was performed. Prediction models were used to observe the change in the metabolic analytical parameters of cardiovascular disease risk when there is an increase in this body composition indexes (BMI and BSA).
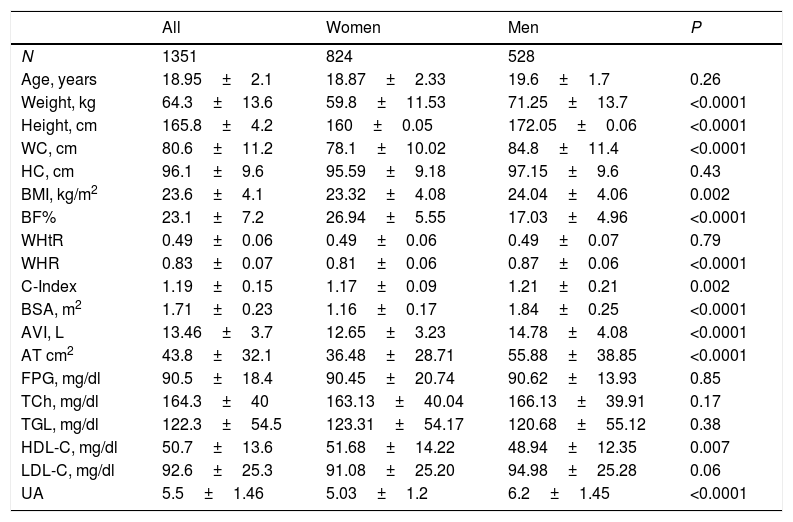
ResultsParticipantsThe essential characteristics of the study sample (Table 1) were compared between women and men. The average age ranged between 18 and 19 years for women and men respectively. Weight, height, WC, BMI, %BF, WHR, C-index, BSA, AVI, and AT, were statistically different in men and women (All P<0.0001), being higher in men than in women, except the %BF, which was higher in women than men. WHtR was identical in both genders. Regarding the metabolic component, only, HDL-C (P 0.007), and UA (P<0.0001) were statistically different in men and women.
Basic characteristics of the study sample by gender.
| All | Women | Men | P | |
|---|---|---|---|---|
| N | 1351 | 824 | 528 | |
| Age, years | 18.95±2.1 | 18.87±2.33 | 19.6±1.7 | 0.26 |
| Weight, kg | 64.3±13.6 | 59.8±11.53 | 71.25±13.7 | <0.0001 |
| Height, cm | 165.8±4.2 | 160±0.05 | 172.05±0.06 | <0.0001 |
| WC, cm | 80.6±11.2 | 78.1±10.02 | 84.8±11.4 | <0.0001 |
| HC, cm | 96.1±9.6 | 95.59±9.18 | 97.15±9.6 | 0.43 |
| BMI, kg/m2 | 23.6±4.1 | 23.32±4.08 | 24.04±4.06 | 0.002 |
| BF% | 23.1±7.2 | 26.94±5.55 | 17.03±4.96 | <0.0001 |
| WHtR | 0.49±0.06 | 0.49±0.06 | 0.49±0.07 | 0.79 |
| WHR | 0.83±0.07 | 0.81±0.06 | 0.87±0.06 | <0.0001 |
| C-Index | 1.19±0.15 | 1.17±0.09 | 1.21±0.21 | 0.002 |
| BSA, m2 | 1.71±0.23 | 1.16±0.17 | 1.84±0.25 | <0.0001 |
| AVI, L | 13.46±3.7 | 12.65±3.23 | 14.78±4.08 | <0.0001 |
| AT cm2 | 43.8±32.1 | 36.48±28.71 | 55.88±38.85 | <0.0001 |
| FPG, mg/dl | 90.5±18.4 | 90.45±20.74 | 90.62±13.93 | 0.85 |
| TCh, mg/dl | 164.3±40 | 163.13±40.04 | 166.13±39.91 | 0.17 |
| TGL, mg/dl | 122.3±54.5 | 123.31±54.17 | 120.68±55.12 | 0.38 |
| HDL-C, mg/dl | 50.7±13.6 | 51.68±14.22 | 48.94±12.35 | 0.007 |
| LDL-C, mg/dl | 92.6±25.3 | 91.08±25.20 | 94.98±25.28 | 0.06 |
| UA | 5.5±1.46 | 5.03±1.2 | 6.2±1.45 | <0.0001 |
P values were calculated by Unpaired Student's t-test.
WC: waist circumference, HC: hip circumference, BMI: body mass index, BF%: body fat percent, WHtR: waist-height ratio, WHR: waist-hip ratio, C-Index: conicity index, BSA: body surface area, AVI: abdominal volume index, AT: deep abdominal adipose-tissue, FPG: fasting plasma glucose, TCh: total cholesterol, TGL: triglyceride, HDL-C: high-density lipoprotein cholesterol, LDL-C: low-density lipoprotein cholesterol, UA: uric acid.
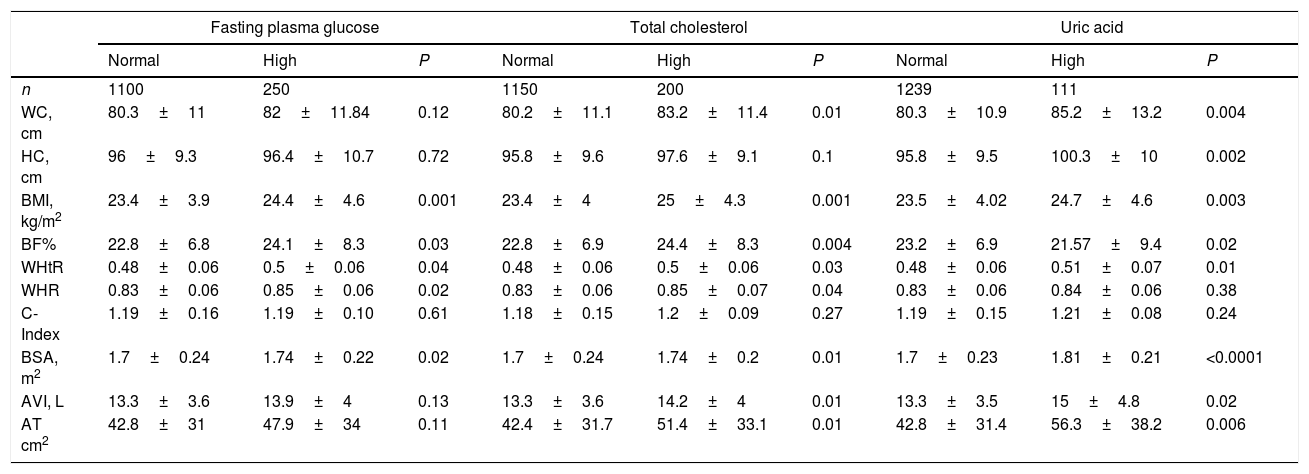
All body composition indexes were analyzed between those subjects who had a metabolic alteration and those who showed standard parameters in each component (Table 2). Subjects with high fasting plasma glucose (FPG), showed an increase in BMI, BF%, WHtR, WHR, and the BSA (All P<0.05). Regarding high total cholesterol (TCh), only the HC and C-index did not show statistically significant differences. Subjects with high UA had higher WC, HC, BMI, BF%, WHtR, BSA, AVI, and AT (All P<0.05), than those with normal UA values.
Body composition indexes in subjects with alterations in, cholesterol and uric acid, and in those without alterations.
| Fasting plasma glucose | Total cholesterol | Uric acid | |||||||
|---|---|---|---|---|---|---|---|---|---|
| Normal | High | P | Normal | High | P | Normal | High | P | |
| n | 1100 | 250 | 1150 | 200 | 1239 | 111 | |||
| WC, cm | 80.3±11 | 82±11.84 | 0.12 | 80.2±11.1 | 83.2±11.4 | 0.01 | 80.3±10.9 | 85.2±13.2 | 0.004 |
| HC, cm | 96±9.3 | 96.4±10.7 | 0.72 | 95.8±9.6 | 97.6±9.1 | 0.1 | 95.8±9.5 | 100.3±10 | 0.002 |
| BMI, kg/m2 | 23.4±3.9 | 24.4±4.6 | 0.001 | 23.4±4 | 25±4.3 | 0.001 | 23.5±4.02 | 24.7±4.6 | 0.003 |
| BF% | 22.8±6.8 | 24.1±8.3 | 0.03 | 22.8±6.9 | 24.4±8.3 | 0.004 | 23.2±6.9 | 21.57±9.4 | 0.02 |
| WHtR | 0.48±0.06 | 0.5±0.06 | 0.04 | 0.48±0.06 | 0.5±0.06 | 0.03 | 0.48±0.06 | 0.51±0.07 | 0.01 |
| WHR | 0.83±0.06 | 0.85±0.06 | 0.02 | 0.83±0.06 | 0.85±0.07 | 0.04 | 0.83±0.06 | 0.84±0.06 | 0.38 |
| C-Index | 1.19±0.16 | 1.19±0.10 | 0.61 | 1.18±0.15 | 1.2±0.09 | 0.27 | 1.19±0.15 | 1.21±0.08 | 0.24 |
| BSA, m2 | 1.7±0.24 | 1.74±0.22 | 0.02 | 1.7±0.24 | 1.74±0.2 | 0.01 | 1.7±0.23 | 1.81±0.21 | <0.0001 |
| AVI, L | 13.3±3.6 | 13.9±4 | 0.13 | 13.3±3.6 | 14.2±4 | 0.01 | 13.3±3.5 | 15±4.8 | 0.02 |
| AT cm2 | 42.8±31 | 47.9±34 | 0.11 | 42.4±31.7 | 51.4±33.1 | 0.01 | 42.8±31.4 | 56.3±38.2 | 0.006 |
P values were calculated by Unpaired Student's t-test.
WC: waist circumference, HC: hip circumference, BMI: body mass index, BF%: body fat percent, WHtR: waist-height ratio, WHR: waist-hip ratio, C-Index: conicity index, BSA: body surface area, AVI: abdominal volume index, AT: deep abdominal adipose-tissue.
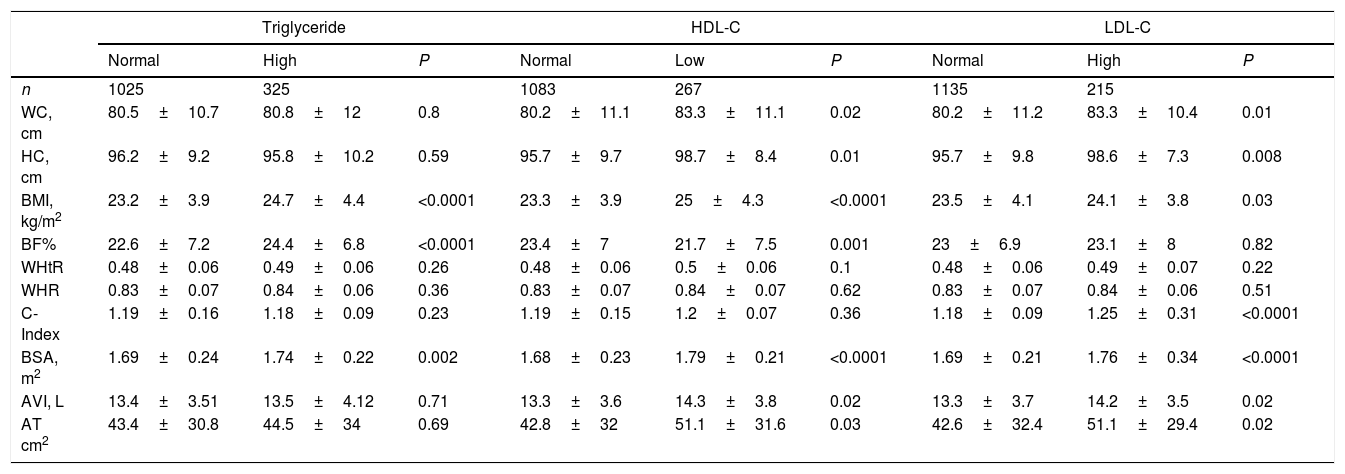
Subjects with high triglycerides had higher BMI and BF% (All P<0.0001), the BSA also was higher in subjects with alteration in the TGL. Alterations in lipoproteins also showed differences in body composition indexes. Subjects with Low HDL-C and high LDL-C had higher values in the WC, HC, BMI, BSA, AVI and AT (All P<0.05), the BF% was increased only in subjects with Low HDL-C, and the C-Index was high only in those with high LDL-C (Table 3).
Body composition indexes in subjects with alterations in triglyceride, HDL-C, LDL-C, and in those without alterations.
| Triglyceride | HDL-C | LDL-C | |||||||
|---|---|---|---|---|---|---|---|---|---|
| Normal | High | P | Normal | Low | P | Normal | High | P | |
| n | 1025 | 325 | 1083 | 267 | 1135 | 215 | |||
| WC, cm | 80.5±10.7 | 80.8±12 | 0.8 | 80.2±11.1 | 83.3±11.1 | 0.02 | 80.2±11.2 | 83.3±10.4 | 0.01 |
| HC, cm | 96.2±9.2 | 95.8±10.2 | 0.59 | 95.7±9.7 | 98.7±8.4 | 0.01 | 95.7±9.8 | 98.6±7.3 | 0.008 |
| BMI, kg/m2 | 23.2±3.9 | 24.7±4.4 | <0.0001 | 23.3±3.9 | 25±4.3 | <0.0001 | 23.5±4.1 | 24.1±3.8 | 0.03 |
| BF% | 22.6±7.2 | 24.4±6.8 | <0.0001 | 23.4±7 | 21.7±7.5 | 0.001 | 23±6.9 | 23.1±8 | 0.82 |
| WHtR | 0.48±0.06 | 0.49±0.06 | 0.26 | 0.48±0.06 | 0.5±0.06 | 0.1 | 0.48±0.06 | 0.49±0.07 | 0.22 |
| WHR | 0.83±0.07 | 0.84±0.06 | 0.36 | 0.83±0.07 | 0.84±0.07 | 0.62 | 0.83±0.07 | 0.84±0.06 | 0.51 |
| C-Index | 1.19±0.16 | 1.18±0.09 | 0.23 | 1.19±0.15 | 1.2±0.07 | 0.36 | 1.18±0.09 | 1.25±0.31 | <0.0001 |
| BSA, m2 | 1.69±0.24 | 1.74±0.22 | 0.002 | 1.68±0.23 | 1.79±0.21 | <0.0001 | 1.69±0.21 | 1.76±0.34 | <0.0001 |
| AVI, L | 13.4±3.51 | 13.5±4.12 | 0.71 | 13.3±3.6 | 14.3±3.8 | 0.02 | 13.3±3.7 | 14.2±3.5 | 0.02 |
| AT cm2 | 43.4±30.8 | 44.5±34 | 0.69 | 42.8±32 | 51.1±31.6 | 0.03 | 42.6±32.4 | 51.1±29.4 | 0.02 |
P values were calculated by Unpaired Student's t-test.
WC: waist circumference, HC: hip circumference, BMI: body mass index, BF%: body fat percent, WHtR: waist-height ratio, WHR: waist-hip ratio, C-Index: conicity index, BSA: body surface area, AVI: abdominal volume index, AT: deep abdominal adipose-tissue, HDL-C: high-density lipoprotein cholesterol, LDL-C: low-density lipoprotein cholesterol.
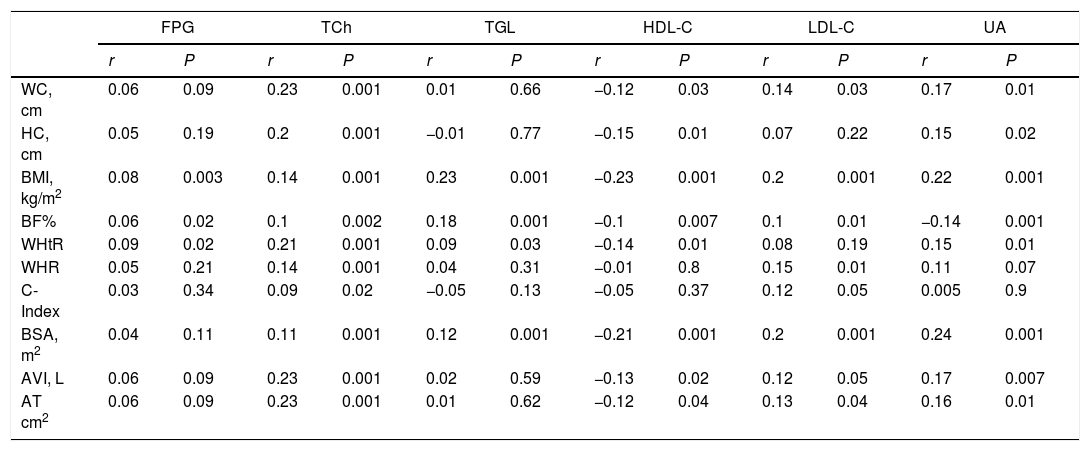
The correlation analysis showed that all body composition indexes had a high connection with each other, but only the BMI was correlated significantly with all metabolic analytical parameters of cardiovascular disease risk (All P<0.001). All body composition indexes were correlated weekly with TCh (All P<0.01). Apart from the BMI, the BF% (P=0.001), WHtR (P=0.03) and BSA (P=0.001) were correlated with TGL. The HDL-C was correlated negatively with all the body compositional indexes except with de WHR and C-Index. The LDL was correlated with all indexes except with HC and WHtR; C-index and AVI had no statistical significance, but they did present a correlation (r=0.12). Regarding UA, the WHR and C-index were not correlated with this metabolic analytical parameter. From all the indexes, BMI and BSA had the highest correlations with the metabolic analytical parameters of cardiovascular disease risk (Table 4).
Pearson's correlation coefficients (r) between the body composition indexes and metabolic components.
| FPG | TCh | TGL | HDL-C | LDL-C | UA | |||||||
|---|---|---|---|---|---|---|---|---|---|---|---|---|
| r | P | r | P | r | P | r | P | r | P | r | P | |
| WC, cm | 0.06 | 0.09 | 0.23 | 0.001 | 0.01 | 0.66 | −0.12 | 0.03 | 0.14 | 0.03 | 0.17 | 0.01 |
| HC, cm | 0.05 | 0.19 | 0.2 | 0.001 | −0.01 | 0.77 | −0.15 | 0.01 | 0.07 | 0.22 | 0.15 | 0.02 |
| BMI, kg/m2 | 0.08 | 0.003 | 0.14 | 0.001 | 0.23 | 0.001 | −0.23 | 0.001 | 0.2 | 0.001 | 0.22 | 0.001 |
| BF% | 0.06 | 0.02 | 0.1 | 0.002 | 0.18 | 0.001 | −0.1 | 0.007 | 0.1 | 0.01 | −0.14 | 0.001 |
| WHtR | 0.09 | 0.02 | 0.21 | 0.001 | 0.09 | 0.03 | −0.14 | 0.01 | 0.08 | 0.19 | 0.15 | 0.01 |
| WHR | 0.05 | 0.21 | 0.14 | 0.001 | 0.04 | 0.31 | −0.01 | 0.8 | 0.15 | 0.01 | 0.11 | 0.07 |
| C-Index | 0.03 | 0.34 | 0.09 | 0.02 | −0.05 | 0.13 | −0.05 | 0.37 | 0.12 | 0.05 | 0.005 | 0.9 |
| BSA, m2 | 0.04 | 0.11 | 0.11 | 0.001 | 0.12 | 0.001 | −0.21 | 0.001 | 0.2 | 0.001 | 0.24 | 0.001 |
| AVI, L | 0.06 | 0.09 | 0.23 | 0.001 | 0.02 | 0.59 | −0.13 | 0.02 | 0.12 | 0.05 | 0.17 | 0.007 |
| AT cm2 | 0.06 | 0.09 | 0.23 | 0.001 | 0.01 | 0.62 | −0.12 | 0.04 | 0.13 | 0.04 | 0.16 | 0.01 |
WC: waist circumference, HC: hip circumference, BMI: body mass index, BF%: body fat percent, WHtR: waist-height ratio, WHR: waist-hip ratio, C-Index: conicity index, BSA: body surface area, AVI: abdominal volume index, AT: deep abdominal adipose-tissue, FPG: fasting plasma glucose, TCh: total cholesterol, TGL: triglyceride, HDL-C: high-density lipoprotein cholesterol, LDL-C: low-density lipoprotein cholesterol, UA: uric acid.
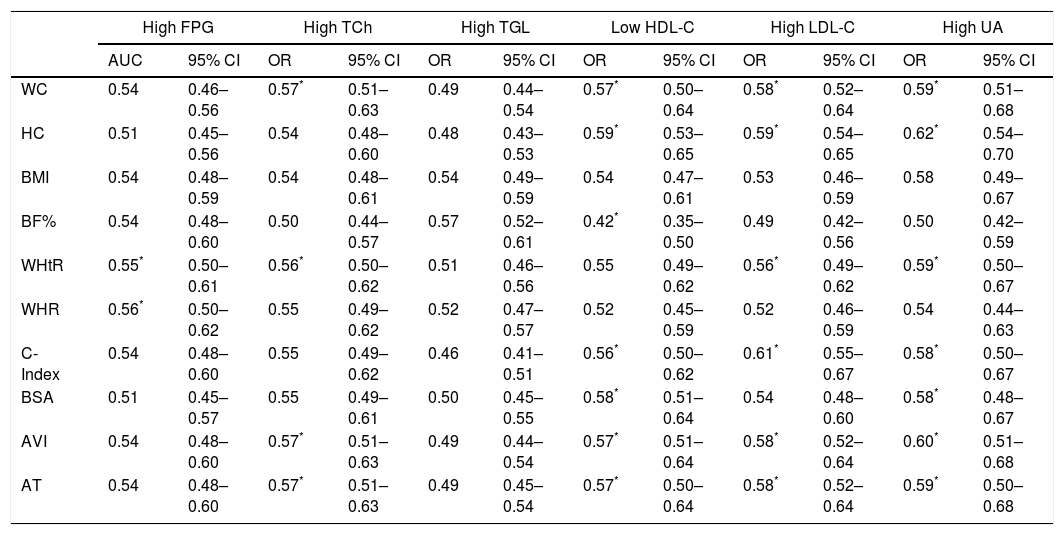
ROC curves determined the effectiveness of body composition indexes in the prediction of the metabolic analytical parameters of cardiovascular disease risk (Table 5). WC, WHtR, C-Index, AVI and AT showed superiority in the prediction of metabolic alterations. The AUCs of the WHtR, and WHR for predicting high FPG were significantly higher than the AUCs of the other indexes (both P<0.05). Considering TCh, the AUCs of WC, WHtR, AVI and AT were significantly higher (P<0.05) than the other indexes, again. For the lipoprotein, the AUCs shows that WC, HC, C-Index, AVI and AT were the best predictors of low HDL-C and high LDL-C; the BSA is also a predictor of low HDL-C, and the WHtR was only a predictor of high LDL-C. By last, only BMI, BF%, and WHR were not found as predictors of high UA.
AUC (95% CI) between the body composition indexes and metabolic components.
| High FPG | High TCh | High TGL | Low HDL-C | High LDL-C | High UA | |||||||
|---|---|---|---|---|---|---|---|---|---|---|---|---|
| AUC | 95% CI | OR | 95% CI | OR | 95% CI | OR | 95% CI | OR | 95% CI | OR | 95% CI | |
| WC | 0.54 | 0.46–0.56 | 0.57* | 0.51–0.63 | 0.49 | 0.44–0.54 | 0.57* | 0.50–0.64 | 0.58* | 0.52–0.64 | 0.59* | 0.51–0.68 |
| HC | 0.51 | 0.45–0.56 | 0.54 | 0.48–0.60 | 0.48 | 0.43–0.53 | 0.59* | 0.53–0.65 | 0.59* | 0.54–0.65 | 0.62* | 0.54–0.70 |
| BMI | 0.54 | 0.48–0.59 | 0.54 | 0.48–0.61 | 0.54 | 0.49–0.59 | 0.54 | 0.47–0.61 | 0.53 | 0.46–0.59 | 0.58 | 0.49–0.67 |
| BF% | 0.54 | 0.48–0.60 | 0.50 | 0.44–0.57 | 0.57 | 0.52–0.61 | 0.42* | 0.35–0.50 | 0.49 | 0.42–0.56 | 0.50 | 0.42–0.59 |
| WHtR | 0.55* | 0.50–0.61 | 0.56* | 0.50–0.62 | 0.51 | 0.46–0.56 | 0.55 | 0.49–0.62 | 0.56* | 0.49–0.62 | 0.59* | 0.50–0.67 |
| WHR | 0.56* | 0.50–0.62 | 0.55 | 0.49–0.62 | 0.52 | 0.47–0.57 | 0.52 | 0.45–0.59 | 0.52 | 0.46–0.59 | 0.54 | 0.44–0.63 |
| C-Index | 0.54 | 0.48–0.60 | 0.55 | 0.49–0.62 | 0.46 | 0.41–0.51 | 0.56* | 0.50–0.62 | 0.61* | 0.55–0.67 | 0.58* | 0.50–0.67 |
| BSA | 0.51 | 0.45–0.57 | 0.55 | 0.49–0.61 | 0.50 | 0.45–0.55 | 0.58* | 0.51–0.64 | 0.54 | 0.48–0.60 | 0.58* | 0.48–0.67 |
| AVI | 0.54 | 0.48–0.60 | 0.57* | 0.51–0.63 | 0.49 | 0.44–0.54 | 0.57* | 0.51–0.64 | 0.58* | 0.52–0.64 | 0.60* | 0.51–0.68 |
| AT | 0.54 | 0.48–0.60 | 0.57* | 0.51–0.63 | 0.49 | 0.45–0.54 | 0.57* | 0.50–0.64 | 0.58* | 0.52–0.64 | 0.59* | 0.50–0.68 |
WC: waist circumference, HC: hip circumference, BMI: body mass index, BF%: body fat percent, WHtR: waist-height ratio, WHR: waist-hip ratio, C-Index: conicity index, BSA: body surface area, AVI: abdominal volume index, AT: deep abdominal adipose-tissue, FPG: fasting plasma glucose, TCh: total cholesterol, TGL: triglyceride, HDL-C: high-density lipoprotein cholesterol, LDL-C: low-density lipoprotein cholesterol, UA: uric acid.
The cut-off points that were suggested by the ROC curve analyzed for C-index, BSA, AVI and AT were: 1.14 for C-index, 1.57 for BSA, 11.6 for AVI, and 31 for AT.
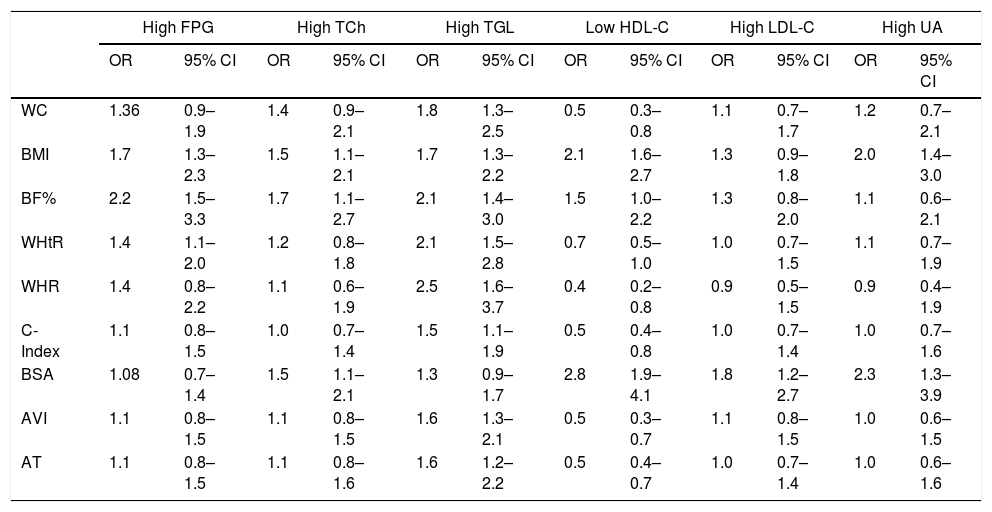
Associations between body composition indexes and cardiovascular disease risk factorsThe body composition indexes that were the most associated with the risk of alterations of the metabolic analytical parameters (Table 6) were BMI and BSA. The WHtR was associated with the risk of high FPG and high TGL. WHR, C-index, AVI and AT were associated only with high TGL risk. Therefore, MANOVA evaluated the impact of BMI and BSA on the changes of the metabolic components, the BMI individually predicts the changes on the six metabolic analytical parameters as a set [Wilk's λ=0.89, F(18,1570)=3.4, P<0.0001], but not BSA [Wilk's λ=0.98, F(6,555)=1.4, P=0.18]; the interaction between these two indexes (BMI and BSA altered in the same individual) significantly predicts changes of the six metabolic analytical parameters of cardiovascular disease risk [Wilk's λ=0.97, F(6,555)=2.3, P=0.03]. The multivariate F-test revealed that TCh, TGL, HDL-C, LDL-C and UA were quite affected by BMI (All P<0.01) and BSA only affect LDL-C (P<0.02). Their interaction of this two indexes affect the values of TCh, LDL-C, and UA (All P<0.05).
Odds ratio (95% CI) between the body composition indexes and metabolic components.
| High FPG | High TCh | High TGL | Low HDL-C | High LDL-C | High UA | |||||||
|---|---|---|---|---|---|---|---|---|---|---|---|---|
| OR | 95% CI | OR | 95% CI | OR | 95% CI | OR | 95% CI | OR | 95% CI | OR | 95% CI | |
| WC | 1.36 | 0.9–1.9 | 1.4 | 0.9–2.1 | 1.8 | 1.3–2.5 | 0.5 | 0.3–0.8 | 1.1 | 0.7–1.7 | 1.2 | 0.7–2.1 |
| BMI | 1.7 | 1.3–2.3 | 1.5 | 1.1–2.1 | 1.7 | 1.3–2.2 | 2.1 | 1.6–2.7 | 1.3 | 0.9–1.8 | 2.0 | 1.4–3.0 |
| BF% | 2.2 | 1.5–3.3 | 1.7 | 1.1–2.7 | 2.1 | 1.4–3.0 | 1.5 | 1.0–2.2 | 1.3 | 0.8–2.0 | 1.1 | 0.6–2.1 |
| WHtR | 1.4 | 1.1–2.0 | 1.2 | 0.8–1.8 | 2.1 | 1.5–2.8 | 0.7 | 0.5–1.0 | 1.0 | 0.7–1.5 | 1.1 | 0.7–1.9 |
| WHR | 1.4 | 0.8–2.2 | 1.1 | 0.6–1.9 | 2.5 | 1.6–3.7 | 0.4 | 0.2–0.8 | 0.9 | 0.5–1.5 | 0.9 | 0.4–1.9 |
| C-Index | 1.1 | 0.8–1.5 | 1.0 | 0.7–1.4 | 1.5 | 1.1–1.9 | 0.5 | 0.4–0.8 | 1.0 | 0.7–1.4 | 1.0 | 0.7–1.6 |
| BSA | 1.08 | 0.7–1.4 | 1.5 | 1.1–2.1 | 1.3 | 0.9–1.7 | 2.8 | 1.9–4.1 | 1.8 | 1.2–2.7 | 2.3 | 1.3–3.9 |
| AVI | 1.1 | 0.8–1.5 | 1.1 | 0.8–1.5 | 1.6 | 1.3–2.1 | 0.5 | 0.3–0.7 | 1.1 | 0.8–1.5 | 1.0 | 0.6–1.5 |
| AT | 1.1 | 0.8–1.5 | 1.1 | 0.8–1.6 | 1.6 | 1.2–2.2 | 0.5 | 0.4–0.7 | 1.0 | 0.7–1.4 | 1.0 | 0.6–1.6 |
WC: waist circumference, HC: hip circumference, BMI: body mass index, BF%: body fat percent, WHtR: waist-height ratio, WHR: waist-hip ratio, C-Index: conicity index, BSA: body surface area, AVI: abdominal volume index, AT: deep abdominal adipose-tissue, FPG: fasting plasma glucose, TCh: Total cholesterol, TGL: triglyceride, HDL-C: high-density lipoprotein cholesterol, LDL-C: low-density lipoprotein cholesterol, UA: uric acid.
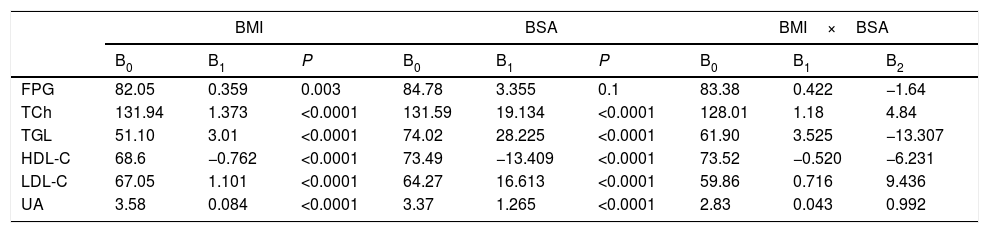
The multiple linear regression analysis (Table 7) shows that BMI and BSA influence the values of the analytical parameters of cardiovascular disease risk. All, except FPG, were significantly affected by both, BMI and BSA. The increase of 1 unit of BMI increases by 0.35 units to FPG. (P=0.003), the increments per unit of BMI, would increase in 1.37, 3.01, 1.1 and 0.08 units to the TCh, TGL, LDL-C and UA, respectively; while the increments in 1 unit of BSA, would increase in 19.13, 28.25, 16.61 and 1.26 units, the values of TCh, TGL LDL-C and UA (All P<0.0001). The HDL-C values will decrease 0.76 and 13.4 units, when BMI and BSA, increase 1 unit (both P<0.0001).
Multiple linear regression analysis of the metabolic components.
| BMI | BSA | BMI×BSA | |||||||
|---|---|---|---|---|---|---|---|---|---|
| B0 | B1 | P | B0 | B1 | P | B0 | B1 | B2 | |
| FPG | 82.05 | 0.359 | 0.003 | 84.78 | 3.355 | 0.1 | 83.38 | 0.422 | −1.64 |
| TCh | 131.94 | 1.373 | <0.0001 | 131.59 | 19.134 | <0.0001 | 128.01 | 1.18 | 4.84 |
| TGL | 51.10 | 3.01 | <0.0001 | 74.02 | 28.225 | <0.0001 | 61.90 | 3.525 | −13.307 |
| HDL-C | 68.6 | −0.762 | <0.0001 | 73.49 | −13.409 | <0.0001 | 73.52 | −0.520 | −6.231 |
| LDL-C | 67.05 | 1.101 | <0.0001 | 64.27 | 16.613 | <0.0001 | 59.86 | 0.716 | 9.436 |
| UA | 3.58 | 0.084 | <0.0001 | 3.37 | 1.265 | <0.0001 | 2.83 | 0.043 | 0.992 |
BMI: body mass index, BSA: body surface area, FPG: fasting plasma glucose, TCh: total cholesterol, TGL: triglyceride, HDL-C: high-density lipoprotein cholesterol, LDL-C: low-density lipoprotein cholesterol, UA: uric acid.
The present study carried out on a sample with an age of 18.95±2.1 years, allows demonstrating the relationship between BMI and BSA and altered metabolic analytical parameters that show greater cardiovascular risk, such as hypercholesterolemia, hypertriglyceridemia, hyperuricemia and low HDL.
The study subjects were young adult between 18 and 19 years, the values of the metabolic analytical parameters were found below the cut-off points that may show an alteration in men and women, except for HDL-C in men, which average was below from the established as the standard. However, these results suggest that the study population was of apparently healthy young adults, by the same; all composition indexes were below the cut-off points, making it appear that the population did not have any alteration in their body composition.
Among the main findings of this study, were the values of all the body composition indexes in the metabolic alterations, since most of the indexes were increased when there was an elevation of the metabolic analytical parameters above normal. Hingorjo et al.16 obtained similar findings; they observed higher values in different body composition indexes in subjects without and with metabolic syndrome (MS).
The values of the indexes increase with the presence of a metabolic alteration, but they would not necessarily be above the cut-off point. This finding is different than in other studies,17,18 where it is possible to find index values above average values, even in control subjects.
The correlation between the indexes of body composition and metabolic analytical parameters was weak since the r statistics were less than 0.4, and r2 were not more prominent than 0.1 although statistically significant, this was similar in other studies.2,17 The best anthropometric indexes that correlated with the metabolic analytical parameters of cardiovascular disease risk were the BMI and BSA, which was similar to previous research, in which the BMI had a strong correlation with the metabolic analytical parameters of cardiovascular risk.18 Other studies19,20 provided evidence for the superiority of BMI against other body composition indexes, although, in these, they also found that WHtR had a similar correlation as BMI, with cardiovascular risk factors. However, correlation of BSA had not been evaluated in these metabolic components, only one study21 correlated the BSA with the lipid profile in a population of adult women with lung cancer. It is necessary to mention that there is no evidence of these findings in young adult population and even less in the Mexican population.
Many of the current studies that have researched the different anthropometric parameters have been carried out in the Asian or Caucasian population, this being an inherent limitation as few studies have been carried out in Latin populations,22 but using only one anthropometric parameter. This study provides information on conventional and unconventional anthropometric parameters and a suggestion of the practical use of them in the first level of care.
The results obtained in the ROC curves of the different indexes contrast from other studies since the results suggest that the BMI is the worst index in the prediction of alterations of the metabolic components, and in other studies18,22 the BMI has AUC higher than 0.6, reaching even 0.8.
The used cut-off points for AVI and AT did not show any association in the cardiovascular disease risk factors, and the C-index was associated only with the risk of high TGL. These results are highly controversial, since the three previous indexes are considered for central obesity,7,11–13 AVI and AT have been strongly correlated with abdominal adipose tissue23 which has been studied extensively as a metabolic and endocrine active tissue,12,24 and which are deeply associated with cardiovascular risk,25 even studies on these anthropometric parameters had shown that an increase in these indexes leads to an increase components of cardiovascular risk,26 as well as more significant alterations in the components of the metabolic syndrome.18,25 Therefore, we suggest that research continue on these indexes, that studies could be conducted in larger populations to define better the cut-off point with which more accurate diagnoses; in Mexico, besides there is little research on the prognostic efficacy of C-index, AVI and AT, accordingly, there is no ideal cut-off point. With the two indexes (BMI and BSA) that showed a higher association to the risk of metabolic alterations, we applied several predictions analyzes, in which it was found that the increases of these indexes may also increase the values of each metabolic analytical parameter. That is, if a subject has a BMI=25kg/m2 the amount of TGL or LDL-C, will be 126mg/dL and 93.15mg/dL respectively, these values, although they are below the cut-off points that define with alterations, we should consider that it would be a young adult, age between 18 and 19 years, with overweight only, suggesting that the increase in BMI is linear over time, this subject could develop dyslipidemia at an early age. Then an individual of the same age, but with obesity II, BMI>35kg/m2 would have TGL in 156.34mg/dL and LDL-C in 105.5mg/dL; parameters that would increase the cardiovascular disease risk. Now, the interaction of the two body composition indexes (BMI and BSA) to increase the values of LDL-C in a subject with BMI>30kg/m2 and BSA>1.6m2, would make the individual with these two anthropometric alterations had LDL-C in 96.4mg/dL, borderline value to define hyperlipoproteinemia, a cardiovascular disease risk factor. As for the UA, the tendency of a higher BMI or higher BSA may generate an increase in UA, this being considered as a risk factor for cardiovascular disease.27–29
This study had some limitations, being a cross-sectional study; it is difficult to make a causal inference. The use of a few body composition indexes that have not a cut-off point generated the need to obtain their optimal cut points, but only for issues of this research. Another limitation was that men and women were analyzed in the same sample. The results of the study could not be generalized to the entire population.
ConclusionThe findings in this study indicate that, in the population of young adults, BMI and BSA are related to cardiovascular disease risk factor. They are superior to WC, WHtR, WHR, BF%, C-index, AVI and AT. Thanks to the ease of measurement, these can be used as a first step in the detection of risk factors for cardiovascular disease. Further studies are required to establish the same relationship in other population.
Conflict of interestAll authors state no conflict of interest.
