
The pandemic caused by SARS-CoV-2 has drastically changed the global health landscape. Our objective was to verify if, after the start of the pandemic, there was an increase in in-hospital mortality in patients admitted to a Gastroenterology Service of a 3rd level hospital.
Material and methodsThe 1039 admissions registered at the Virgen de la Victoria University Hospital in Malaga (Spain) were retrospectively analysed in the period between 1 December 2019 and 30 November 2020 (12 months), which were divided into 4 quarters (pre-wave, first wave, inter-wave and second wave) and mortality and other variables (globally and by disease group) were analysed.
ResultsNo statistically significant differences were observed in terms of overall in-hospital mortality in the different periods. (p 0.23). The greatest burden of disease corresponded to biliopancreatic group and, within them, acute pancreatitis (p 0.04), followed by non-variceal gastrointestinal bleeding. In the second semester, mortality increased in the biliopancreatic group (p 0.01). Patients admitted for gastrointestinal bleeding took longer to request care after the start of the pandemic, especially in the second wave (p 0.03). The same was observed in admissions due to tumours, with the time elapsed until the emergency visit more than double in the second semester, with a consequent increase in mortality (p 0.00).
ConclusionsThe global in-hospital mortality in a Gastroenterology Service in a 3rd level hospital has not increased with the onset of the SARS-CoV-2 pandemic, however, a higher in-hospital mortality has been recorded in biliopancreatic diseases and digestive tumours diagnosed on an in-patient basis between June and November 2020.
La pandemia ocasionada por el SARS-CoV-2 ha modificado drásticamente el panorama sanitario mundial. Nuestro objetivo fue comprobar si tras el inicio de esta se produjo un aumento en la mortalidad intrahospitalaria en los pacientes ingresados en un servicio de aparato digestivo de un hospital de tercer nivel.
Material y métodosSe analizaron retrospectivamente 1.039 ingresos en el Servicio de Aparato Digestivo del Hospital Universitario Virgen de la Victoria en el periodo comprendido entre el 1 de diciembre de 2019 y el 30 de noviembre de 2020 (12 meses), se dividieron en 4 trimestres (preoleada, primera oleada, interoleada y segunda oleada) y se analizó la mortalidad y otras variables (de forma global y por grupo de enfermedades).
ResultadosNo se observaron diferencias estadísticamente significativas en cuanto a mortalidad intrahospitalaria global en los diferentes periodos (p=0,23). La enfermedad con mayor predominio fue la biliopancreática y, dentro de ella, las pancreatitis agudas (p=0,04), seguidas del sangrado digestivo no varicoso. En el segundo semestre aumentó la mortalidad en el grupo biliopancreático (p=0,01). Los pacientes que ingresaron por hemorragia digestiva tardaron más en solicitar asistencia tras la pandemia, especialmente en la segunda oleada (p=0,03). Esto mismo se objetivó en los ingresos por tumores, siendo el tiempo transcurrido hasta la consulta a Urgencias mayor del doble en el segundo semestre, con el consecuente aumento en la mortalidad (p=0,00).
ConclusionesLa mortalidad global intrahospitalaria en el Servicio de Aparato Digestivo no ha aumentado con la sobrevenida de la pandemia por SARS-CoV-2, si bien se ha registrado una mayor mortalidad intrahospitalaria en las enfermedades biliopancreáticas y los tumores digestivos diagnosticados en régimen de hospitalización entre junio y noviembre de 2020.
Coronavirus disease 2019 (COVID-19), caused by severe acute respiratory syndrome coronavirus type 2 (SARS-CoV-2) infection, emerged in late 2019 in Wuhan, China. On 11 March 2020, the World Health Organization (WHO) declared a state of pandemic.1 The first case in Spain was confirmed on 31 January in La Gomera (Canary Islands) and a state of alarm was declared throughout the national territory from 14 March to 21 June 2020.
The pandemic caused by COVID-19 has brought about a change in the global health landscape, in which today the number of people infected is more than 517 million with more than 6.2 million deaths.2 Very recently, the WHO has published data that estimate the number of deaths from COVID, either directly or indirectly, at almost 15 million. This excess mortality includes those who died from Covid who were not diagnosed and those who died due to the impact of the health crisis.
The health system was saturated and on the verge of collapse on several occasions, leading to a relocation of physical and material resources and a transformation of hospital care processes. Specialists from different areas have become part of multidisciplinary care units to deal with the high number of admissions caused by SARS-CoV-2.
Hospitals in Spain have undergone an unprecedented transformation, increasing the number of beds (mainly intensive care), creating field hospitals in trade fair grounds and sports centres, transforming hotels into centres for minor patients and health professionals from other areas.3
The Gastroenterology Service, like practically all others, has been affected. Firstly, due to the variety of digestive symptoms (such as vomiting, diarrhoea and abdominal pain) and laboratory abnormalities (mainly hypertransaminasemia) that can be caused by SARS-CoV-2.4 Secondly, due to the need to restructure schedules, limiting the number of endoscopies, cancelling appointments and reducing the number of scheduled admissions.5
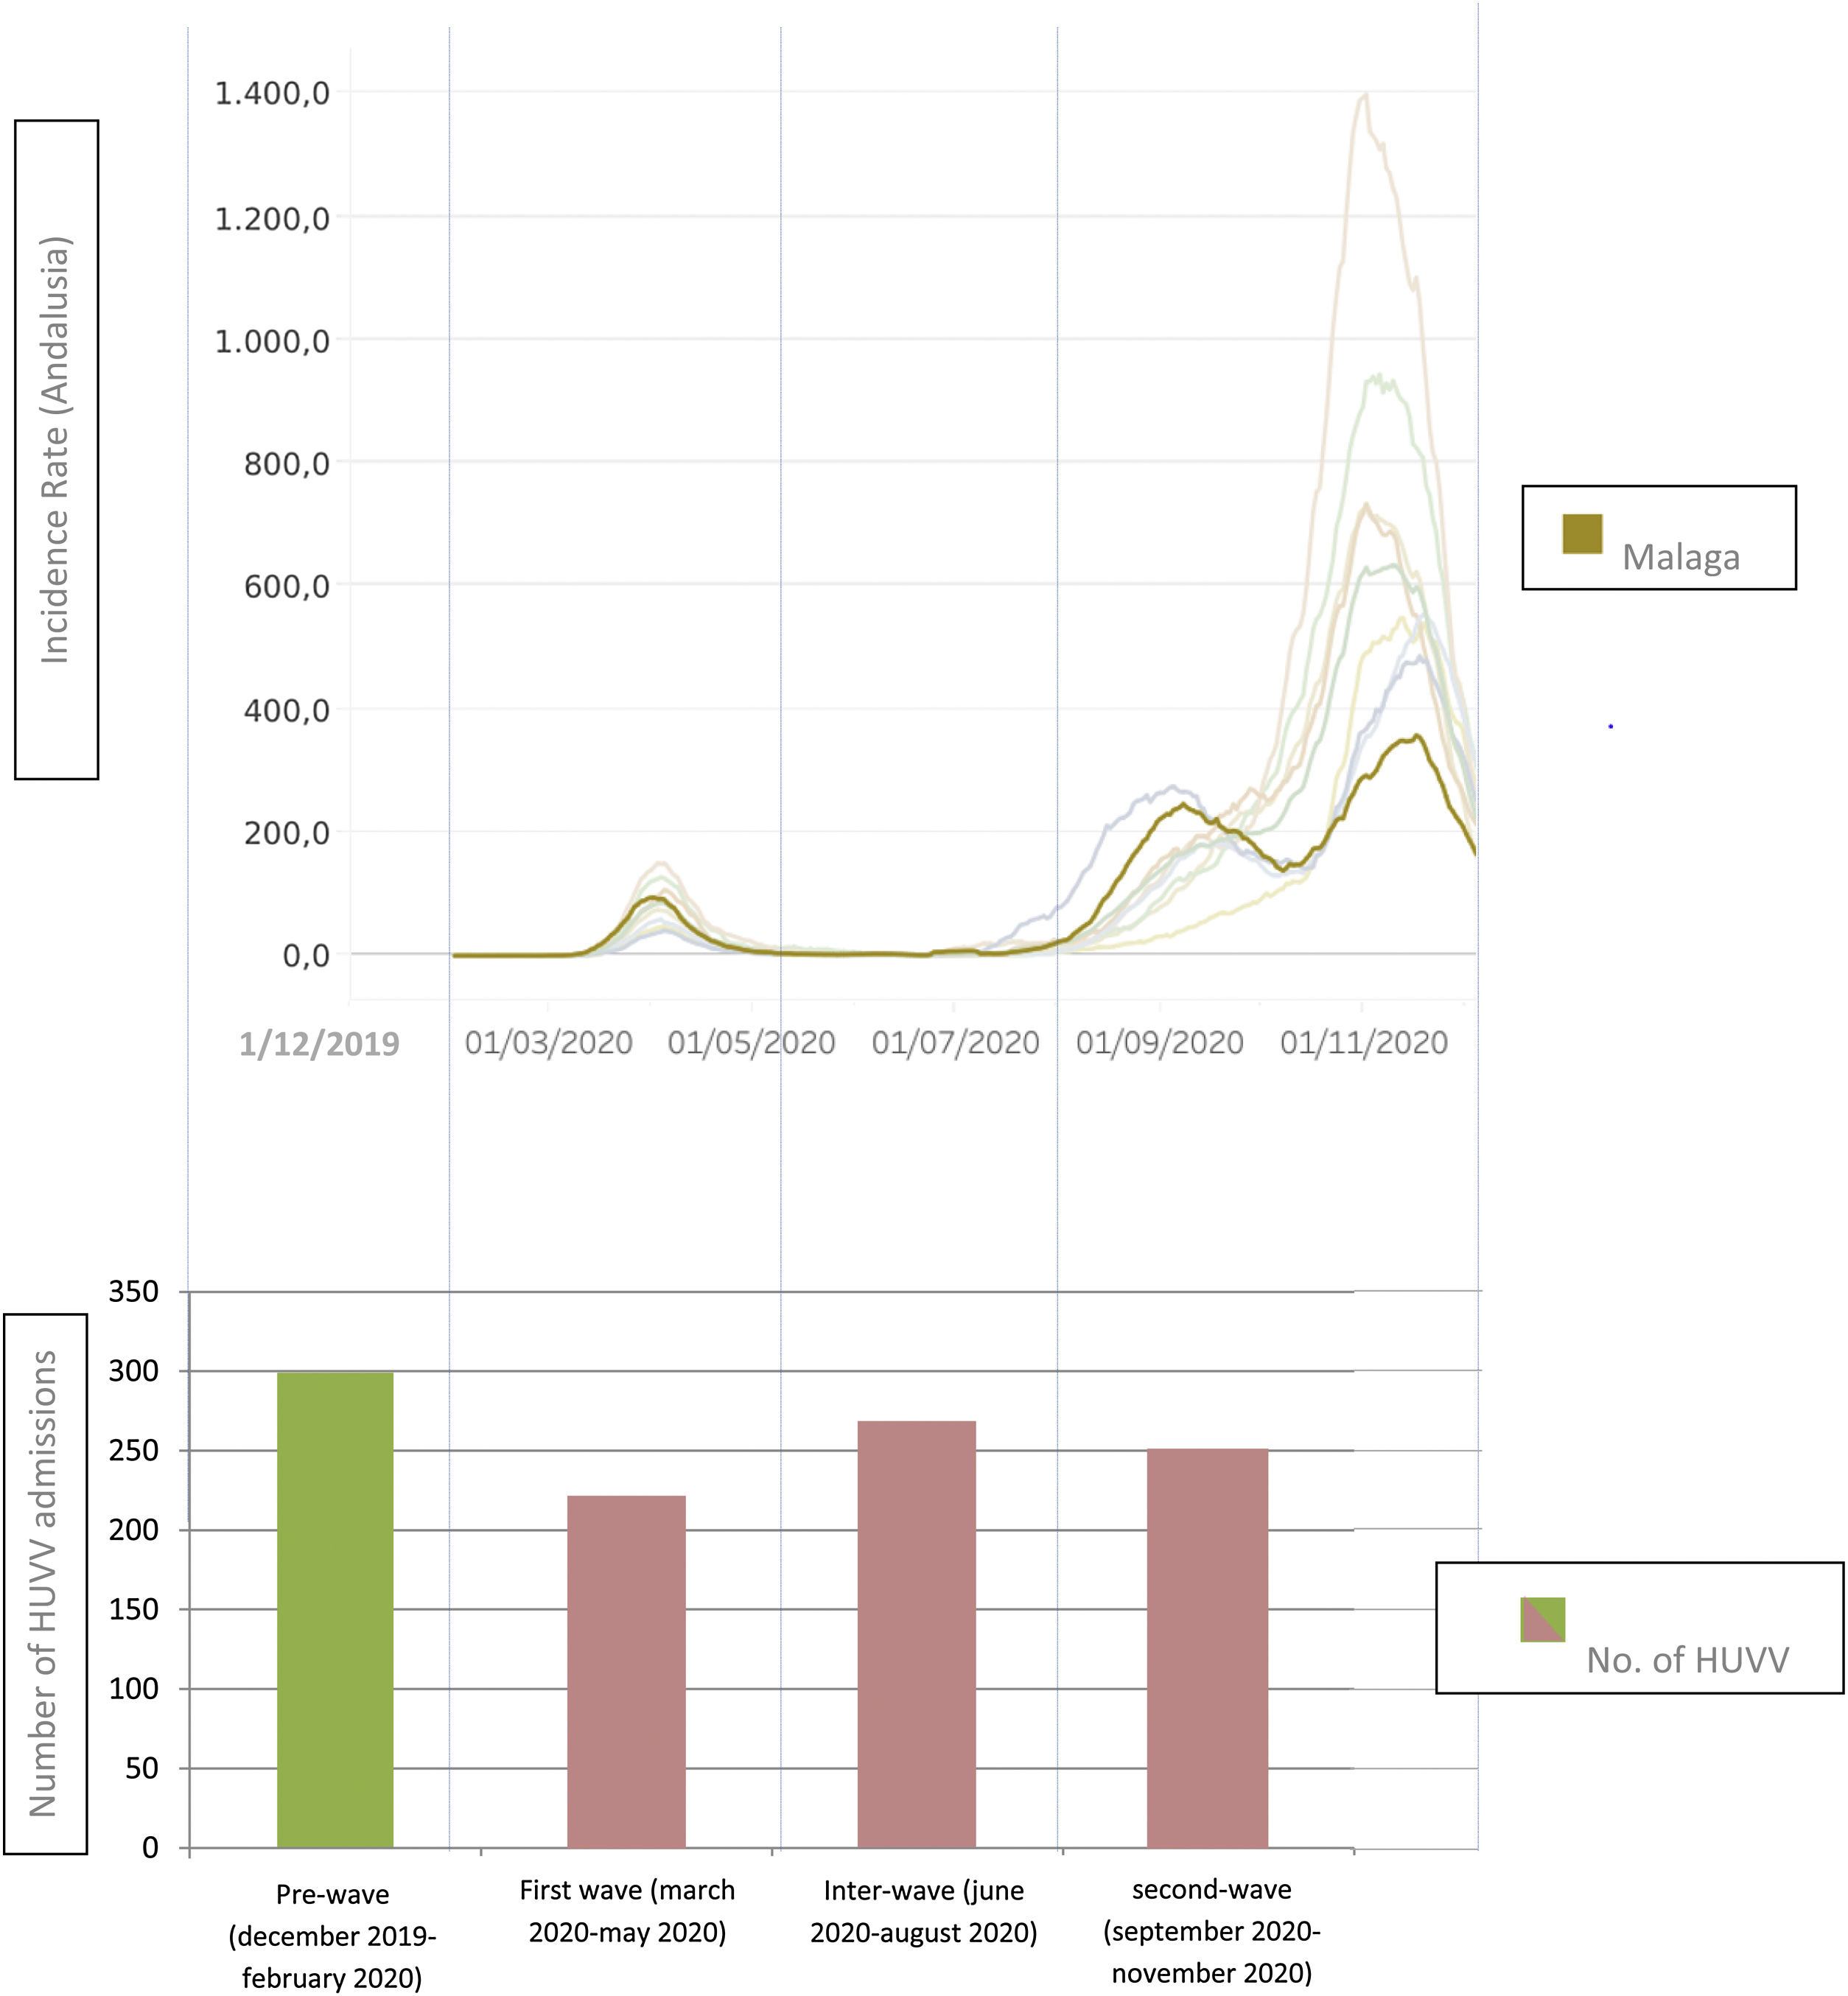
The pandemic has affected the different autonomous communities and Spanish cities to a greater or lesser extent.6 During the year 2020 there were clearly two temporary periods of maximum incidence of SARS-CoV-2 infection defined as “waves”. In Andalusia there was a first incidence peak (first wave) during the months of March, April and May; and a second peak, more marked, in the months of September, October and November. In Malaga, the behaviour was similar to the Andalusian community in terms of incidence rate and hospital admissions for SARS-CoV-2 pneumonia.7
During this period, the hypothesis arose from the specialists in the Gastroenterology Service regarding the existence of a probable absence or delay in the request for urgent care by patients with a digestive pathology, with the risks and increased morbidity/mortality that this could entail. This clinical research work has been designed to try to confirm or refute this hypothesis and assess its influence on hospitalisation/mortality in a Gastroenterology Service.
The main objective of this study was to analyse global in-hospital mortality in a Gastroenterology Service after the start of the COVID-19 pandemic. As secondary objectives, in-hospital mortality was analysed in the different subgroups of digestive diseases, as well as general variables (demographic, stay in days, etc.) and specific variables of each subgroup of digestive diseases that could act as predictors of mortality.
Material and methodsPatient selection and structure of the studyThis is a single-centre, observational and retrospective study that included 1039 patients admitted to the Gastroenterology Service of the Virgen de la Victoria University Hospital in the period between 1 December 2019 and 30 November 2020 (12 months). The inclusion criteria were: patients≥18 years admitted urgently or scheduled in the Gastroenterology Service in the period described. The exclusion criteria were: patients<18 years old, patients who were admitted to the Gastroenterology Service and changed to another service during admission (except Intensive Care-ICU) and patients who were admitted to other services (except ICU) and subsequently refereed to the Gastroenterology Service.
The patients were divided into four time-related groups (by trimesters): from 1 December 2019 to 29 February 2020 (“pre-wave” period), from 1 March 2020 to 31 May 2020 (“first wave”), from 1 June 2020 to 31 August 2020 (“inter-wave” period) and from 1 September 2020 to 30 November 2020 (“second wave”) (Fig. 1). The control group was the “pre-wave” period and the groups were compared with each other both globally (general mortality) and by different groups of diseases (biliopancreatic, non-variceal gastrointestinal bleeding, miscellaneous, liver, inflammatory bowel disease (IBD) and admissions scheduled). In addition, a subanalysis of the gastrointestinal tumours observed in each of the above groups was performed.
 and Number of admission in Gastroenterology Service of University Hospital Virgen de la Victoria (HUVV) (Malaga).")
This study has been carried out in accordance with current legislation and following the ethical principles established in the Declaration of Helsinki. Informed consent forms were not given to the patients included due to the retrospective nature of the study.
Logistics and healthcare characteristics of the centreThe Virgen de la Victoria hospital is a third-level university hospital that offers specialised care to 470,000 inhabitants of the province of Malaga. The Emergency Department, with three different points of entry, attends an estimated average of 750 emergencies per day for COVID and non-COVID pathologies. The Gastroenterology Service has 35 hospitalisation beds, 40 weekly consultations (General Gastroenterology, Hepatology and Inflammatory Bowel Disease), 4 conventional endoscopy rooms and 1 advanced endoscopy room (4 days/week). There is also a Hepatology Unit, a Comprehensive Inflammatory Bowel Disease Unit and an Endoscopy Unit.8
Variables studied- -
Overall analysis: mortality, sex, age, days from symptom onset to emergency room visit, hospital stay and mortality.
- -
Non-variceal gastrointestinal bleeding: externalisation (high, low), cause (peptic, tumour or others), Glasgow-Blatchford score, haemoglobin on arrival, need for ICU, need for transfusion, complications, time from arrival at the emergency room to the first endoscopy.
- -
Biliopancreatic diseases: diseases (acute pancreatitis, complicated biliary colic, acute cholecystitis, acute cholangitis, painless jaundice), BISAP score, Quick-Sofa score on arrival at the Emergency Department, pancreatic necrosis, drainage of collections, scheduled biliary drainage, surgical necrosectomy, need for ICU.
- -
Liver diseases: diseases (acute hepatitis, variceal haemorrhage, hepatic encephalopathy, ascites, acute on-chronic liver failure, infections, others), haemoglobin on arrival, need for transfusion, need for tamponade, rescue TIPS, Child–Pugh–Turcotte stage, MELD score, need for liver transplant, need for ICU.
- -
Inflammatory bowel disease: types (Crohn's disease, ulcerative colitis, indeterminate/unclassifiable colitis), immunosuppressive treatment, discontinuation of immunosuppressive treatment, modified Truelove–Witts index, Harvey–Bradshaw index, debut, local complications, need for surgery.
- -
Scheduled admissions: diseases (biliary, hepatology, IBD, tumour, others).
- -
Miscellaneous: diseases (inflammatory-ischaemic-infectious ileocolitis, endoscopic complication/surveillance, aphagia–dysphagia–emetic syndrome, others).
- -
Tumours: origin of the tumour, metastasis at diagnosis, attitude established by the tumour committee.
Quantitative variables have been reported as means (± standard deviation – SD) and qualitative variables as whole numbers (percentages). The normal distribution of the variables was verified and a univariate analysis was carried out using Chi square to compare nominal and ordinal qualitative variables, and ANOVA test with Bonferroni adjustments to compare quantitative variables, between the different groups. The inferential study has been carried out with the support of IBM SPSS Statistics 23.
ResultsA total of 1039 admissions were recorded between 1 December 2019 and 30 November 2020. The disease groups that most frequently led to admission were biliopancreatic (43.5%), scheduled admissions (16.5%), non-variceal gastrointestinal bleeding (16.1%), miscellaneous (10.4%), liver (8.1%) and IBD (5.5%) (Supplementary Table 1).
In-hospital mortalityOverall in-hospital mortality was analysed with a total of 54 deaths (5.2%), by periods (17 pre-wave (5.7%), 7 first wave (3.2%), 12 inter-wave (4.5%) and 18 second wave (7.2%)), not reaching statistical significance (p 0.23).
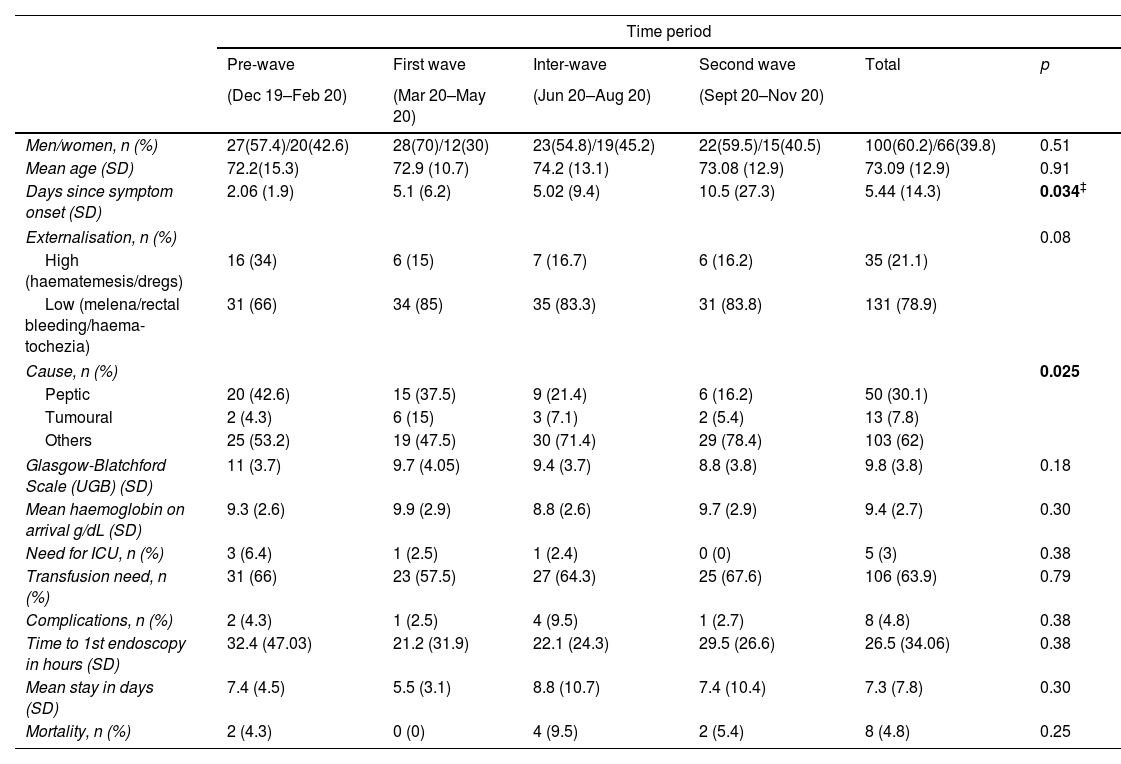
Non-variceal gastrointestinal bleedingNo differences were found in terms of sex and age in the 4 groups. It was observed that the number of days that elapsed from the onset of symptoms to consultation in the emergency room was lower in the pre-wave group (2.06) than in the rest of the groups (5.1, 5 and 10.5 respectively), reaching only statistical significance the difference with the second wave (p 0.034). The most frequent cause was non-tumour non-peptic (62%). No differences were observed in the Glasgow–Blatchford scale, haemoglobin values on arrival, need for ICU admission, number of complications, need for transfusion, time to first endoscopy, mean stay, or mortality (Table 1).
Admissions for non-variceal gastrointestinal bleeding in the Gastroenterology Service.
| Time period | ||||||
|---|---|---|---|---|---|---|
| Pre-wave | First wave | Inter-wave | Second wave | Total | p | |
| (Dec 19–Feb 20) | (Mar 20–May 20) | (Jun 20–Aug 20) | (Sept 20–Nov 20) | |||
| Men/women, n (%) | 27(57.4)/20(42.6) | 28(70)/12(30) | 23(54.8)/19(45.2) | 22(59.5)/15(40.5) | 100(60.2)/66(39.8) | 0.51 |
| Mean age (SD) | 72.2(15.3) | 72.9 (10.7) | 74.2 (13.1) | 73.08 (12.9) | 73.09 (12.9) | 0.91 |
| Days since symptom onset (SD) | 2.06 (1.9) | 5.1 (6.2) | 5.02 (9.4) | 10.5 (27.3) | 5.44 (14.3) | 0.034‡ |
| Externalisation, n (%) | 0.08 | |||||
| High (haematemesis/dregs) | 16 (34) | 6 (15) | 7 (16.7) | 6 (16.2) | 35 (21.1) | |
| Low (melena/rectal bleeding/haema-tochezia) | 31 (66) | 34 (85) | 35 (83.3) | 31 (83.8) | 131 (78.9) | |
| Cause, n (%) | 0.025 | |||||
| Peptic | 20 (42.6) | 15 (37.5) | 9 (21.4) | 6 (16.2) | 50 (30.1) | |
| Tumoural | 2 (4.3) | 6 (15) | 3 (7.1) | 2 (5.4) | 13 (7.8) | |
| Others | 25 (53.2) | 19 (47.5) | 30 (71.4) | 29 (78.4) | 103 (62) | |
| Glasgow-Blatchford Scale (UGB) (SD) | 11 (3.7) | 9.7 (4.05) | 9.4 (3.7) | 8.8 (3.8) | 9.8 (3.8) | 0.18 |
| Mean haemoglobin on arrival g/dL (SD) | 9.3 (2.6) | 9.9 (2.9) | 8.8 (2.6) | 9.7 (2.9) | 9.4 (2.7) | 0.30 |
| Need for ICU, n (%) | 3 (6.4) | 1 (2.5) | 1 (2.4) | 0 (0) | 5 (3) | 0.38 |
| Transfusion need, n (%) | 31 (66) | 23 (57.5) | 27 (64.3) | 25 (67.6) | 106 (63.9) | 0.79 |
| Complications, n (%) | 2 (4.3) | 1 (2.5) | 4 (9.5) | 1 (2.7) | 8 (4.8) | 0.38 |
| Time to 1st endoscopy in hours (SD) | 32.4 (47.03) | 21.2 (31.9) | 22.1 (24.3) | 29.5 (26.6) | 26.5 (34.06) | 0.38 |
| Mean stay in days (SD) | 7.4 (4.5) | 5.5 (3.1) | 8.8 (10.7) | 7.4 (10.4) | 7.3 (7.8) | 0.30 |
| Mortality, n (%) | 2 (4.3) | 0 (0) | 4 (9.5) | 2 (5.4) | 8 (4.8) | 0.25 |
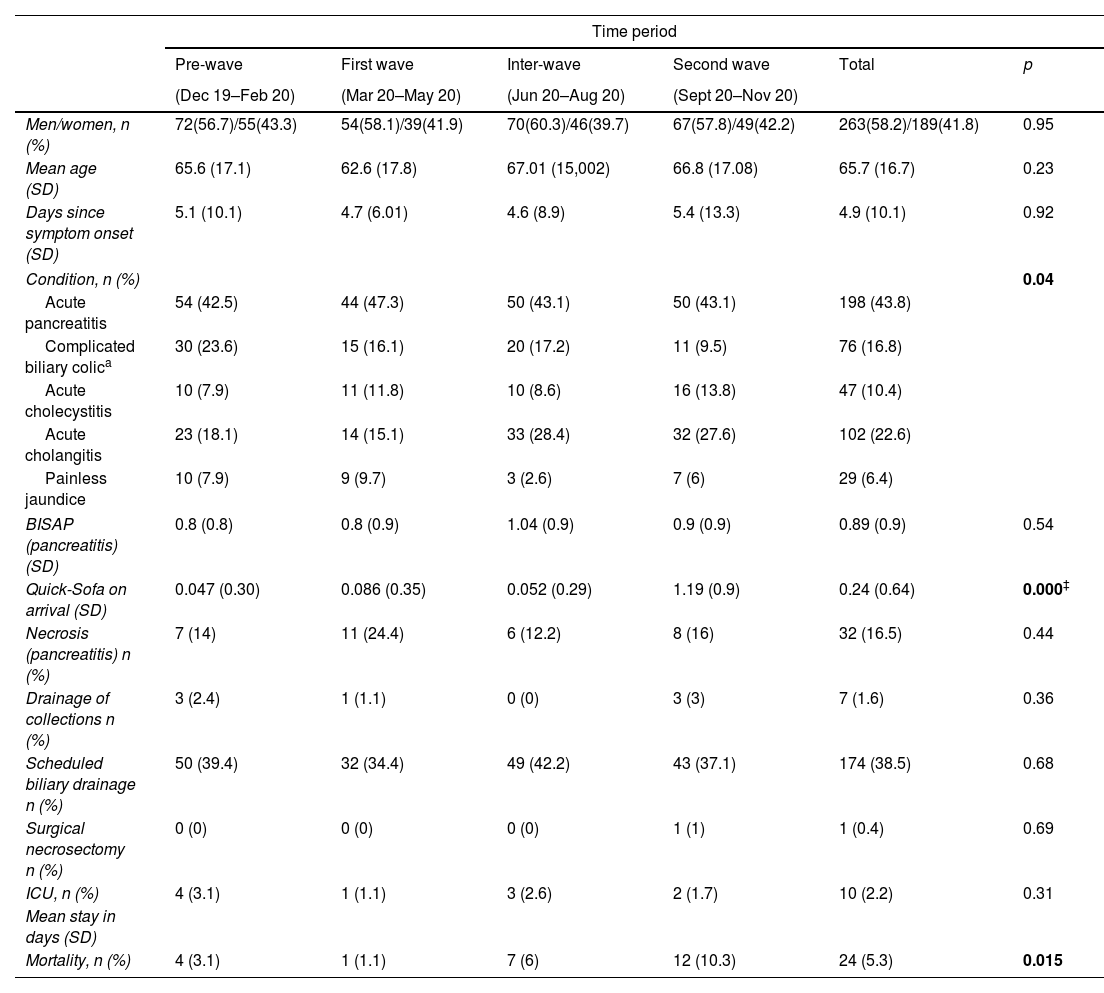
The distribution of sex and age was similar in the 4 groups. A clear predominance of acute pancreatitis was observed as the reason for admission (43.8%, p 0.04). There were no differences in the number of days from the onset of symptoms to emergency room visit or in the BISAP scale upon arrival, whereas a higher score was observed on the Quick-Sofa scale in the “second wave” compared with the “pre-wave” group (p<0.05). No differences were found in the presence of necrosis, the need for biliary drainage or collections. Mortality from this group of diseases was significantly higher in the second wave (p 0.015) (Table 2).
Admissions for biliopancreatic events in the Gastroenterology Service.
| Time period | ||||||
|---|---|---|---|---|---|---|
| Pre-wave | First wave | Inter-wave | Second wave | Total | p | |
| (Dec 19–Feb 20) | (Mar 20–May 20) | (Jun 20–Aug 20) | (Sept 20–Nov 20) | |||
| Men/women, n (%) | 72(56.7)/55(43.3) | 54(58.1)/39(41.9) | 70(60.3)/46(39.7) | 67(57.8)/49(42.2) | 263(58.2)/189(41.8) | 0.95 |
| Mean age (SD) | 65.6 (17.1) | 62.6 (17.8) | 67.01 (15,002) | 66.8 (17.08) | 65.7 (16.7) | 0.23 |
| Days since symptom onset (SD) | 5.1 (10.1) | 4.7 (6.01) | 4.6 (8.9) | 5.4 (13.3) | 4.9 (10.1) | 0.92 |
| Condition, n (%) | 0.04 | |||||
| Acute pancreatitis | 54 (42.5) | 44 (47.3) | 50 (43.1) | 50 (43.1) | 198 (43.8) | |
| Complicated biliary colica | 30 (23.6) | 15 (16.1) | 20 (17.2) | 11 (9.5) | 76 (16.8) | |
| Acute cholecystitis | 10 (7.9) | 11 (11.8) | 10 (8.6) | 16 (13.8) | 47 (10.4) | |
| Acute cholangitis | 23 (18.1) | 14 (15.1) | 33 (28.4) | 32 (27.6) | 102 (22.6) | |
| Painless jaundice | 10 (7.9) | 9 (9.7) | 3 (2.6) | 7 (6) | 29 (6.4) | |
| BISAP (pancreatitis) (SD) | 0.8 (0.8) | 0.8 (0.9) | 1.04 (0.9) | 0.9 (0.9) | 0.89 (0.9) | 0.54 |
| Quick-Sofa on arrival (SD) | 0.047 (0.30) | 0.086 (0.35) | 0.052 (0.29) | 1.19 (0.9) | 0.24 (0.64) | 0.000‡ |
| Necrosis (pancreatitis) n (%) | 7 (14) | 11 (24.4) | 6 (12.2) | 8 (16) | 32 (16.5) | 0.44 |
| Drainage of collections n (%) | 3 (2.4) | 1 (1.1) | 0 (0) | 3 (3) | 7 (1.6) | 0.36 |
| Scheduled biliary drainage n (%) | 50 (39.4) | 32 (34.4) | 49 (42.2) | 43 (37.1) | 174 (38.5) | 0.68 |
| Surgical necrosectomy n (%) | 0 (0) | 0 (0) | 0 (0) | 1 (1) | 1 (0.4) | 0.69 |
| ICU, n (%) | 4 (3.1) | 1 (1.1) | 3 (2.6) | 2 (1.7) | 10 (2.2) | 0.31 |
| Mean stay in days (SD) | ||||||
| Mortality, n (%) | 4 (3.1) | 1 (1.1) | 7 (6) | 12 (10.3) | 24 (5.3) | 0.015 |
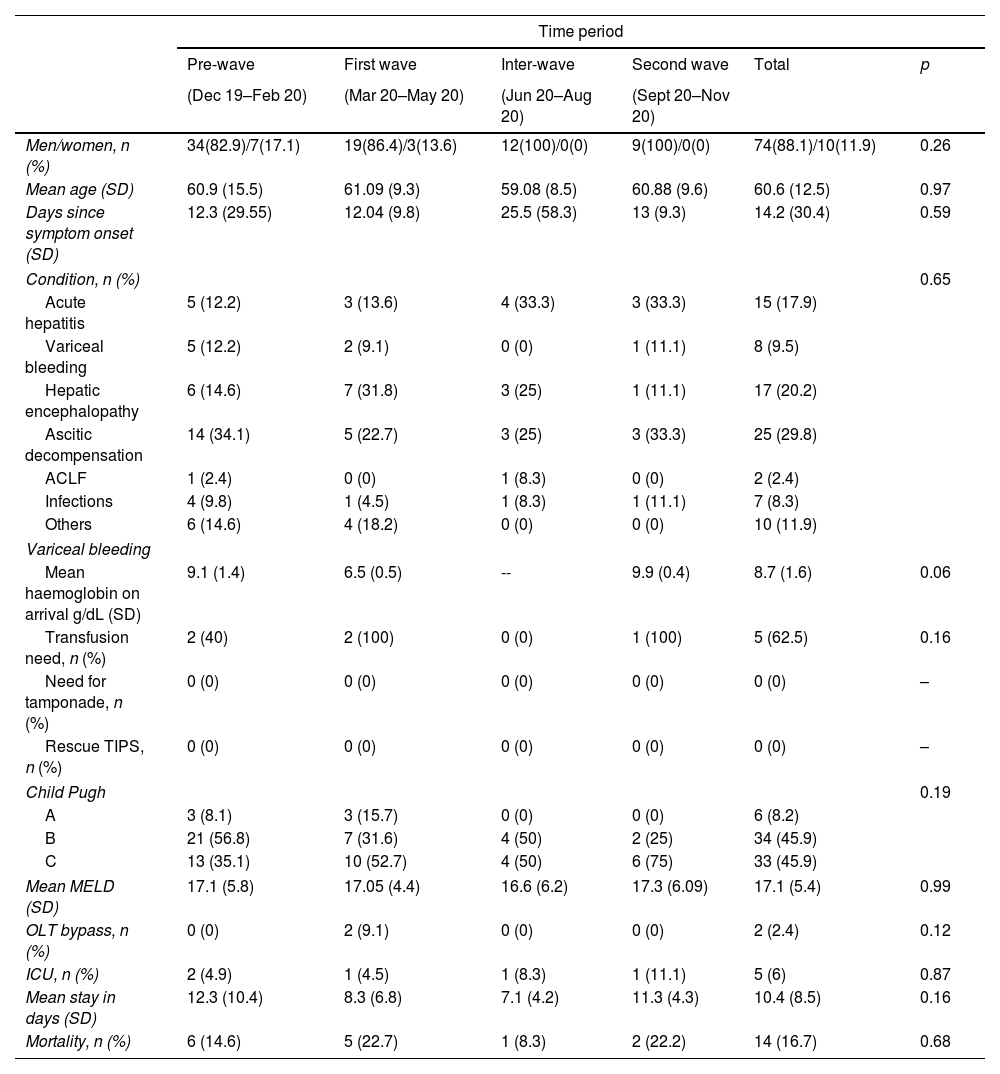
Regarding liver-related diseases, a clear predominance of the male sex was observed in admissions (88.1%) with a mean age of around 60 years. The most frequent reason for admission was ascitic decompensation of underlying cirrhosis (29.8%), followed by hepatic encephalopathy (20.2%) and acute hepatitis (17.9%). Regarding the functional stage, we did not find statistically significant differences, although we observed how the percentage of patients with advanced cirrhosis (Child–Pugh C) was higher during the “first” and “second wave” compared to the “pre-wave” and “inter-wave” periods (52.7 and 75% vs 35.1 and 50%). The longest mean stay was recorded in the inter-wave period (12.3 days) followed by the second wave (11.3 days) (Table 3).
Admissions for primary liver disease or complications of cirrhosis in the Gastroenterology Service.
| Time period | ||||||
|---|---|---|---|---|---|---|
| Pre-wave | First wave | Inter-wave | Second wave | Total | p | |
| (Dec 19–Feb 20) | (Mar 20–May 20) | (Jun 20–Aug 20) | (Sept 20–Nov 20) | |||
| Men/women, n (%) | 34(82.9)/7(17.1) | 19(86.4)/3(13.6) | 12(100)/0(0) | 9(100)/0(0) | 74(88.1)/10(11.9) | 0.26 |
| Mean age (SD) | 60.9 (15.5) | 61.09 (9.3) | 59.08 (8.5) | 60.88 (9.6) | 60.6 (12.5) | 0.97 |
| Days since symptom onset (SD) | 12.3 (29.55) | 12.04 (9.8) | 25.5 (58.3) | 13 (9.3) | 14.2 (30.4) | 0.59 |
| Condition, n (%) | 0.65 | |||||
| Acute hepatitis | 5 (12.2) | 3 (13.6) | 4 (33.3) | 3 (33.3) | 15 (17.9) | |
| Variceal bleeding | 5 (12.2) | 2 (9.1) | 0 (0) | 1 (11.1) | 8 (9.5) | |
| Hepatic encephalopathy | 6 (14.6) | 7 (31.8) | 3 (25) | 1 (11.1) | 17 (20.2) | |
| Ascitic decompensation | 14 (34.1) | 5 (22.7) | 3 (25) | 3 (33.3) | 25 (29.8) | |
| ACLF | 1 (2.4) | 0 (0) | 1 (8.3) | 0 (0) | 2 (2.4) | |
| Infections | 4 (9.8) | 1 (4.5) | 1 (8.3) | 1 (11.1) | 7 (8.3) | |
| Others | 6 (14.6) | 4 (18.2) | 0 (0) | 0 (0) | 10 (11.9) | |
| Variceal bleeding | ||||||
| Mean haemoglobin on arrival g/dL (SD) | 9.1 (1.4) | 6.5 (0.5) | -- | 9.9 (0.4) | 8.7 (1.6) | 0.06 |
| Transfusion need, n (%) | 2 (40) | 2 (100) | 0 (0) | 1 (100) | 5 (62.5) | 0.16 |
| Need for tamponade, n (%) | 0 (0) | 0 (0) | 0 (0) | 0 (0) | 0 (0) | – |
| Rescue TIPS, n (%) | 0 (0) | 0 (0) | 0 (0) | 0 (0) | 0 (0) | – |
| Child Pugh | 0.19 | |||||
| A | 3 (8.1) | 3 (15.7) | 0 (0) | 0 (0) | 6 (8.2) | |
| B | 21 (56.8) | 7 (31.6) | 4 (50) | 2 (25) | 34 (45.9) | |
| C | 13 (35.1) | 10 (52.7) | 4 (50) | 6 (75) | 33 (45.9) | |
| Mean MELD (SD) | 17.1 (5.8) | 17.05 (4.4) | 16.6 (6.2) | 17.3 (6.09) | 17.1 (5.4) | 0.99 |
| OLT bypass, n (%) | 0 (0) | 2 (9.1) | 0 (0) | 0 (0) | 2 (2.4) | 0.12 |
| ICU, n (%) | 2 (4.9) | 1 (4.5) | 1 (8.3) | 1 (11.1) | 5 (6) | 0.87 |
| Mean stay in days (SD) | 12.3 (10.4) | 8.3 (6.8) | 7.1 (4.2) | 11.3 (4.3) | 10.4 (8.5) | 0.16 |
| Mortality, n (%) | 6 (14.6) | 5 (22.7) | 1 (8.3) | 2 (22.2) | 14 (16.7) | 0.68 |
ACLF: acute on chronic liver failure; DILI: drug induced liver injury; TIPS: transjugular intrahepatic portosystemic shunt; MELD: model for end-stage liver disease; OLT: orthotopic liver transplant; ICU: intensive care unit.
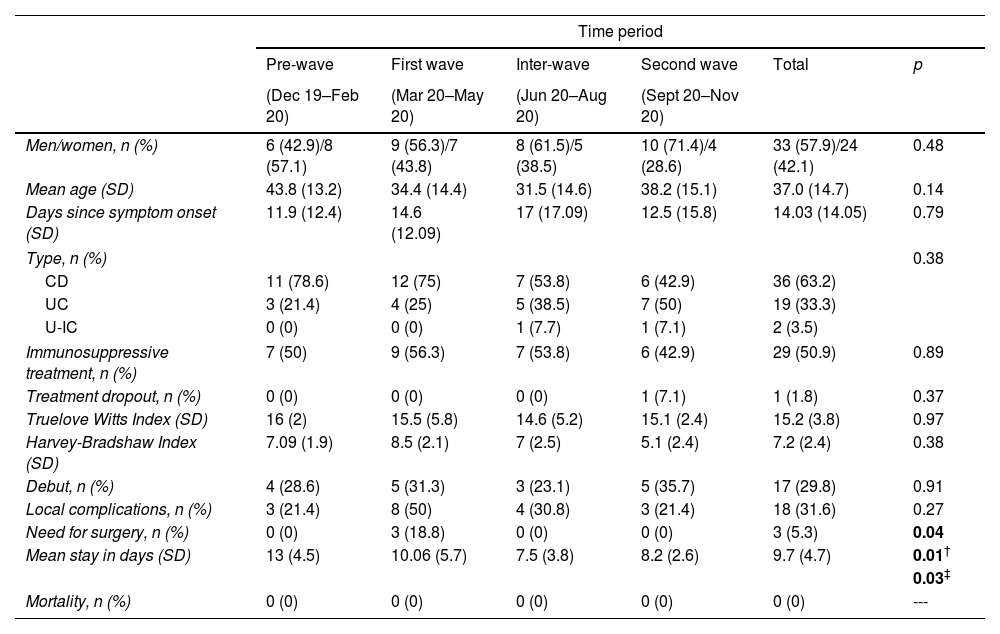
No differences were found in terms of sex, age and time from the onset of symptoms to emergency room consultation. Only one patient of the 29 under immunosuppressive treatment abandoned it. No differences were observed in the Harvey–Bradshow and Truelove–Witts indices at admission. Three patients required urgent surgery, all of them during the first wave (p 0.04). The mean length of stay was longer in the “pre-wave” group (13 days) compared to the “inter-wave” groups (7.5 days, p 0.01) and “second wave” (8.2 days, p 0.03). No deaths were recorded in patients hospitalised for IBD during the period evaluated (Table 4).
Admissions for Inflammatory Bowel Disease in the Gastroenterology Service.
| Time period | ||||||
|---|---|---|---|---|---|---|
| Pre-wave | First wave | Inter-wave | Second wave | Total | p | |
| (Dec 19–Feb 20) | (Mar 20–May 20) | (Jun 20–Aug 20) | (Sept 20–Nov 20) | |||
| Men/women, n (%) | 6 (42.9)/8 (57.1) | 9 (56.3)/7 (43.8) | 8 (61.5)/5 (38.5) | 10 (71.4)/4 (28.6) | 33 (57.9)/24 (42.1) | 0.48 |
| Mean age (SD) | 43.8 (13.2) | 34.4 (14.4) | 31.5 (14.6) | 38.2 (15.1) | 37.0 (14.7) | 0.14 |
| Days since symptom onset (SD) | 11.9 (12.4) | 14.6 (12.09) | 17 (17.09) | 12.5 (15.8) | 14.03 (14.05) | 0.79 |
| Type, n (%) | 0.38 | |||||
| CD | 11 (78.6) | 12 (75) | 7 (53.8) | 6 (42.9) | 36 (63.2) | |
| UC | 3 (21.4) | 4 (25) | 5 (38.5) | 7 (50) | 19 (33.3) | |
| U-IC | 0 (0) | 0 (0) | 1 (7.7) | 1 (7.1) | 2 (3.5) | |
| Immunosuppressive treatment, n (%) | 7 (50) | 9 (56.3) | 7 (53.8) | 6 (42.9) | 29 (50.9) | 0.89 |
| Treatment dropout, n (%) | 0 (0) | 0 (0) | 0 (0) | 1 (7.1) | 1 (1.8) | 0.37 |
| Truelove Witts Index (SD) | 16 (2) | 15.5 (5.8) | 14.6 (5.2) | 15.1 (2.4) | 15.2 (3.8) | 0.97 |
| Harvey-Bradshaw Index (SD) | 7.09 (1.9) | 8.5 (2.1) | 7 (2.5) | 5.1 (2.4) | 7.2 (2.4) | 0.38 |
| Debut, n (%) | 4 (28.6) | 5 (31.3) | 3 (23.1) | 5 (35.7) | 17 (29.8) | 0.91 |
| Local complications, n (%) | 3 (21.4) | 8 (50) | 4 (30.8) | 3 (21.4) | 18 (31.6) | 0.27 |
| Need for surgery, n (%) | 0 (0) | 3 (18.8) | 0 (0) | 0 (0) | 3 (5.3) | 0.04 |
| Mean stay in days (SD) | 13 (4.5) | 10.06 (5.7) | 7.5 (3.8) | 8.2 (2.6) | 9.7 (4.7) | 0.01† |
| 0.03‡ | ||||||
| Mortality, n (%) | 0 (0) | 0 (0) | 0 (0) | 0 (0) | 0 (0) | --- |
The number of scheduled admissions was reduced during the first wave (23) compared to the “pre-wave” group (34), a situation that was attempted to counteract during the two subsequent periods (60 and 54). The most frequent cause responsible for admission was biliary disease (56.7%, p 0.034) (Supplementary Table 2).
MiscellaneousNo differences were observed in sex, age, days from the onset of symptoms, mean length of stay, or mortality. The most frequent disease group independently was infectious/inflammatory/ischaemic ileo-colitis (34.3%) (Supplementary Table 3).
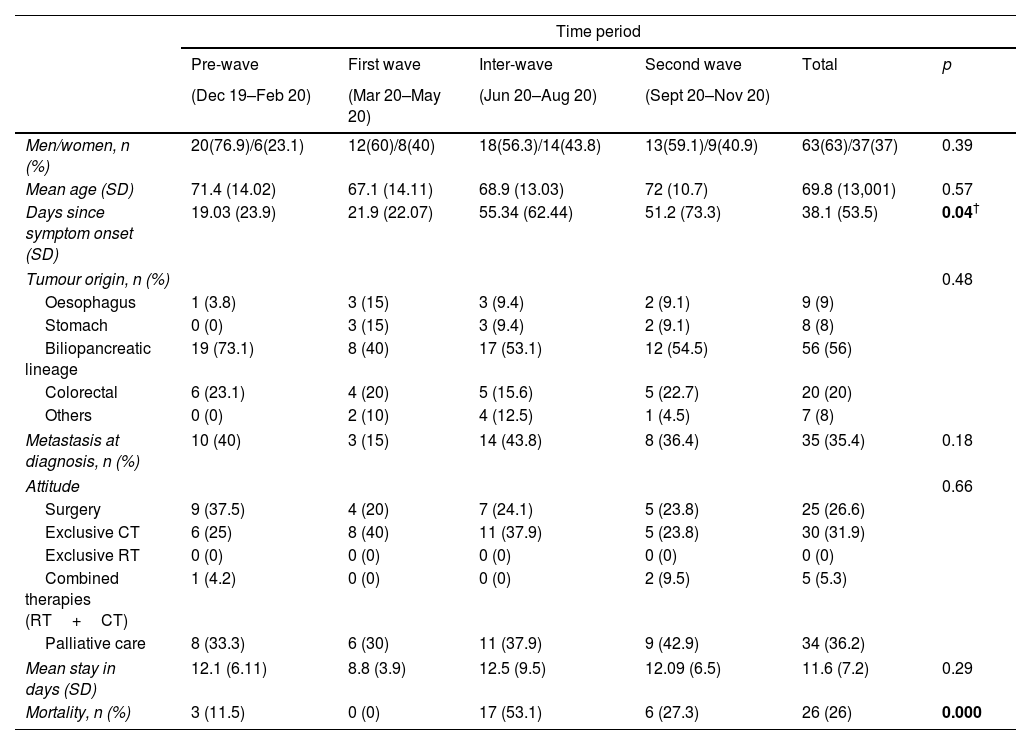
TumoursThe predominant sex was male with a mean age of around 70 years, without observing differences in the 4 periods. The number of days from the onset of symptoms to emergency room consultation was higher in the second semester, reaching statistical significance (p 0.04) between the “pre-wave period” (19.03 days) and the “inter-wave period” (55.34 days). The most frequent origin of tumour was biliopacreatic (56%) followed by colorectal (20%). Mortality was significantly higher during the second semester (Table 5).
Tumours diagnosed during hospitalisation in the Gastroenterology Service.
| Time period | ||||||
|---|---|---|---|---|---|---|
| Pre-wave | First wave | Inter-wave | Second wave | Total | p | |
| (Dec 19–Feb 20) | (Mar 20–May 20) | (Jun 20–Aug 20) | (Sept 20–Nov 20) | |||
| Men/women, n (%) | 20(76.9)/6(23.1) | 12(60)/8(40) | 18(56.3)/14(43.8) | 13(59.1)/9(40.9) | 63(63)/37(37) | 0.39 |
| Mean age (SD) | 71.4 (14.02) | 67.1 (14.11) | 68.9 (13.03) | 72 (10.7) | 69.8 (13,001) | 0.57 |
| Days since symptom onset (SD) | 19.03 (23.9) | 21.9 (22.07) | 55.34 (62.44) | 51.2 (73.3) | 38.1 (53.5) | 0.04† |
| Tumour origin, n (%) | 0.48 | |||||
| Oesophagus | 1 (3.8) | 3 (15) | 3 (9.4) | 2 (9.1) | 9 (9) | |
| Stomach | 0 (0) | 3 (15) | 3 (9.4) | 2 (9.1) | 8 (8) | |
| Biliopancreatic lineage | 19 (73.1) | 8 (40) | 17 (53.1) | 12 (54.5) | 56 (56) | |
| Colorectal | 6 (23.1) | 4 (20) | 5 (15.6) | 5 (22.7) | 20 (20) | |
| Others | 0 (0) | 2 (10) | 4 (12.5) | 1 (4.5) | 7 (8) | |
| Metastasis at diagnosis, n (%) | 10 (40) | 3 (15) | 14 (43.8) | 8 (36.4) | 35 (35.4) | 0.18 |
| Attitude | 0.66 | |||||
| Surgery | 9 (37.5) | 4 (20) | 7 (24.1) | 5 (23.8) | 25 (26.6) | |
| Exclusive CT | 6 (25) | 8 (40) | 11 (37.9) | 5 (23.8) | 30 (31.9) | |
| Exclusive RT | 0 (0) | 0 (0) | 0 (0) | 0 (0) | 0 (0) | |
| Combined therapies (RT+CT) | 1 (4.2) | 0 (0) | 0 (0) | 2 (9.5) | 5 (5.3) | |
| Palliative care | 8 (33.3) | 6 (30) | 11 (37.9) | 9 (42.9) | 34 (36.2) | |
| Mean stay in days (SD) | 12.1 (6.11) | 8.8 (3.9) | 12.5 (9.5) | 12.09 (6.5) | 11.6 (7.2) | 0.29 |
| Mortality, n (%) | 3 (11.5) | 0 (0) | 17 (53.1) | 6 (27.3) | 26 (26) | 0.000 |
Our study shows that the SARS-CoV-2 pandemic did not cause an increase in in-hospital mortality in a Digestive hospitalisation unit when comparing the different periods. A lower number of deaths was observed during the “first wave” attributable to the lower number of admissions recorded in this period, and not associated with a shortage of beds in the Gastroenterology Service determined by the increase of COVID-19 admission.
Unlike other countries such as the United States, where the most frequent cause of admission to a Digestive Service was gastrointestinal bleeding,9 in our area it was acute pancreatitis with approximately 1 out of every 5 admissions (19.05%), a percentage that remained stable during the 4 periods.
Regarding biliary diseases, our study observed how a greater number of cases of complicated biliary colic were admitted during the first trimester (30 vs 15, 20 and 11) and in the second semester (“inter-wave” and “second wave” periods) the number of admissions for acute cholangitis increased. In addition, a higher score on the Quick-Sofa scale on arrival was observed during the two waves (especially during the second) together with an increase in mortality in this last period. All this suggests that many patients had symptoms at home for which they did not request consultation early, and this may have led to an increase in the number of infections and a worse prognosis for them, with the consequent increase in mortality. These facts coincide with a greater impact of the SARS-CoV-2 pandemic in the province of Malaga during the months of September, October and November 2020.
Although in admissions for biliopancreatic diseases there was no delay in the demand for care by patients, the same did not occur in the case of non-variceal gastrointestinal bleeding. In the quarter prior to the start of the pandemic, patients admitted for this reason had taken an average of about 2 days to seek consultation since the symptoms had appeared. This delay was multiplied by 2 during the “first wave” and the “inter-wave” period (around 5 days) and multiplied by 5 during the “second wave” with an average of about 10 days. However, all this did not translate into a statistically significant increase in morbidity and mortality. Unlike other studies,10 in our cohort there was no increase in the time from arrival at the emergency department to the first endoscopy.
As for liver diseases, there was a decrease in the number of emergency admissions after the start of the pandemic, with no higher in-hospital mortality observed.
With reference to admissions for IBD, a shorter average stay was observed during the pandemic. A possible justification for this is the need to reduce the probability of nosocomial infection by SARS-CoV-2 in a group of patients who are often immunocompromised. On many occasions, this was possible thanks to the IBD unit facilities available in our department, which offers this type of patient comprehensive doctor-nurse care very early after hospitalisation.
In relation to diagnosed tumours, it is noteworthy how the delay in requesting assistance was more than double in the second half of the period studied with the consequent increase in mortality, a period that coincides with the greatest impact of the SARS-CoV-2 pandemic in the province of Malaga.
As strengths of the study, it should be noted that it is the first study in the literature that attempts to analyse, comprehensively, how the SARS-CoV-2 pandemic may have influenced hospital admissions and mortality in a Gastroenterology Service. As weaknesses, it should be noted, on the one hand, the retrospective and single-centre nature of the study. In addition, our study only analyses the short-term mortality and leaves out the potential increasing mortality in the long-term as a consequence of the delays in the diagnosis process. On the other hand, and underestimation of the group of patients who developed COVID and did not go to the hospital despite their digestive disease or those in whom, despite going, respiratory symptoms prevailed over their digestive condition, cannot be ruled out.
In conclusion, we can highlight that overall in-hospital mortality in the Digestive Tract among hospitalised patients has not increased with the advent of the SARS-CoV-2 pandemic, although higher in-hospital mortality has been recorded in biliopancreatic diseases and digestive tumours diagnosed in-hospital during the semester between June and November 2020, accompanied in the case of tumours, by a delay in the initial going to the Emergency Department. An analysis such as the one carried out in this study can help improve the organisation of devices and healthcare circuits in the Gastroenterology Services in future waves or pandemics, however, more studies would be needed in this regard to corroborate our results. In the meantime, it would be opportune that health care providers keep in mind the importance in future pandemic of reinforcing the duties of Gastroenterology Services and the need to establish clinical pathways in agreement to general practitioners to provide a quicker care for patients with alarm digestive symptoms.
Authors’ contributionsJ.P.B. A.M.G.G and G.A.B: contributed to the design of the study. J.P.B and A.M.G.G: contributed to write of the manuscript. M.G.C and R.J.A: both of them carried out the revision of the final version of this paper. All authors read and approved the final version of the manuscript.
FundingsInstituto de Investigación Biomedica de Málaga-IBIMA, Hospital Universitario Virgen de la Victoria, Universidad de Málaga, Málaga, Spain, Centro de Investigación Biomédica en Red de Enfermedades Hepáticas y Digestivas (CIBERehd), Madrid, Spain. CM21/00074 (Rio Hortega contract: J.M.P.B.).
Conflicts of interestNone declared.
The following are the supplementary data to this article: