
Given the research interest on Big Data in Marketing, we present a research literature analysis based on a text mining semi-automated approach with the goal of identifying the main trends in this domain. In particular, the analysis focuses on relevant terms and topics related with five dimensions: Big Data, Marketing, Geographic location of authors’ affiliation (countries and continents), Products, and Sectors. A total of 1560 articles published from 2010 to 2015 were scrutinized. The findings revealed that research is bipartite between technological and research domains, with Big Data publications not clearly aligning cutting edge techniques toward Marketing benefits. Also, few inter-continental co-authored publications were found. Moreover, findings show that research in Big Data applications to Marketing is still in an embryonic stage, thus making it essential to develop more direct efforts toward business for Big Data to thrive in the Marketing arena.
Enormous amounts of data are nowadays collected and stored by organizations, with the hope of being useful in the future. This poses the challenge of managing such loads of data and extracting from it appropriate knowledge for supporting decisions. Big Data is currently globally spread and widely accepted, representing also a synonym of vanguard in terms of information management, although this does not come without controversy (Fan & Bifet, 2013). In fact, as Chen, Chiang, and Storey (2012) argued, practitioners need to step forward “from Big Data to Big Impact” for effectively benefiting from the advantages provided by Big Data.
The support of decision making is a key issue for marketers, by providing insights to assist in answering critical questions such as: what is the most suitable product for a specific market; how to advertise such product in that market; through what communication channels; at what points in time and for what price; and supported by what kind of promotional and advertising actions. Given these premises, it is with no surprise that Marketing has become from the start a field for experiments with Big Data approaches (Bendle & Wang, 2016). Recent sources of loads of data include social media and mobile applications: both have proven to have a huge impact on customers’ decisions, directly affecting brand building (Moro, Rita, & Vala, 2016).
This paper outlines a research literature analysis on Big Data in Marketing framed in the 2010–2015 period. Considering Big Data in itself only holds value if it is harnessed aiming at extracting insightful knowledge, analytics has emerged as a pivotal trend to answer the challenges of Big Data in Marketing. In fact, marketing analytics solutions are now being disseminated throughout organizations in an attempt to benefit from Big Data solutions (Laurent, 2013), although most implementations are not yet achieved to effectively take advantage from such integrated Marketing-Big Data solutions (Chen et al., 2012). While analytics also apply to smaller volumes, emerging challenges regarding large volumes have recently risen, such as integrating a wide number of distinct sources, dealing with both structured and unstructured data, and performance issues. Therefore, analytics have also been included within this study. Nevertheless, it should be highlighted that the main focus of this study is to understand how Big Data is being managed and tackled to leverage Marketing challenges. Thus, by analyzing research conducted in this domain, the present study provides an overall picture of the current state of the art, contributing to a better understanding of this subject. With the aim of covering a large spectrum of the literature, a semi-automated text mining approach using topic modeling was adopted. The topics discovered provide the needed research insights on Big Data in Marketing.
2TheoryBig Data is everywhere these days, whether in the form of structured data, such as organizations traditional databases (e.g., customer relationship management) or unstructured data, driven by new communication technologies and user editing platforms (e.g., text, images and videos) (Lansley & Longley, 2016). Social networks such as Facebook and Twitter are having a huge impact on influencing customers’ decisions, leading organizations and brands to incorporate information originated in such platforms in their Marketing solutions (Moro et al., 2016). Therefore, Big Data is getting bigger.
Laney (2001) was among the first to mention the 3 Vs in Big Data management: Volume, Variety, and Velocity. Recently, two more Vs were included onto the Big Data equation: Variability, and Value. Gartner summarizes these five dimensions in its definition of Big Data in 2012 as “high volume, velocity and variety information assets cost-effective demand, innovative forms of information processing for enhanced insight and decision making” (Fan & Bifet, 2013). In order to harness Big Data, researchers have developed new techniques to capture, process, analyze and visualize large amounts of data within a limited processing timeframe. These techniques involve various disciplines: mathematics, statistics, optimization methods, signal processing, data mining and machine learning, visualization approaches and social network analysis (Chen & Zhang, 2014). The technologies and tools for exploring data can be divided in three classes: batch processing tools, streaming processing tools and interactive analysis tools. Each Big Data platform has a specific functionality and focus. For instance, some platforms are designed for batch processing, such as Apache Hadoop or Pentaho Business Analytics, while others are focused on real-time analytics, such as Apache Kafka or Storm (Chen & Zhang, 2014). In what concerns Big Data systems architecture, logical layers provide an approach to organize components that perform specific functions. Since layers are merely logical, they do not imply that the functions supporting each layer are run on separate machines or processes. A Big Data solution typically includes the four logical layers (Mysore, Khupat, & Jain, 2013): Big Data sources – different channels from which the data is generated; data messaging and store – layer responsible for acquiring and storing the data; analysis – where the data and insights are extracted; and consumption – application of the analysis layer results.
A Big Data system is only effective for business when it is set up for the extraction of useful knowledge to support business decisions (Sharda, Delen, & Turban, 2015). Predictive analytics solutions can be used on top of Big Data to facilitate that purpose, in a combined solution that can benefit from both the loads of data and advanced machine learning solutions (Hazen, Boone, Ezell, & Jones-Farmer, 2014). Predictive analytics based on Big Data drawn specifically for Marketing purposes are also called Marketing analytics solutions, aiming to provide solid ground Marketing understanding and techniques for marketers to solve real-world Marketing problems (Grigsby, 2015).
Recently, Malthouse, Haenlein, Skiera, Wege, and Zhang (2013) have identified guidelines for traditional customer relationship management (CRM) solutions to adopt for benefiting from the Big Data explosion that arose with social media. Their recommendations include the prescription of Marketing analytics principles, in both the form of predictive models and adequate human resources with analytical skills to take the most from CRM solutions. Other studies have also identified the need to incorporate analytics solutions in CRM encompassing widely known concepts in Marketing, such as the evaluation of customer lifetime value (Moro, Cortez, & Rita, 2015b).
Marketing analytic solutions drawn on top of Big Data may benefit organizations in a wide range of problems, such as identifying customers keener to respond positively to a telemarketing campaign (Moro, Cortez, & Rita, 2014), constructing interactive reports and dashboards for managers or even unveiling interesting trends from what is being said about the brand on social media (Lacoste, 2016). Therefore, Big Data solutions may be considered the foundations for insightful systems that effectively support marketers, relieving the burden of slow-paced human analysis (Sharda et al., 2015).
By the end of 2012 a gap was predicted for the forthcoming years in terms of Marketing enabling technologies and Big Data (Feinleib, 2012). Recent studies confirmed that while some work has been done for filling such gap, the size of the gap is increasing at the velocity of the inflation of Big Data availability (e.g., Erevelles, Fukawa, & Swayne, 2016). Hence, the next years offer a relevant opportunity for research and development of Marketing solutions that explore the knowledge provided by Big Data.
3Materials and methods3.1Literature selectionTo select the most relevant publications for this study, the focus was set on finding the most relevant journal articles on Big Data in Marketing, within a recent timeframe including the last six years. The search was performed selecting journal articles (including reviews and articles in press) from 2010 to 2015. This timeframe was selected according to the increase of Web interest in Big Data in these years (Ozkose, Ari, & Gencer, 2015).
In order to select the relevant set of articles, the following query was executed:
(marketing OR branding OR advertising OR “channel distribution” OR “consumer behavior”) AND (“big data” OR “data analytics” OR “big dataset” OR “massive data” OR terabyte OR exabyte OR zettabyte OR petabyte)
This query includes both Big Data and Marketing high-level concepts, considered equivalent and relevant terms for each area (e.g., Chen & Zhang, 2014 for Big Data; Grönroos, 1989 for Marketing). Since the main focus is Big Data technologies in Marketing, the query did not contain specific analytics terms. Also, considering new technologies on Big Data are emerging every day, only non-technical terms were searched through the query. Nevertheless, specialized technical articles result also in search hits as these often refer to “Big Data”. The domain sciences selected in ScienceDirect were the following three: Business, Management and Accounting; Computer Science; and Economics, Econometrics and Finance. The final number of articles collected was 1560, from a total of 211 different journals, proving the diversity of interested journals on Big Data in Marketing. The large majority of studies have been published in information systems journals. Annex 1 provides a glimpse of Marketing specific journals according to SCImago categorization, by showing those with two or more articles selected for the current analysis. Such result clearly suggests that there is still room opened for research on Marketing literature for Big Data. Also, the low number of articles per journal when compared to the high number of different journals indicates that research is spread through a wide variety of sources, proving the subject is considered relevant by most editors. Annex 2 displays the overall number of articles collected per year.
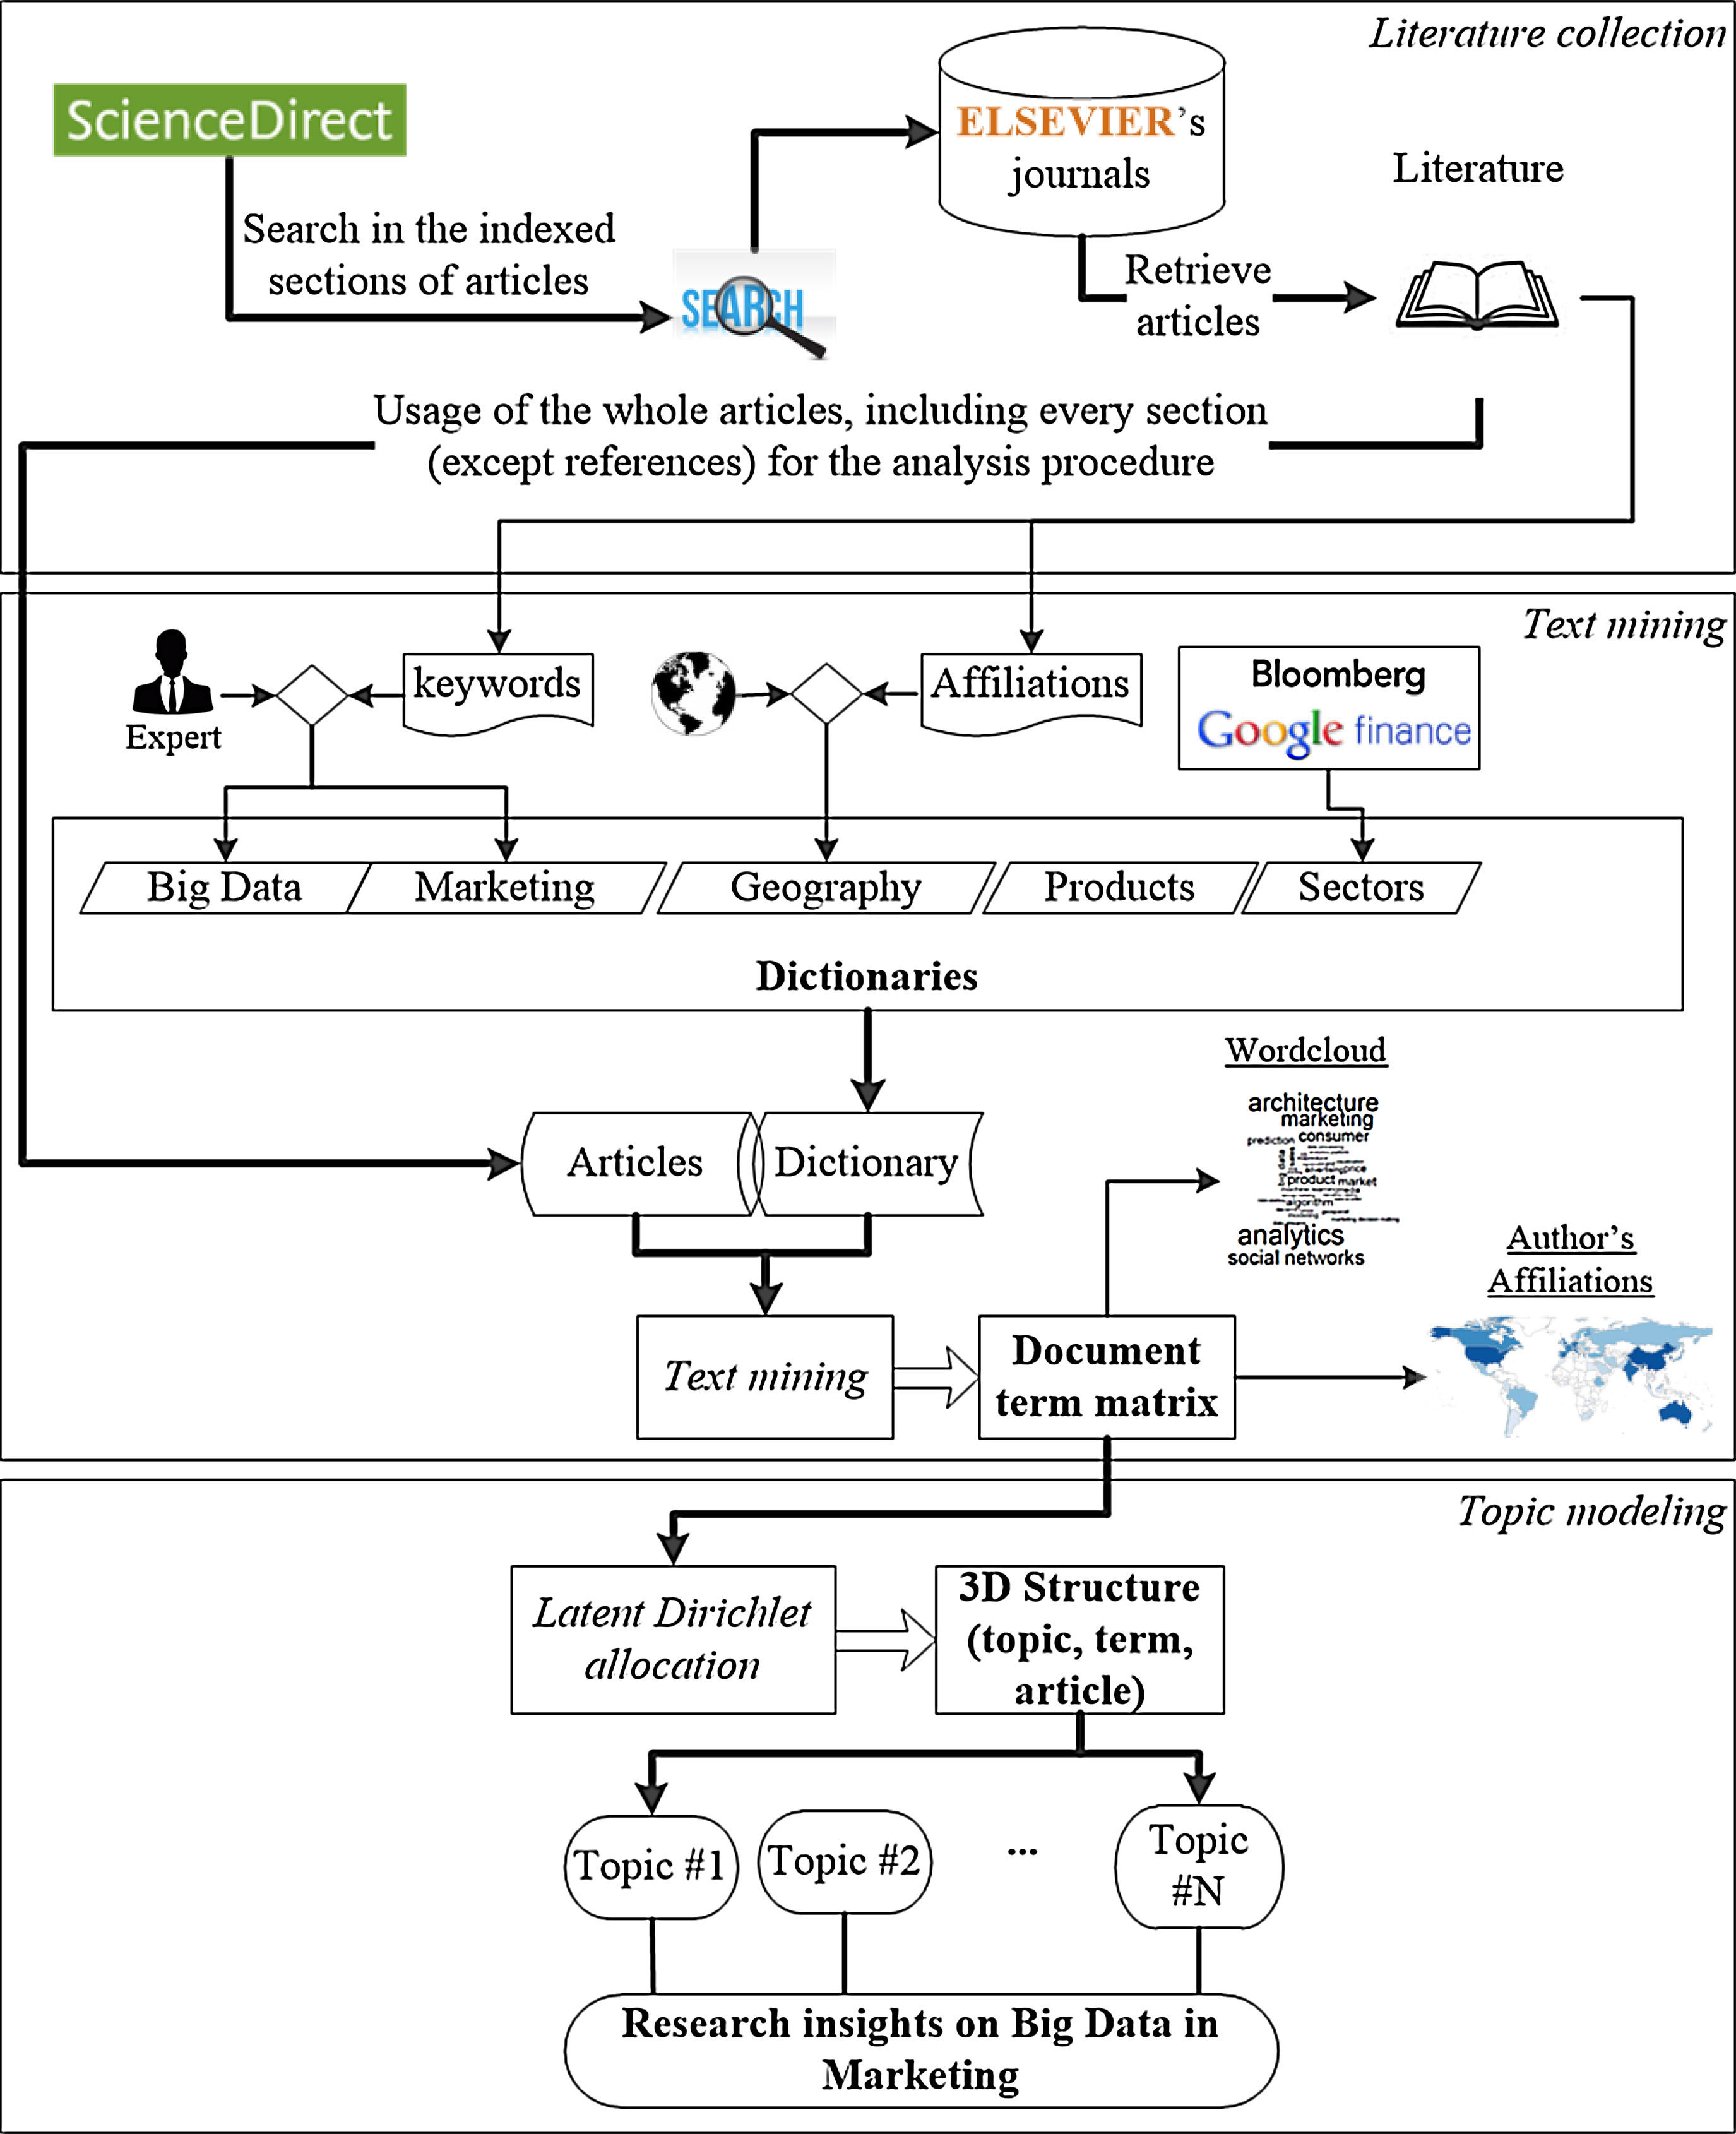
3.2Text mining and topic modeling procedureThe approach proposed is based on the study of Moro, Cortez, and Rita (2015a), with an important enhancement in what concerns to the definition of the dictionaries. Fig. 1 summarizes such approach. The selection of articles encompasses the steps described in Section 3.1. Building a representative dictionary of the subjects being analyzed is a key step in the undertaken procedure. This study includes five dictionaries: Big Data and Marketing dictionaries for encompassing broader terms underlined on these subjects; a geographical dictionary for author's affiliation; a sectors dictionary to account for the main economic sectors; and a products dictionary, splitting literature in physical goods and services.

Stemming is a technique often applied in Text Mining, in order to reduce similar words to a unique term (e.g., “predicting” and “predictive” are transformed in “predict”) (Kao & Poteet, 2007). Rather than just performing usual stemming, an extended list of related terms was created that includes other concepts in the same domain (Moro et al., 2015a).
The definition of dictionaries and the grouping of terms under a unique reduced term are subjective. To try reducing this subjectivity, several enhancements were introduced to the original method. The most significant is the usage of articles keywords to build both the Big Data and Marketing dictionaries, as shown in Fig. 1. Then the result of merging together all keywords for building the final dictionary was assessed. Examples of such keywords are “big data” and “massive data”.
The geographical dictionary was defined through the association of countries and cities to continents. This association was made with the author's information, extracting their address from each article with a text mining algorithm. As an example, if an article has authors from “Portugal” and “Brazil” then it belongs to two continents: “Europe” and “South America”.
The sectors' dictionary allows to identify the main sectors of the economy considered in the articles set. This dictionary was defined by consulting information on how the sectors are divided on Bloomberg (Bloomberg, 2015) and Google Finance (Google-Finance, 2015).
The products' dictionary intends to identify the principal products, divided into physical goods and intangible services, which are addressed in articles. This dictionary was defined with the help of the sectors dictionary, and also manually including related words. Each dictionary is a major input to the text mining procedure; the other is the full content of the articles (with exception of the references sections), as shown in Fig. 1. All dictionaries are available at: https://fenix.iscte-iul.pt/homepage/smcmo@iscte.pt/bigdatainmarketing.
For the computational experiments, the R statistical tool was adopted. Specifically, the “tm” package was chosen for the text mining procedures (Hornik & Grün, 2011), while the “topicmodels” was the choice for topic modeling with the latent Dirichlet allocation (LDA). This is the most popular topic modeling algorithm, with applications in a wide range of problems (e.g., in hotel online reviews, Calheiros, Moro, & Rita, 2017).
Text mining results in a matrix structure, which is a two-dimensional representation used as input to the LDA algorithm (the dimensions are the articles and terms, and each cell contains the frequency with which the term X appears in article Y). The document-term matrix characterizes the relationships between terms and documents through their frequency (Delen & Crossland, 2008).
The result of feeding LDA with the document-term matrix is a complex structure from which the topics and terms that define it can be obtained, characterized through a beta (β) distribution computed for each term for a given topic (a β closer to zero represents a tighter relation) (Blei, 2012). Also, for each article, the likelihood of matching it to each of the topics can be obtained. The three most significant terms for characterizing each topic according to the distribution are analyzed. As stated previously, the number of topics is a required parameter for LDA. Following the approach of Delen and Crossland (2008), this value was set to half of the terms considered, given that the requirement to run the LDA is at least two topics (Moro et al., 2015a).
4Results and discussion4.1Terms FrequencyIn this section, the analysis conducted is based on the first outcome from the procedure illustrated in Fig. 1, the document-term matrix, from which term frequencies can be directly extracted from the whole 1560 collected articles.
Annex 8 shows the worldwide spreading of authors for the studied literature. A darker background represents a country with more affiliated authors. The scale below the map displays the correspondence between the color tone and the number of affiliations. Countries such as the United States and China, heavily populated, dominate the landscape. However, other less populated countries are also highly represented, such as Australia and Spain. On the other hand, African authors are so scarce that the continent almost appears white. The exceptions are Ethiopia and South Africa.
4.2Topics discoveredThe topics generated through LDA modeling are displayed in tables, where the list presented is sorted by the total number of articles for the period under analysis (column labeled with “Nr.”). The column labeled with “T” enumerates each topic to facilitate referencing in the text. Next to “Nr.” the three most relevant terms are shown alongside with the corresponding β distribution values, which are converted to positives, since they are used only for comparison purposes (Moro et al., 2015a). A β closer to zero represents a tighter relation with the topic. Besides the total number of articles, the dissemination through the years from the timeframe considered is also shown.
From the five studied dimensions (i.e., Big Data, Marketing, Geographic location, Sectors and Products), topic modeling was processed considering: first, cross-domain between Big Data and Marketing; then, by using authors’ affiliation countries; finally, considering the activity Sectors. Since Products were divided in just two, goods and services, modeling these would not be useful, considering goods are completely distinctive from services, rendering a likely result of two topics, one for each kind of product.
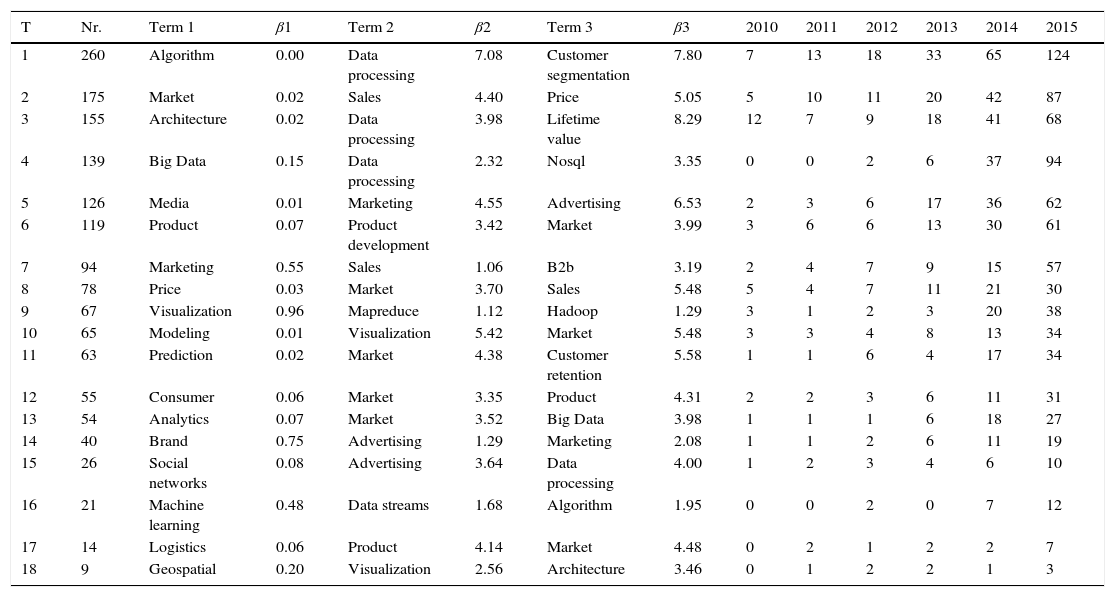
Table 1 presents the cross-domain topics for Big Data and Marketing, in a total of eighteen. The results show an increasing interest in Big Data applied to Marketing. For each topic there is always a dominant term, with a value that matches it closer to a certain Marketing question or to a type of Big Data technique, tool or context. A deeper analysis from the three most relevant terms per topic provides an interesting insight: there are a large number of topics mainly characterized by three terms all related with Big Data (four topics, numbers 4, 9, 16 and 18, with a total of 236 articles) and with all three terms associated with Marketing (eight topics, numbers 2, 5, 6, 7, 8, 12, 14 and 17, with a total of 701 articles). Such a result means that from the total of 1560 articles collected, 937 (around 60%) are mostly focused on just one of the domains, limiting cross-disciplinary research. This is an interesting finding, revealing a large gap for Big Data research that demonstrates the benefit to the Marketing discipline. Particularly relevant is the fact that Big Data emerges quite often in Marketing related publications, although there seems to exist low emphasis on the technical aspects that help to improve Marketing issues.
Relevant topics for Big Data in Marketing.
| T | Nr. | Term 1 | β1 | Term 2 | β2 | Term 3 | β3 | 2010 | 2011 | 2012 | 2013 | 2014 | 2015 |
|---|---|---|---|---|---|---|---|---|---|---|---|---|---|
| 1 | 260 | Algorithm | 0.00 | Data processing | 7.08 | Customer segmentation | 7.80 | 7 | 13 | 18 | 33 | 65 | 124 |
| 2 | 175 | Market | 0.02 | Sales | 4.40 | Price | 5.05 | 5 | 10 | 11 | 20 | 42 | 87 |
| 3 | 155 | Architecture | 0.02 | Data processing | 3.98 | Lifetime value | 8.29 | 12 | 7 | 9 | 18 | 41 | 68 |
| 4 | 139 | Big Data | 0.15 | Data processing | 2.32 | Nosql | 3.35 | 0 | 0 | 2 | 6 | 37 | 94 |
| 5 | 126 | Media | 0.01 | Marketing | 4.55 | Advertising | 6.53 | 2 | 3 | 6 | 17 | 36 | 62 |
| 6 | 119 | Product | 0.07 | Product development | 3.42 | Market | 3.99 | 3 | 6 | 6 | 13 | 30 | 61 |
| 7 | 94 | Marketing | 0.55 | Sales | 1.06 | B2b | 3.19 | 2 | 4 | 7 | 9 | 15 | 57 |
| 8 | 78 | Price | 0.03 | Market | 3.70 | Sales | 5.48 | 5 | 4 | 7 | 11 | 21 | 30 |
| 9 | 67 | Visualization | 0.96 | Mapreduce | 1.12 | Hadoop | 1.29 | 3 | 1 | 2 | 3 | 20 | 38 |
| 10 | 65 | Modeling | 0.01 | Visualization | 5.42 | Market | 5.48 | 3 | 3 | 4 | 8 | 13 | 34 |
| 11 | 63 | Prediction | 0.02 | Market | 4.38 | Customer retention | 5.58 | 1 | 1 | 6 | 4 | 17 | 34 |
| 12 | 55 | Consumer | 0.06 | Market | 3.35 | Product | 4.31 | 2 | 2 | 3 | 6 | 11 | 31 |
| 13 | 54 | Analytics | 0.07 | Market | 3.52 | Big Data | 3.98 | 1 | 1 | 1 | 6 | 18 | 27 |
| 14 | 40 | Brand | 0.75 | Advertising | 1.29 | Marketing | 2.08 | 1 | 1 | 2 | 6 | 11 | 19 |
| 15 | 26 | Social networks | 0.08 | Advertising | 3.64 | Data processing | 4.00 | 1 | 2 | 3 | 4 | 6 | 10 |
| 16 | 21 | Machine learning | 0.48 | Data streams | 1.68 | Algorithm | 1.95 | 0 | 0 | 2 | 0 | 7 | 12 |
| 17 | 14 | Logistics | 0.06 | Product | 4.14 | Market | 4.48 | 0 | 2 | 1 | 2 | 2 | 7 |
| 18 | 9 | Geospatial | 0.20 | Visualization | 2.56 | Architecture | 3.46 | 0 | 1 | 2 | 2 | 1 | 3 |
From the remaining six cross-disciplinary topics (accounting for the remaining 40% of articles), the first, with the largest number of articles, is mainly focused on Big Data algorithms, although it conceals a weak relationship with both “data processing” and “customer segmentation”, showing a relevant specific Marketing task such as segmentation which is highly dependent on data (Seret et al., 2014). A similar result occurs for topic number three, where architecture is weakly related to “lifetime value”, an apparently awkward connection that may be justified by the second term, “data processing”, which is a key asset toward an accurate evaluation of customer lifetime value. Topics number 10 and 11 are characterized by two of the most widely used broader terms when it comes to extracting value from data: “modeling” and “prediction”. Also, both highlight the usage of these terms to “market”. However, the latter holds a moderate relationship with “customer retention”, which is a specialized Marketing task. Likewise, topic number 13 also conceals a relation from “analytics” with “market”. Thus, three inter-disciplinary topics encompassing 182 articles (nearly 12% of the total) have a relationship with market, disregarding other more specific Marketing tasks. Topic number fifteen discovered a relationship between “social networks” and “data processing”; as the volumes of data keep increasing exponentially, it is crucial to quickly handle that data for extracting useful knowledge. Generally, the findings show evidence of the lack of real inter-disciplinary research that equally addresses problems and methods from both domains, calling for more applied research aiming to understand how Big Data is changing established paradigms in Marketing.
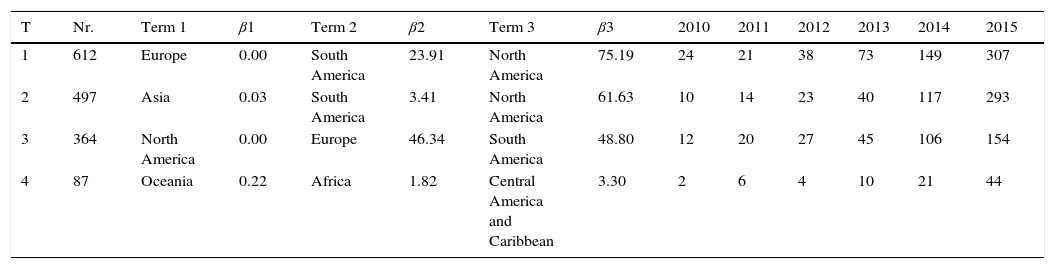
Table 2 provides valuable insights on authors’ affiliations regarding geographic location. It clarifies if authors are producing worldwide scale cross research on Big Data in Marketing, regarding distribution of continents. The results show that both North American and European researchers are not developing research with co-authors from other continents, given that both topics 1 and 3 achieve a β value of zero for Europe and North America respectively, representing a perfect match to these continents. The remaining two topics are closer related to Asia and Oceania, while also fitting articles published by South American and African authors, respectively.
Relevant topics for Geographical locations.
| T | Nr. | Term 1 | β1 | Term 2 | β2 | Term 3 | β3 | 2010 | 2011 | 2012 | 2013 | 2014 | 2015 |
|---|---|---|---|---|---|---|---|---|---|---|---|---|---|
| 1 | 612 | Europe | 0.00 | South America | 23.91 | North America | 75.19 | 24 | 21 | 38 | 73 | 149 | 307 |
| 2 | 497 | Asia | 0.03 | South America | 3.41 | North America | 61.63 | 10 | 14 | 23 | 40 | 117 | 293 |
| 3 | 364 | North America | 0.00 | Europe | 46.34 | South America | 48.80 | 12 | 20 | 27 | 45 | 106 | 154 |
| 4 | 87 | Oceania | 0.22 | Africa | 1.82 | Central America and Caribbean | 3.30 | 2 | 6 | 4 | 10 | 21 | 44 |
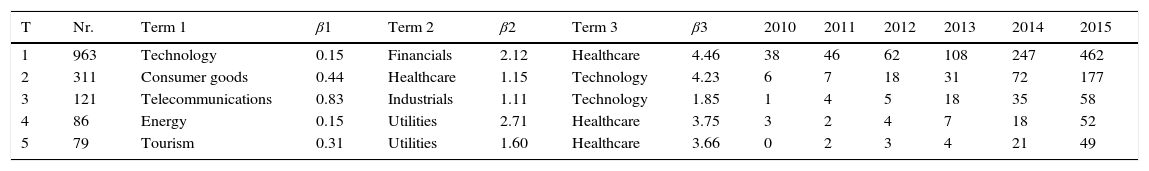
Table 3 presents the results of the LDA analysis when parameterized to five topics about Sectors. The first topic, with 963 articles (61.7%), is highly related to technology, which suggests that a large portion of researchers are pushing the edge on technology related to Big Data. Next topic is mostly about consumer goods, while showing some vicinity to healthcare (β=1.15). Topic number 3 provides the most solid inter-sectors relationship, between telecommunications and industrials. The last two topics encompass fewer articles in comparison with the remaining, and are mostly related with energy and tourism.
Relevant topics for Sectors.
| T | Nr. | Term 1 | β1 | Term 2 | β2 | Term 3 | β3 | 2010 | 2011 | 2012 | 2013 | 2014 | 2015 |
|---|---|---|---|---|---|---|---|---|---|---|---|---|---|
| 1 | 963 | Technology | 0.15 | Financials | 2.12 | Healthcare | 4.46 | 38 | 46 | 62 | 108 | 247 | 462 |
| 2 | 311 | Consumer goods | 0.44 | Healthcare | 1.15 | Technology | 4.23 | 6 | 7 | 18 | 31 | 72 | 177 |
| 3 | 121 | Telecommunications | 0.83 | Industrials | 1.11 | Technology | 1.85 | 1 | 4 | 5 | 18 | 35 | 58 |
| 4 | 86 | Energy | 0.15 | Utilities | 2.71 | Healthcare | 3.75 | 3 | 2 | 4 | 7 | 18 | 52 |
| 5 | 79 | Tourism | 0.31 | Utilities | 1.60 | Healthcare | 3.66 | 0 | 2 | 3 | 4 | 21 | 49 |
Set on the richness of the gathered information, an in-depth analysis was conducted by crossing the dimensions studied, namely:
- •
Products:
- ∘
Number of articles per Continent and year by Products (Annex 3).
- ∘
Products frequency by continent (Annex 9).
- ∘
Frequency of Top 5 Big Data terms per year by Products (Annex 4).
- ∘
- •
Sectors:
- ∘
Number of articles per year by Sector (Annex 5).
- ∘
Bar graphs per Continent with Sectors frequency (Annex 10).
- ∘
Frequency of Top 5 Big Data terms per year by Sectors (Annex 6).
- ∘
- •
Cross-continent affiliation assessment (Annex 7).
By taking into account the products, geographic affiliation and time dimensions, it is possible to observe the affiliation of authors for each type of product through the six years analyzed. For producing Annex 3, each article was automatically attributed to a type of product, “goods” or “services” (e.g., if it contains at least a “goods” term, it was accounted into such type). If, however, an article could be fitted in both types, it was accounted twice, one for each type of product. Such procedure allowed for an automated categorization for a first unweighted evaluation regarding term occurrences. For all years and continents, the number of articles directly associated with “services” is slightly above the corresponding number of “goods”. Such finding suggests that literature for Big Data in Marketing considering “services” puts more emphasis on studying the product.
Annex 9 helps to support the above claim, as it shows a visual picture of the product type distribution considering terms’ frequency inside each article. The results are consistent for every continent, with the number of occurrences within articles for “services” doubling the corresponding number for “goods”.
Annex 4 is based on the number of occurrences of Big Data top five most frequent related terms. The most interesting observation from this table is that while “architecture” and “Big Data” appear to attract a similar amount of attention for both “goods” and “services”, it is not clearly the case for “prediction”, in which “services” are drawing more attention than “goods”, especially in 2014 and 2015.
Annex 5 shows the published articles for each sector over the analyzed timeframe. Following a similar procedure used for composing Annex 3, each article was attributed to a sector, with a large number of articles fitting in more than one sector. “Technology” dominated the literature studied for all years, with a distribution consistent throughout the six years analyzed. In fact, almost every article could be fitted in “technology”: 1498 from the total 1560 articles, thus accounting for more than 96%; this is most likely a direct consequence of the breeding of Big Data among technological sectors.
Annex 10 shows the distribution of sectors per continent affiliation using bar graphs. The graphs from all continents show that “technology” receives the most attention from the ten studied sectors.
Annex 6 was constructed in a similar manner to Annex 4, by considering the five most frequent Big Data terms. However, since the frequency of terms changes for each sector, Annex 6 shows different rows for each sector. In almost all of the ten sectors, the most frequent Big Data terms are the same, although the order varies slightly: “architecture”, “analytics”, “prediction”, “algorithm”, and “Big Data”. The notable exception is “basic materials”, in which “machine learning” earned the third place, removing “Big Data” from the top five ranking.
Annex 7 provides a complementary validation for the topic modeling conducted for continent affiliation, in Table 2. The table presented in Annex 7 is a symmetric matrix through its diagonal. Asian researchers appear to be the most cooperative with colleagues from other continents, especially North Americans, but also with European and Oceania researchers. While not directly observable from Table 2, topic number 2 suggests that North American, and especially European, researchers are more involved in partnerships within their continents, a likely result of vast and advanced cooperation programs inside the USA and the European Union (Robson & McCartan, 2016).
5ConclusionsThis research literature analysis focused on the application of Big Data in Marketing, in an attempt to identify the trends in these applied domains through different dimensions. A total of 1560 articles published between 2010 and 2015 indexed in ScienceDirect's database were gathered and scrutinized. The large number of articles makes the usage of text mining an adequate choice for a better assessment of the literature. The results revealed that Big Data in Marketing has seen an increasing interest over the years, with each year doubling the previous one in publication output numbers. The application of text mining and topic modeling in the collected articles provides a summarized overview of the literature, by grouping articles in logical topics characterized by key relevant terms. Authors’ affiliation assessment enabled to conclude that most of the research originates from Europe, North America and Asia. Asian authors seem to be keener on searching inter-continental research. There are few publications in South America or Africa, two largely populated continents. However, such result could rise from an overall lower interest or research output in Big Data or data analytics in general and not generally related to the marketing field. Also, energy and healthcare are receiving around half of the attention of consumer goods in North America.
The findings from this study rise in the form of prescriptions for future research. First, while plenty of research is being conducted on Big Data and on Marketing, less is found in addressing specifically the benefits that marketers could potentially achieve through Big Data solutions. While Big Data adoption within the industry is taking place nowadays, there is a gap for research to clearly identify the pros and cons for organizations to invest in Big Data. As Akter and Wamba (2016) noted, after defining the boundaries for a Big Data solution, it is imperative that the implementation is perfectly aligned with the challenges posed by the specificities of the business, as each solution needs to be context-aware. The confirmation of such discovery unveiled a research gap in cross-disciplinary research, with technological researchers needing to better align the benefits of Big Data toward Marketing. It is interesting to note that although several specific Marketing related terms often seen as associated to data analysis were included (e.g., customer retention, customer segmentation), few appear highlighted in the topics uncovered, and the ones that did appear, show a weak relationship to the corresponding topic, paling in comparison to the relevance of the respective Big Data term.
Some limitations should be pointed out which could also be addressed in future research. First, Big Data research is still in its infancy as volumes of data keep piling up. Therefore, it is a very dynamic subject, implying the results presented may need updating in a narrow time window. Also, as Big Data conceals different challenges which may be translated into the known 5 Vs (Volume, Variety, Velocity, Variability, and Value), another research direction could be to understand the main requirements in designing Marketing solutions to answer each specific challenge.
The following are the supplementary data to this article: