


This paper seeks to analyze the influence investment in that investment in intangible resources, specifically training and advertising, has on the corporate market value.
A sample of the main Spanish companies, those quoted on the IBEX-35, revealed that both investing in training and in advertising separately have a positive relationship with the Market/Book ratio a year ahead (in both periods analyzed, 2006–2009 and 2008–2011). Regarding the joint effect, a positive and significant impact is also seen in both periods. The results are even more relevant for the second period (2008–2011) and we could therefore check how investments made during the current period of crisis have had a higher impact on market value.
The relevance of our paper for academics and practitioners should be noted, as there were no previous similar studies in Spain relating investments in these types of intangibles and market value using IBEX-35 companies. Practitioners likewise need to consider the positive effect on competitiveness of investment in competencies (human and relational competencies).
Some authors1 (Martelo & Cepeda, 2016) acknowledge that knowledge is the most valuable source of corporate intangible resources. Training is one of the essential factors that determine the efficiency of the organizations, given the speed at which the required skills and knowledge change and as employees are considered as an essential competitive resource to obtain a lasting competitive advantage, Furthermore, an increasingly greater number of companies are striving to maintain customers, with the main reason being the value of the clients for the companies. Therefore, this paper focuses on the influence of Intellectual Capital on business value. We have taken Human Capital and Relational Capital as the main dimensions of Intellectual Capital.
Some models are put forward that analyze the impact of the accumulated investment in each dimension on the market value of the company, along with a further one that analyses the joint impact of these IC dimensions on the market value of the company over two periods: 2006–2009 (beginning of the crisis) and 2008–2011 (during the crisis). We have deemed it convenient to analyze these two periods to separate the effect of investments in competencies on market value according to the period analyzed; we expect that the investments made when the crisis began had a higher impact on market value during the crisis, showing how the market more value those companies that have focused on competencies during a crisis period.
The paper is structured as follows: Section 2, on the grounds for the Resource Based View, justifies the key role of intangible resources in business competitiveness. It likewise reviews the literature that considers the relevance of knowledge-based intangibles, that is, Intellectual Capital. The same section also considers the effect on the value of the company of the two dimensions of Intellectual Capital, that is, Human Capital and Relational Capital, and the investments made in it. The methodology used is subsequently set out in Section 3. The results obtained are contained in Section 4 and the paper then concludes.
2Human Capital and Relational Capital: concepts and value creationThe Resource Based View has made a decisive contribution to strategic management. Different authors noted that companies have or control a wide variety of resources and combinations of them (capabilities) that are essential for the company to be able to operate. These resources have intrinsically different levels of efficiency, some of which are superior to others. Therefore, companies endowed with superior resources will have a greater likelihood of performing better (Barney, Ketchen, & Wright, 2011; Barney, 2001; Priem & Butler, 2001).
Amit and Shoemaker (1993) highlighted five differentiating characteristics: inimitable, rare, valuable, non-transferable and non-substitutable.
Intangible resources or “intangibles” are those that, lacking a financial or physical form and being constructed by the company over time, combine all these requirements with greater facility and therefore become the key factor of business competitiveness more frequently (Bradley, 1997; Lev, 2001). This statement is particularly applicable to the intangible resources based on knowledge, that is, to Intellectual Capital (IC).
Subramaniam and Youndt (2005, p. 451) state that IC is “the sum of all knowledge firms utilize for competitive advantage”. In short, as we have previously stated, IC is the sum of all knowledge-based intangibles.
When grouping and classifying IC elements, there is a certain consensus about three components or basic dimensions: Human Capital (HC), Structural Capital (SC) and Relational Capital (RC) (Bueno, 2011; Kaufmann & Schneider, 2004).
IC is also related to the creation of value in the company (García-Merino, Arregui-Ayastuy, Rodríguez-Castellanos, & García-Zambrano, 2010; Schiuma & Lerro, 2008). We understand, therefore, that proper management of these resources will allow companies to obtain competitive advantages and better business results.
We are going to focus on the Human Capital and Relational Capital dimensions of IC. There are some studies that argue that the main resources for obtaining a sustainable competitive advantage are those related to Human Capital and/or Relational Capital (Smithey & Ployhart, 2014; Unger, Raunch, & Frese, 2011).
Human Capital is the set of productive capabilities that the staff of the firm acquires by accumulating specific or general knowledge (Becker, 1967). Several authors (Diop, Pascot, & Mahmoud, 2013; Smithey & Ployhart, 2014) consider that it is the dimension that provides greater value for the company.
There are some empirical studies that have shown the positive relationship between Human Capital and results (Raineri, 2016; Smithey & Ployhart, 2014). Investment in employee training is considered as the main variable covering investment in HC (Singh, 2010; Vidal & Hurtado, 2012). Employee training is a factor of strategic importance as it generates HC, which involves obtaining sustainable competitive advantages that lead to better business results. In fact, some studies found a positive relationship between investment in training and different representative variables of value creation (Danvila & Sastre, 2009; Huselid & Becker, 1996; Kochan & Osterman, 1994).
We consider that the capacity to create value can be measured using the Market/Book Value ratio (M/B ratio), calculated as the market value of the company divided by the book value of equity investments, with the latter being defined as the difference between total assets and liabilities. This ratio has been considered as an indicator of future possibilities of corporate growth, as it states the relationship between how the market measures the future performance of companies and the net value of their material and financial assets. However, those future performance results will be the combination of intangible resources and material and financial assets, thus developing capabilities which will be a source of competitiveness for the company (Subramaniam & Youndt, 2005). For that very reason, the M/B ratio is also a proper indicator to measure the market value relevance of a company's intangibles.
However, it frequently happens that investments in intangible resources do not generate immediate returns: an intermediate period is necessary for those investments to have a positive effect on corporate performance. Furthermore, due to depreciation, the value of intangibles at a given time reflects only one part of the investments made during previous periods. Thus, we can define HC value stock in training as the accumulated investment in training using a depreciation rate in order to take into consideration the loss value of these resources.2
Therefore we set up the following hypothesis:H1 The accumulated investment in employee training positively impacts the market value relevance of a company's intangibles.
On the other hand, Relational Capital can be defined as “the combination of knowledge that is incorporated in the organization and people, as a consequence of the value derived from the relationships which they maintain with market agents and with society in general” (Bueno, 2011, p. 23). There are some authors that have established a direct link between some aspects of Relational Capital, such as customer satisfaction and/or loyalty indicators, and measures of actual market or financial performance (Allen & Wilburn, 2002; Kara, Spillan, & De Shields, 2005).
There are several studies that consider investment in advertising as the main variable to represent Relational Capital (Corrado, Hulten, & Sichel, 2009; Gopal & Goswami, 2017; Heiens, Leach, Newson, & MacGrath, 2016). In a similar way as the training investment case, some studies have found a positive relationship between investment in advertising and business results (Gopal & Goswami, 2017; Joshi & Hanssens, 2010; Vitorino, 2014).
And as before, we define the “RC value stock in advertising” as the accumulated investment in advertising using a depreciation rate.
Similarly, we present the following hypothesis:H2 The accumulated investment in advertising positively impacts the market value relevance of a company's intangibles.
On the other hand, we consider the possible joint effect of both investments (training and advertising) to be even more important:H3 The accumulated investments in employee training and in advertising jointly positively impact the market value relevance of a company's intangibles.
In addition, we believe that the competitive advantage generated by the investment in intangibles is not so clearly defined in a period of high economic growth. However, in a period of economic crisis, those companies that have invested in intangibles, especially if these investments are a combination of different types of intangibles, have a competitive advantage that results in a greater value creation (García-Merino, Arregui-Ayastuy, & Vallejo-Alonso, 2013; García-Zambrano, Rodríguez-Castellanos, & García-Merino, 2014). Thus, we present a fourth hypothesis:H4 The positive joint impact of accumulated investments in employee training and advertising on the market value relevance of a company's intangibles is more intense during a period of economic crisis.
The procedure to check the hypotheses was divided into three steps: first (Model 1), we checked the impact that accumulated investment in training has on the relevance of intangibles on a company's market value, measured using the M/B ratio a year ahead. We then checked (Model 2) the impact on the M/B ratio of accumulated investment in advertising. Finally, (Model 3), we analyzed the joint effect of the two dimensions on the M/B ratio. Models 1 and 2 are simple linear regressions. Model 3 is a multiple linear regression.
The data needed to conduct the study were obtained from the CNMV (Spanish Stock Market Commission) for the stock market value and from the websites of the companies for the spending on training, and from the Infoadex website for spending on advertising.
The accumulated investments were obtained by the sum of the investment in each year for each original variable (investment in training and investment in advertising) in the three years prior to Year t, depreciated by a percentage. The linear depreciation rates used are 15% (a life of approximately 7 years), 20% (a life of 5 years) and 30% (a life of 3 years). We use three annual periods as the depreciation rate of 30% did not permit previous effects to be considered.3
Data obtained were subjected to the χ2 normality test. Given that the variables were not normal, the decimal logarithm of each of the variables, which did present normality, was used for the analysis. Regarding the size bias, the logarithms of accumulated investments were divided by the logarithm of “Net Amount of the Turnover” to alleviate that problem, as suggested by other previous studies (Lev & Sougiannis, 1999).
We considered two periods of time: a period at the beginning of the financial crisis (2006–2009) and a second one, when the crisis was in progress (2008–2011). We considered the accumulated investment in each variable for 2006, 2007 and 2008 (first period) and also 2008, 2009 and 2010 (second period) and the M/B ratio for 2009 (first period) and 2011 (second period). We need to take into consideration that the effects of investing in training and advertising are not translated into immediate results, but an adaptation period is needed for a better market value to be reflected (Angelopoulus, Giamouridis, & Vlismas, 2012).4
Table 1 sets out the technical details of the study.
Technical details of the study.
| Population | 35 companies belonging to IBEX-35 | |
| Sample | Model 1 | 1st and 2nd period: 28 companies belonging to IBEX-35 |
| Model 2 | 1st period: 23 companies belonging to IBEX-35 | |
| 2nd period: 21 companies belonging to IBEX-35 | ||
| Model 3 | 1st period: 24 companies belonging to IBEX-35 | |
| 2nd period: 19 companies belonging to IBEX-35 | ||
| Analysis periods | 2006–2009, 2008–2011 | |
| Data type | Expenditure on training, expenditure on advertisement, stock market value, book value | |
| Data sources | CNMV (Spanish Stock Market Commission), Infoadex website, websites of the companies | |
| Data analysis technique | Models 1 and 2 | Simple linear regression |
| Model 3 | Multiple linear regression | |
| Schedule | May–June 2012 | |
As has been previously mentioned, a simple linear regression model was put forward that relates the accumulated investment in Human Capital, through employee training, and the M/B ratio for the company.

Given that there is a time lapse between the moment of performing the investment in training and the results obtained, the investment in Year t has not been considered but rather the investment in previous years.
We likewise considered two time periods, 2006–2009 and 2008–2011. In the first period in question, t is the end of year 2009 and years 2006, 2007 and 2008 (taking a 3 lag structure) were those where the investments were made, with their relevant depreciation. In the second period, t is the end of year 2011 and investments were made, with their relevant depreciations too in years 2008, 2009 and 2010 (taking also a 3 lag structure).
Therefore, the proposed model 1 would be as follows:
where


AITt−i: accumulated investment in training in the three prior periods:

STt−i: annual value of the spending on training during the three years prior to the current Year t
NTt: Net Turnover of Year t
α: applied depreciation percentage (α=15, 20, 30)
¿t: random error in t.
3.3Proposed Model 2: Relationship between investment in advertising and the market value relevance of a company's intangibles
Or, in more concrete way:
where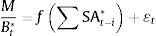

AIAt−i: accumulated investment in advertising in the three prior periods:

SAt−i: annual value of the spending on advertisement during the three years prior to the current Year t
M/Bt*, NTt, α and ¿t are as in Model 1.
3.4Proposed Model 3: Relationship between joint investments in training and advertising and the market value relevance of a company's intangiblesConsidering the joint effect that the two IC dimensions have over the total market value of the companies:

All the variables are as in previous models.
4ResultsTable 2 sets out the results of the linear regressions for Models 1 and 2 for a depreciation rate of 30%.5
Regression results. Models 1 and 2.
| 30% depr. rate | Period | No standard coefficients | Typified coeffic. | T | Sig. | Total sig. | R2 | |
|---|---|---|---|---|---|---|---|---|
| B | St. error. | Beta | ||||||
| Model 1 | 2006–2009 | 0.639 | 0.110 | 0.512 | 5.789 | 0.000 | 0.007 | 0.234 |
| Inv. in train. | 0.314 | 0.103 | 3.040 | 0.005 | ||||
| Model 2 | 0.833 | 0.066 | 0.622 | 12.646 | 0.000 | 0.044 | 0.124 | |
| Inv. in advert. | 0.357 | 0.103 | 3.460 | 0.003 | ||||
| Model 1 | 2008–2011 | 0.637 | 0.168 | 0.496 | 3.785 | 0.001 | 0.026 | 0.202 |
| Inv. in train. | 0.384 | 0.163 | 2.357 | 0.031 | ||||
| Model 2 | 0.675 | 0.165 | 0.399 | 4.083 | 0.000 | 0.003 | 0.354 | |
| Inv. in advert. | 0.354 | 0.166 | 2.130 | 0.044 | ||||
Therefore, the regression models are as follows:
MODEL 1: Period 1: 2006−2009→M/Bt*=0.639+0.314∑STt−i*+ε˜t, Period 2: 2008−2011→M/Bt*=0.637+0.384∑STt−i*+ε˜t
MODEL 2: Period 1: 2006−2009→M/Bt*=0.833+0.357∑STt−i*+ε˜t, Period 2: 2008−2011→M/Bt*=0.675+0.354∑STt−i*+ε˜t
Turning to the table, we can see how in the two periods considered, the models are statistically significant at 5%, according to the regression, in all cases.
The coefficients of the exogenous variables are positive and also statistically significant at 5%. This means that both investing in training and investing in advertising have a positive impact over the value relevance of a firm's intangibles.
Once corrected, the value is between 0.124 and 0.35, being statistically significant.6 The low value of R2 may be due to the small sample, and also to the existence of other variables that affect the dependent variable. Therefore, we have deemed it convenient to study the correlations between the investments in each dimension during the three years in question and the market value of a company's intangibles in Year t. Table 3 shows the aforementioned correlations.
Correlations between investment into training and advertisement in each year and M/B ratio in year t (first period).
| t=2009 | |||
|---|---|---|---|
| Inv. in train. 2006 | Inv. in train. 2007 | Inv. in train. 2008 | |
| M/B ratio 09 | |||
| Correl. | 0.400 | 0.400 | 0.500 |
| Sig. | 0.027 | 0.031 | 0.007 |
| Inv. in advert. 2006 | Inv. in advert. 2007 | Inv. in advert. 2008 | |
|---|---|---|---|
| M/B ratio 09 | |||
| Correl. | 0.707 | 0.714 | 0.671 |
| Sig. | 0.000 | 0.000 | 0.000 |
| t=2011 | |||
|---|---|---|---|
| Inv. in train. 2008 | Inv. in train. 2009 | Inv. in train. 2010 | |
| M/B ratio 11 | |||
| Correl. | 0.373 | 0.373 | 0.372 |
| Sig. | 0.042 | 0.042 | 0.043 |
| Inv in advert. 2008 | Inv. in advert. 2009 | Inv. in advert. 2010 | |
|---|---|---|---|
| M/B ratio 11 | |||
| Correl. | 0.488 | 0.471 | 0.453 |
| Sig. | 0.005 | 0.007 | 0.009 |
As can be seen, correlations between the “investment in training” variable and the M/B ratio are positive, which means that there is a relationship between the investment in training and the future company's intangible value, a relationship that is positive and strong and, according to the model studied, is statistically significant at 5%. Furthermore, correlations between “investment in advertising” and the M/B ratio are also positive and statistically significant at 5%. According to results obtained, we cannot reject H1 and H2.
Regarding the third model (Model 3), the results are set out in Table 4. Given that the behaviour of the models is better in the two previous models using the highest depreciation rate, we have taken this last rate (30%)7 into account.
Regression results. Model 3.
| Period | No standard coefficients | Typif. coeffs. | t | Sig. | Total sig. | R2 | ||
|---|---|---|---|---|---|---|---|---|
| B | St. error | Beta | ||||||
| 2006–2009 | Constant | 0.649 | 0.187 | 3.473 | 0.002 | 0.075 | 0.151 | |
| Inv. in train. | 0.287 | 0.121 | 0.473 | 2.380 | 0.027 | |||
| Inv. in advert. | 0.023 | 0.159 | 0.029 | 0.146 | 0.885 | |||
| 2008–2011 | Constant | 0.613 | 0.159 | 3.848 | 0.001 | 0.025 | 0.289 | |
| Inv. in train. | 0.325 | 0.158 | 0.419 | 2.059 | 0.056 | |||
| Inv. in advert. | 0.148 | 0.084 | 0.357 | 1.755 | 0.098 | |||
Turning to Table 4, we can see that the model is statistically significant at 10% for the first period considered. The beta of the investment in employee training is positive, with high value and also statistically significant at 5%. However the beta of the investment in advertising is not statistically significant. We can therefore see the highest importance of human capital dimension to increase the market value of the company in this period (2006–2009).
With respect to the second period, we see that the model is statistically significant at 5%; the accumulated investment in employee training has the highest Beta value, being statistically significant at 10%. Furthermore, the accumulated investment in advertising is positive and statistically significant at 10%. With regards to the corrected R2, the values are 0.15 and 0.289, being statistically significant, for each period considered. We have deemed it convenient to perform a Collinearity Diagnostic, in Table 5, to establish whether multicollinearity exists between the two exogenous variables used in the model.
Collinearity diagnostic.
| Period | Dimension | Autovalues | Index of condition | Proportions of the variation | ||
|---|---|---|---|---|---|---|
| Constant | ITe | IA | ||||
| 2006–2008 | 1 | 2.980 | 1.00 | 0.00 | 0.00 | 0.00 |
| 2 | 0.014 | 14.673 | 0.02 | 0.81 | 0.32 | |
| 3 | 0.006 | 22.903 | 0.98 | 0.19 | 0.67 | |
| 2008–2011 | 1 | 2.921 | 1.00 | 0.00 | 0.01 | 0.00 |
| 2 | 0.075 | 6.261 | 0.02 | 0.96 | 0.02 | |
| 3 | 0.004 | 26.059 | 0.98 | 0.03 | 0.98 | |
We can see that the indexes of condition do not reach the maximum of 30. We can therefore deduce there is no collinearity between the variables.
Given the relation between the accumulated investments in employee training and in advertising jointly and the market value relevance of a company's intangibles is achieved, we cannot reject H3.
Taking into consideration the intensity of the effect in the crisis period, the results of Model 3 show how in the second period (crisis in progress), the corrected R2 is higher, showing a higher joint explanation capacity of the variables. In addition, the significance of the model is higher. On the other hand, while in the first period the result of the impact of investments in advertising was not significant, it was at 10% in the second one. It seems logical to think that, when the crisis was in advance, the market valued more the competencies generated by Spanish companies that had invested more in intangibles. Therefore, we cannot reject H4.
5ConclusionsThis paper seeks to establish the importance of investing in IC dimensions and more specifically spending on training and advertising and its impact on the corporate intangible value in the Spanish case.
The results show, on the one hand, that there is a positive, and at the same time statistically significant, relationship between the accumulated investment in employee training and the market value relevance of a company's intangibles; on the other hand, there is also a positive, and at the same time statistically significant, relationship between the accumulated investment in advertising and the market value relevance of a company's intangibles. Regarding the joint effect, there is also a positive, and at the same time statistically significant, relationship for both periods considered. Therefore, the results show, on the one hand, that investing in Human Capital, and more specifically, in training the employees, increases the value of the company; on the other hand, that investing in Relational Capital, and more specifically, in advertising, also increases the value of the company; and finally, that joint investment in both variables increases the value of the company.
Apart from that, the third model (for the first period) suggests that the investment in employee training variable, as the main one representing the Human Capital dimension, is the variable that has the highest beta value, and it is likewise statistically significant. We can therefore conclude that investment in the Human Capital dimension has a higher impact on the market value of the company, and therefore, on the overall value of the company.
With regards the effect during crisis, the joint explanatory capacity of the investments in training and advertising is higher, the model's significance is higher, and the impact of the investment in advertising is even more significant, so that means that during a crisis period, the market values those companies more that had prioritized intangibles.
To sum up, it is important to mention the relevance of our paper for academics and practitioners. First, there were no previous studies that related investments in training and advertising to market value in Spain using IBEX-35 companies. Second, we have studied relationships for two specific periods: 2006–2009, a period of initial crisis, and 2009–2011, a period of crisis in progress- We could therefore check, on the one hand, the effect of previous investments in intangibles before the crisis on market value at a time of initial crisis; and, on the other, the effect of these investments on market value during a crisis period.
From a business management point of view, the results of this paper shows that, in a period such as the current one, when we are emerging from a far-reaching economic crisis, the investments in competencies linked to intangible resources, especially those related to a company's workforce, and also those linked to customers’ relationships, will have obvious positive effects on a company's competitiveness, and therefore, on value creation.
Nonetheless, this paper has several limitations: the first refers to the small sample we worked with. Furthermore, the study is limited only to Spanish companies. As well, it is worth noting that we have not included all IC dimensions that could give us more interesting results.
Possible lines of future research are, on the one hand, to expand the selected sample and include European companies quoted on the stock market, and on the other hand, to further research the additional effect of diverse variables related to Structural Capital on the market value relevance of the company's intangibles.
Lidia Garcia Zambrano Phd Researcher and Teacher in the Department of Financial Economics at the University of the Basque Country UPV-EHU. Her research activities are oriented towards the fields of the knowledge management: assessment of intangibles, concretely competences and Intellectual Capital and its impact on business value.
Arturo Rodríguez-Castellanos Plain Professor in Financial Economics. Dean of the Faculty of Economics and Business at the University of the Basque Country. Coordinator of the Research Group on Firm's Intangibles Valuation (VALINTE). Their research activities are oriented towards the fields of financial management, knowledge management and its relation with finance, and the financial valuation of intangibles.
Jose Domingo García-Merino As a Lecturer in Financial Economics at The University of the Basque Country. He researches towards international financial management, the financial valuation of intangibles and e-learning and is author of numerous articles in scientific magazines. He is member of the Research Group in Financial Valuation of Intangibles at the University of the Basque Country. He participates in e-learning practices developed by the University of the Basque Country. He is member of the Evaluation Committee of several journals.
We would like to thank the University of the Basque Country UPV-EHU (Ref. EHU11/37) and the FESIDE foundation (Ref. ECO2009-14383-C02-02) for funding this project.
Numerous authors have estimated the stock of capital, not only related to tangible resources, but also related to intangibles, through accumulated investments using a depreciation rate. Thus, Corrado et al. (2009) did so for the macroeconomic field, and Lev and Sougiannis (1999) and Lev et al. (2005) for the microeconomic field.
Previous studies considered similar depreciation rates. García-Merino et al. (2008) find that the average life of intangibles linked to HC and RC was between 3 and 5 years, which roughly correspond to linear depreciation rates of 20–30%. In turn, Whittard et al. (2009) and Awano et al. (2010) estimate an average life for training and reputation & branding of also 3–5 years, and for other intangibles 4–7 years. In the same line, Vallejo-Alonso et al. (2013), in a survey of CFOs, found that the mean lifetime of competencies associated to HC and RC was also 3–5 years. We likewise took 15% as a depreciation rate, chosen by other authors (Lev et al., 2005), which roughly corresponds to a lifetime of 7 years.
In this paper, we analyzed the impact of accumulated investments on the M/B ratio using lags higher than a year, but the results were worse than when using only one year. Therefore, we estimate that the maximum effect of investments on the M/B ratio is achieved by only using a one year lag.
We have likewise checked the regressions using the depreciation rates of 15%, and 20%. The best results are obtained with the depreciation rate of 30%. We therefore only have shown the results using this last rate.
The value of R2 increases when α increases, that is, the more recent investments in each dimension of Intellectual Capital are, the more it affects the firm's total value.
We have used the other two depreciation rates considered, but we have not included the results in the paper as they are very similar to the ones presented here. The full results are available on request.

www.publicationethics.org.