


Evidence concerning the impact of boards on firms’ governance and performance remains controversial. We explore the issue of board effectiveness by examining the supervisory role boards play and their advisory function. We examine the importance of these two roles in high technology contexts and control for the endogenous nature of the representative variables in boards. Our paper uses a sample of European firms to highlight that in high-tech industries the advisory function of boards provides higher explanatory power for performance than does the monitoring function, and that larger and less independent boards may improve governance and consequently enhance performance.
Boards of directors are undoubtedly one of the main mechanisms controlling firms. Over the past 20 years, interest in exploring the efficiency and activities of boards has been at the core of numerous studies in the field of corporate governance. These papers have heralded a fresh desire, in both academic and business circles, to see strong boards of directors, particularly when other governance mechanisms are inactive. Studies that address board effectiveness have run parallel to the papers that tackle governance in general. The first generation of mainly empirical papers, which was linked to the Anglo-American business world, assessed the efficacy of boards of directors within a context marked by a separation between ownership and management, and by the loss of strength of other governance mechanisms such as corporate market control. A second generation of papers transposed these ideas directly to other countries with different institutional and corporative frameworks. This interest led to the publication of numerous studies, again empirical in nature, which addressed the relevance and effectiveness of boards of directors in large and small, as well as listed and non-listed companies, in countries all over the world.
This flow of governance literature yields empirical constants that have at least rekindled interest in understanding the effectiveness of boards. The impact of these studies is reflected in recommendations put forward in the Codes of Good Governance published in most developed countries. Recommendations such as reducing board size, including outsider board members, encouraging committees on the board and proactive meetings, or separating the positions of chairman and CEO, are put forward.
Yet, these studies have been criticized for a variety of reasons (Hermalin and Weisbach, 2003). First, although it is true that certain consistent empirical tenets seem to have been established, no concise models of how boards should behave or function have yet been found. Thus, studies remain essentially empirical and offer an out-of-equilibrium view. Second and closely linked to the previous point, certain findings have been called into question due to the endogenous nature of the links between board characteristics and efficiency. This potential endogeneity complicates any analysis and makes it hard to interpret with any degree of certainty the relations between board and monitoring, or between board and performance. If the endogenous nature of the relations is not taken into account, findings are not easy to interpret, or, even worse, may prove wrong. Finally, governance literature focuses on a single function of the board, monitoring, and how conducting this task may impact performance, thus neglecting other features more closely linked to advisory functions. These criticisms have had such an effect on research into boards that a third generation of papers has now emerged.
This generation is characterized by studies aiming to fill the current theoretical gap, seeking optimal solutions to the problem of governance by modeling board behavior (Raheja, 2005; Adams and Ferreira, 2007; Drymiotes, 2007; Gillette et al., 2008; Hermalin and Weisbach, 2007; Harris and Raviv, 2008). Second, other papers highlight different board functions beyond simply monitoring, such as the advisory function. Recent papers have explored the circumstances in which each function is more prevalent (Coles et al., 2008; Lasfer, 2006; Adams and Ferreira, 2007; Boone et al., 2007; Drymiotes, 2007; Markarian and Parbonetti, 2007; Cheng, 2008; Linck et al., 2008). Third, econometric techniques have also come to the fore to provide, at least from the empirical standpoint, solutions to endogeneity problems inherent in relations between the characteristics and functioning of boards and performance.
Our paper is close to the second and third group of papers. Within that context, we explore how certain firm features may lead not only to enhanced monitoring of managers but also to efficient advising. We base our analysis of this issue on various assumptions: that efficient monitoring and advising lead to the creation of value; that certain features of the board may help it to effectively undertake one specific function, or another, or both, or one better than the other; and that the importance of each kind of function also depends on various characteristics of firms or the context in which they operate (see Adams and Ferreira, 2007; Linck et al., 2008; Coles et al., 2008). In other words, the relevance of the functions and the features of the board may be determined endogenously by performance or by other governance mechanisms, or exogenously by the area of business. One of the distinctive features of our paper is that we specify board effectiveness in monitoring and advising management according to exogenous factor, the knowledge intensity of the industry where a firm works.
Our analysis is conducted from an out-of-equilibrium perspective since we assume that companies do not adjust their boards immediately and efficiently. Rather, we suppose that there are multiple equilibria dependent on a variety of factors or barriers explaining why boards do not adapt when circumstances change, or at least why they do not change quickly. One of these barriers is the existence of a Board Code of Conduct in almost all developed countries putting pressure on firms to keep smaller and more independent boards. However, this kind of board is not always better when, for instance, other board functions, such as the advisory role are taken into account. A further reason that might influence the dynamics of board settings is the corporate ownership structure and the conflicts of interest generated by voting rights distribution in the firm. The fragile balance amongst directors might also explain why board changes are slow or complicated to carry out. Even market forces might influence how boards transform and adapt slowly to changing circumstances. Moreover, the existence of persistent empirical evidence concerning the link between board characteristics, functioning and performance might prove an indication of equilibrium. These reasons account for why we posit a relation between board characteristics and performance, which is shaped by the relevance of the monitoring and advising functions.
Our approach requires the use of econometric techniques that enable us to take account of potential endogeneity problems and the particular nature of each firm, those features that make it distinctive. Thus, our panel data regression uses the generalized method of moments (GMM) that provides efficient solutions to both previous questions. Our sample period is 1996–2005. We use a panel of European firms drawn from the UK, France, Italy, and Spain, totaling 2800 observations. Our findings highlight that the endogenous nature of the factors that define boards reveals substantial differences that underscore the contrasting role boards may play. In high-technology sectors, that require a greater level of specific know-how and where the advisory role proves more important than monitoring, both the number of board members as well as the proportion of insiders (less independence) clearly evidences a positive and significant impact on business performance. By contrast, smaller and more independent boards provide more efficient governance in contexts in which monitoring prevails over advising.
This paper is different with respect to the related literature in three ways. Firstly, it identifies a context where the advising function is more relevant than the monitoring one because of the relevance of knowledge in specific industries (e.g. the high-tech industry). Unlike other recent papers (Coles et al., 2008; Linck et al., 2008) that analyze how several variables contribute to strengthen the advising and/or monitoring function of outsiders, our paper identifies where the advising function is prevalent and how board characteristics facilitate carrying out this function. Secondly, our empirical research assesses and solves the endogeneity problem using instrumental variables and the GMM estimator. This estimation technique allows eluding the identification and specification of the models that describe the behavior of the endogenous variables. Thirdly, we have broadened the scope of this study to include countries different from the United States. Our international sample allows for evaluation if the board advising needs are relevant in countries where other governance mechanisms work and go beyond the legal and institutional differences across countries.
The paper is structured as follows. In Section 1 we review the literature on boards of directors and pave the way for the hypotheses on which we base our empirical work. In Section 2 we introduce the data, identify the variables and set out the method used. In Section 3 we present the main findings of the empirical analysis and assess the implications. Section 4 concludes.
1Review of board of directors literature and hypothesisMany papers that investigate boards of directors explore how various features or specific behaviors of the board impact performance, because these features reflect the board's capacity to discipline management, an action which is central to monitoring. Underlying this approach is the issue of solving the problems that arise from the separation of shareholders and management. Management that enjoys a greater degree of freedom may take decisions that elevate its own interests to the detriment of shareholders. By monitoring and controlling, the board's key role is to ensure that this does not happen (John and Senbet, 1998).
The empirical literature on governance highlights that certain features of boards are more suited to undertaking this task than others. Numerous papers (Baysinger and Butler, 1985; Yermack, 1996; Fernandez et al., 1997; Rosenstein and Wyatt, 1997; Eisenberg et al., 1998; Klein, 1998) show that due to problems of coordination, control, and decision-making, oversized boards fail to monitor efficiently. Further, CEOs may use large boards for their own benefit. This belief has become so deep-rooted that it is hard to find any Code of Good Practices that does not include a recommendation to reduce the number of board members.
The same is true for board composition, perhaps the most studied characteristic in papers about boards and corporate governance. Conventional wisdom proposes including outside (independent) board members who can monitor managers’ behavior adequately without conflict of interests. These members can also represent (minority) shareholders who are not present on the board, defend the views of other stakeholders, or provide the necessary safeguard to restrict management's discretionary behavior. The logic behind the idea of including outsiders seems clear, yet the evidence for this idea is not. The findings on linking board composition to performance remain controversial and far from conclusive. Although certain papers have pointed to a positive link between independence and value (Baysinger and Butler, 1985; Rosenstein and Wyatt, 1990), others fail to find any conclusive evidence or have even posited a negative relation (Hermalin and Weisbach, 1991; Bhagat and Black, 1999).1 Nevertheless, including outsiders is a recommendation found in the majority of good governance practices.
Other issues concern how the board works to improve its performance. As a means of dealing with the problems that arise from oversized boards, one area which several papers explore, is the suitability of delegating the monitoring task to smaller committees which may, depending on the issue in question, be more or less independent. In recent years, firms have set up committees to deal with such matters as auditing (in many countries auditing committees are compulsory), appointments, remunerations, or strategy. There is some evidence in favor of committees as a means of enhancing the advisory role of the board (Klein, 1998). Another area to come under scrutiny has been the frequency of board meetings to discuss and decide which direction the firm should take. The limited amount of available evidence seems to point to the belief that more frequent meetings are a reaction to poor company performance, rather than a desire to monitor and safeguard against poor results (Vafeas, 1999).
Monitoring and controlling managers are the board's main role, which does not of course imply that boards do not have other tasks to perform. Part of the board's job and that of its individual members are to assist, encourage, and advise management on the running of the firm by setting goals, assessing investment opportunities, and so on, and by making available to management both the general and specific knowledge individuals possess as board members. Recent papers, such as those by Helland and Sykuta (2004) and Adams and Ferreira (2007), stress the importance of this function. These authors argue that on some occasions the advisory function prevails over the supervisory role.
Bearing this fresh viewpoint in mind, some of the previously stated hypotheses may be reconsidered or redefined. For instance, if the advisory function is considered to be more important, then having a larger and less independent board should not prove a stumbling block. This increase would obviously be a reasonable hypothesis if a greater number of board members implied enhanced knowledge and ability to advise. Furthermore, depending on the knowledge required and the kind of business in question, a greater number of managers (insiders) should have no adverse effect. Insofar as insiders may have access to more information and a deeper understanding of the business, making this knowledge available to the board (and the outsiders) may help it perform its role more efficiently and create greater value for the firm (Adams and Ferreira, 2007; Harris and Raviv, 2008).
As Adams and Ferreira (2007) posit, there is a trade-off between the two functions of a board. If managers provide board members with information, then the board may in turn be able to advise the managers more efficiently. Nevertheless, such information may also determine which options are available to the board and thus allow the board to interfere in managers’ decisions. The CEO may be reluctant to disclose too much information if the board is highly independent from management. The importance of either monitoring or advising may determine which kind of board proves more efficient for the firm, the more independent board that undertakes stricter monitoring, or the less independent that advises management. This twofold function may ultimately lead to a trade-off between board (in)dependence and the supply of information that could lead the board to carry out its mission more efficiently and create more value.
Determining when one particular function proves more important than the other is central to our research. We assume that the advisory role could be more valuable in contexts where information and knowledge are key point of business, as high-tech industries. Such industries demand a high degree of specific knowledge, either because of the complex nature of the production process, R&D intensity, or the difficulty involved in processing information. In such firms, the boards of directors play a key role in putting forward valuable suggestions aimed at running the business, determining strategy, or interpreting business opportunities (Adams and Ferreira, 2007; Coles et al., 2008). In these contexts, any increase in the number of board members would not prove harmful if it were to provide management with useful advice. A less independent board, with more insiders, would not be inadvisable if it is able to share more and better information with the outsiders, and conducts to advise management efficiently. Depending on which information must flow from managers to advisors and vice versa, and how relevant that information is to running the business, a board with a greater (smaller) percentage of insiders (outsiders) would prove more suitable (Linck et al., 2008; Harris and Raviv, 2008). In such circumstances a highly independent board might even prove quite harmful to the firm.2
As a result, we test the following hypothesis: In high-tech sectors, the advisory role of the board becomes more important than monitoring, such that (1) there is a positive link between performance and board size; (2) there is a negative link between performance and board independence; and (3) there is a positive link between performance and number of board meetings.
In short, the traditional hypotheses on the board characteristics needed to efficiently monitor management must be redefined to take account of the advisory role. Underlying this approach is the idea that the nature of the board reveals its capacity, or indeed its willingness, to monitor and advise efficiently, and that the latter function prevails in firms operating in knowledge-intense sectors. This double function might enable us to account, at least in part, for the conflicting findings to emerge in governance literature addressing the impact of board structure and value.
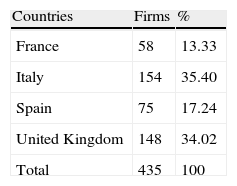
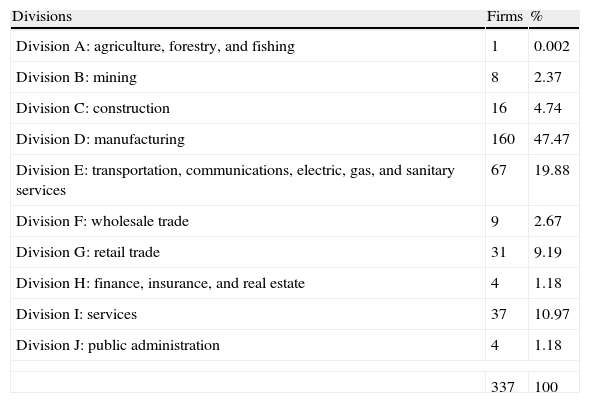
2Sample, variables, and econometric approach2.1DataThe sample comprises individualized data from nonfinancial listed firms. We obtain our data from the Compustat, Amadeus, and Spencer Stuart Boards Index databases. Our sample covers Spain, France, Italy, and the UK for the 1996–2005 period. Tables 1 and 2 show the distribution of the firms in the sample by sectors and countries. The initial sample is made up of 435 firms and comprises 2800 observations.
Distribution of firms by sectors. Standard industrial classification division structure.
| Divisions | Firms | % |
| Division A: agriculture, forestry, and fishing | 1 | 0.002 |
| Division B: mining | 8 | 2.37 |
| Division C: construction | 16 | 4.74 |
| Division D: manufacturing | 160 | 47.47 |
| Division E: transportation, communications, electric, gas, and sanitary services | 67 | 19.88 |
| Division F: wholesale trade | 9 | 2.67 |
| Division G: retail trade | 31 | 9.19 |
| Division H: finance, insurance, and real estate | 4 | 1.18 |
| Division I: services | 37 | 10.97 |
| Division J: public administration | 4 | 1.18 |
| 337 | 100 | |
We filter the sample in several ways to ensure coherence in the proposed variables. We remove those observations with their own negative equity, and those with unusual extremes in the market and book value of their equity, in total assets or turnover. We also remove firms whose market value of shares is more than 20 times their book value.
2.2VariablesOur dependent variable is a value-creation measure. We calculate it through the financial Q, as defined in the following expression:
where SMV is the market value of the shares, SBV is the book value of the shares, and TD is the book value of total debt. In all cases, our sample observations refer to firm i and to period t.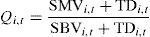
For the independent variables, we first include three variables that represent board composition and activity. Thus, LNBOASIZEi,t is the natural logarithm of the total number of board members, OUTPROi,t measures the proportion that outsiders represent out of the total number of board members, and LNMEYEARi,t represents the natural logarithm of the number of meetings held each year by the board.
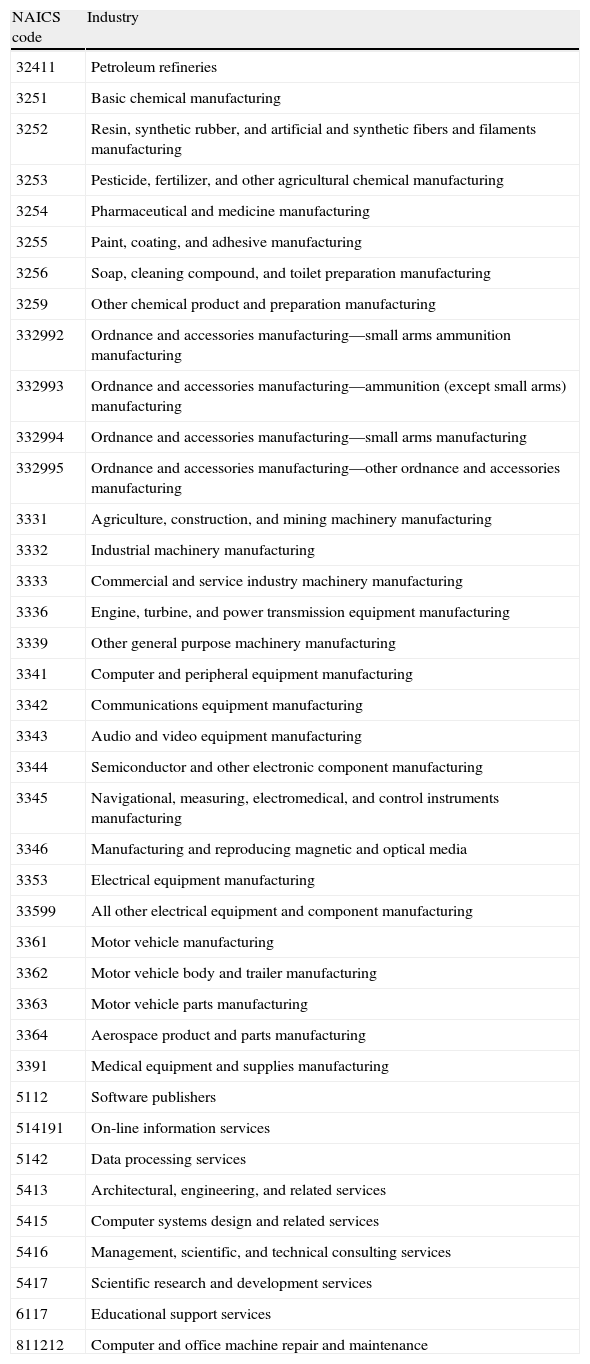
When verifying the impact of specific board characteristics and behavior on firm performance, it is essential to know which of the two basic functions, controlling or advising, prevails in each situation. To achieve this, there are certain exogenous factors that help us to characterize boards of directors and to shed some light on the controversial link between the nature and behavior of a board and firm performance. One of these is the nature of the firm's business. According to its nature, the firm will require a higher or lower level of specific knowledge. Knowledge-based business activity tends to be found in high-tech sectors. To pinpoint these sectors, the U.S. Bureau of Labor Statistics (BLS) drew up a list of high-tech sectors based on the Standard Industrial Classification (SIC) codes in 1999 (Hecker, 1999). However, the data published in the 2006 State Indicators are taken from the conversion of the SIC list of codes to the 1997 North American Industrial Classification System (NAICS). Table 3 shows the NAICS codes, which cover 39 categories. These categories are converted to SIC codes through a convergence table for the two classification systems (Hecker, 1999). Using this classification, we construct a dummy variable (HT) that takes the value one when the firm belongs to a high-tech sector, and zero otherwise.
1997 NAICS codes constituting high-technology industries.
| NAICS code | Industry |
| 32411 | Petroleum refineries |
| 3251 | Basic chemical manufacturing |
| 3252 | Resin, synthetic rubber, and artificial and synthetic fibers and filaments manufacturing |
| 3253 | Pesticide, fertilizer, and other agricultural chemical manufacturing |
| 3254 | Pharmaceutical and medicine manufacturing |
| 3255 | Paint, coating, and adhesive manufacturing |
| 3256 | Soap, cleaning compound, and toilet preparation manufacturing |
| 3259 | Other chemical product and preparation manufacturing |
| 332992 | Ordnance and accessories manufacturing—small arms ammunition manufacturing |
| 332993 | Ordnance and accessories manufacturing—ammunition (except small arms) manufacturing |
| 332994 | Ordnance and accessories manufacturing—small arms manufacturing |
| 332995 | Ordnance and accessories manufacturing—other ordnance and accessories manufacturing |
| 3331 | Agriculture, construction, and mining machinery manufacturing |
| 3332 | Industrial machinery manufacturing |
| 3333 | Commercial and service industry machinery manufacturing |
| 3336 | Engine, turbine, and power transmission equipment manufacturing |
| 3339 | Other general purpose machinery manufacturing |
| 3341 | Computer and peripheral equipment manufacturing |
| 3342 | Communications equipment manufacturing |
| 3343 | Audio and video equipment manufacturing |
| 3344 | Semiconductor and other electronic component manufacturing |
| 3345 | Navigational, measuring, electromedical, and control instruments manufacturing |
| 3346 | Manufacturing and reproducing magnetic and optical media |
| 3353 | Electrical equipment manufacturing |
| 33599 | All other electrical equipment and component manufacturing |
| 3361 | Motor vehicle manufacturing |
| 3362 | Motor vehicle body and trailer manufacturing |
| 3363 | Motor vehicle parts manufacturing |
| 3364 | Aerospace product and parts manufacturing |
| 3391 | Medical equipment and supplies manufacturing |
| 5112 | Software publishers |
| 514191 | On-line information services |
| 5142 | Data processing services |
| 5413 | Architectural, engineering, and related services |
| 5415 | Computer systems design and related services |
| 5416 | Management, scientific, and technical consulting services |
| 5417 | Scientific research and development services |
| 6117 | Educational support services |
| 811212 | Computer and office machine repair and maintenance |
As control variables, we consider the level of debt (DTABi,t), which we define as the quotient between total debt and assets; the size of the firm (LNTABi,t), which we define as the natural logarithm of the total value of assets; and the existence of a controlling shareholder with enough incentives to monitor the managers. We construct a dummy variable (CONTROLLER) that takes the value of one if over 25% of the average ownership is in the hands of the main shareholder during the period for which observations exist for a specific firm, and zero otherwise. We also use dummy variables that allocate each firm to a specific business sector (SECTOR) or a specific country (COUNTRY), and also assign each observation to a specific year (YEAR). For allocation to a business sector, we use the SIC code obtained from the Compustat database, the main groups of which appear in Table 2. Therefore, the SECTORj variable, j ranging from one to ten, is a dummy variable that takes the value one when the firm belongs to sector j, and zero otherwise. The COUNTRYk variable, where k ranges between one and four, takes the value one when the firm belongs to country k, and zero otherwise. YEARm is a dummy variable that takes the value one when the sample observation corresponds to year m, and zero otherwise.
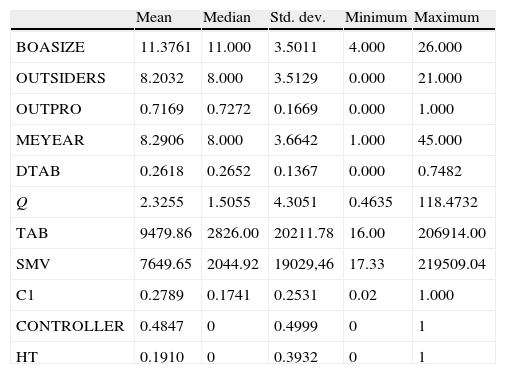
Table 4 shows the main characteristics of the sample. When we focus on the key variables, we see that one prominent feature is the mean value of firm performance in the sample, which has a Q value ratio equal to 2.32 (the median is 1.5). As regards the characteristics of the boards of directors, the mean number of board members is 11.37 (the median is 11), and the distribution between insiders and outsiders yields mean values of 3.06 (the median is 3) and 8.2 (the median is 8), respectively. The mean percentage participation of insiders on the board is thus 28.31% (the median is 27.27%), but for outsiders the figure reaches 71.69% (the median is 72.72%). The mean value for the number of annual board meetings is 8.29 with a median of 8. With respect to other variables, we note that the mean level of debt is 26.18%, and the median percentage of shares that the main shareholder reaches is 17.41%.
Statistics. This table shows the mean, median, standard deviation, minimum, and maximum values of the following variables: board size (BOASIZE), number and proportion of outside directors (OUTSIDERS and OUTPRO), number of meetings per year (MEYEAR), leverage ratio (DTAB), Tobin's Q proxy (Q), total assets in US $ millions (TAB), share market value in US $ millions (SMV), and average percentage of shares in the hands of the main shareholder (C1). We calculate all values from the 2800 firm-year observations for non-financial companies in France, the UK, Italy, and Spain from 1996 to 2005.
| Mean | Median | Std. dev. | Minimum | Maximum | |
| BOASIZE | 11.3761 | 11.000 | 3.5011 | 4.000 | 26.000 |
| OUTSIDERS | 8.2032 | 8.000 | 3.5129 | 0.000 | 21.000 |
| OUTPRO | 0.7169 | 0.7272 | 0.1669 | 0.000 | 1.000 |
| MEYEAR | 8.2906 | 8.000 | 3.6642 | 1.000 | 45.000 |
| DTAB | 0.2618 | 0.2652 | 0.1367 | 0.000 | 0.7482 |
| Q | 2.3255 | 1.5055 | 4.3051 | 0.4635 | 118.4732 |
| TAB | 9479.86 | 2826.00 | 20211.78 | 16.00 | 206914.00 |
| SMV | 7649.65 | 2044.92 | 19029,46 | 17.33 | 219509.04 |
| C1 | 0.2789 | 0.1741 | 0.2531 | 0.02 | 1.000 |
| CONTROLLER | 0.4847 | 0 | 0.4999 | 0 | 1 |
| HT | 0.1910 | 0 | 0.3932 | 0 | 1 |
To test our hypotheses we have constructed a basic econometric model for estimation. Our main objective is to assess performance by examining specific features of board behavior, such as the total number of members, proportion of outsiders, and annual frequency of meetings. As control variables we include debt, size, and dummy variables that represent the sector, country, and year of observation. All of these factors combine to produce Eq. (2):
In all the equations, the subscript i refers to the firm and t to the time period. ηi represents the nonobservable fixed effects, constant over time and linked to each firm in the sample. ¿i,t, is the random disturbance and fulfills all the usual conditions of the classical linear regression model. To avoid multicollinearity problems, we introduce the dummy variables representing sector, country, and year alternatively in the estimation of the model.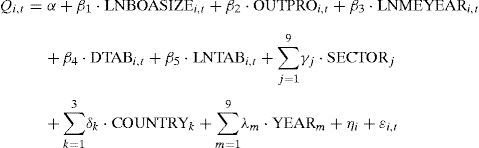
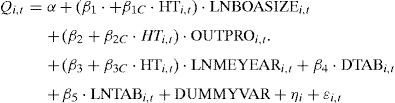
In the next estimation we include the variable that allows us to identify cases in which the advisory role of the board is more important than the monitoring function. Such variable is the dummy variable HT that takes the value of 1 when the firm belongs to a high-tech industry and 0 otherwise. To verify possible changes in the size of the coefficient for the explanatory variables related to the board in firms belonging to high-tech sectors, we include the variable HT interactively. The new regression model we estimate is Eq. (3):
Operating:The residual term is divided into two terms in each of the equations. The first, ¿i,t, covers all the other factors that impact business performance in any way, and which are not identified in the econometric model. This term constitutes the random disturbance and fulfils the usual conditions of the classical linear regression model. Nevertheless, the fixed effects linked to each firm (ηi), and possibly correlated with the set of explanatory variables, and which might cause significant biases in the estimation, tend to be found within the error term. It is possible not only to identify this constant unobservable heterogeneity but also to eliminate it. We do so by using the estimation of a first differences model, as it enables such effects to be removed and yields non-biased and efficient estimators of the effect of the independent variables on business performance.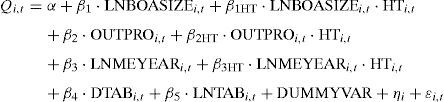
Despite all these measures, if the hypothesis of strict exogeneity of explanatory variables is not fulfilled, it may lead to a serious problem in the proposed models. In our case, since we are dealing with variables that represent the board of directors, there is certain theoretical and empirical evidence to suggest possible endogeneity (Hermalin and Weisbach, 2003). Failing to take this concern into account in the estimation might lead to major shortcomings and to obtaining inconsistent estimators.3 The generalized method of moments (GMM) estimator developed by Arellano and Bond (1991) addresses this problem allowing endogenous variables in first differences to be instrumented with suitable lags of their own levels.4 By using the GMM method we can build instruments for those variables (board size, composition, number of meetings and debt) that are potentially endogenous. In this case, we use the two-step system estimator with adjusted standard errors for potential heteroskedasticity proposed by Arellano and Bond (1998). In addition to correcting problems of simultaneity and measuring problems, the two-step estimator provides a structure of residuals that are robust to autocorrelation and heteroskedasticity problems and increase the efficiency of the original first-differences estimator.
To test model specification validity, we calculate the Hansen test of over-identifying restrictions. This test examines the lack of correlation between the instruments and the error term. The AR (1) and AR (2) statistics measure first- and second-degree serial correlations. Given the use of first-difference transformations, we expect some degree of first-order serial correlation, although this correlation does not invalidate our results. However, the presence of second-order serial correlation does signal omitted variables. We also calculate the Wald test of joint significance for all independent variables.
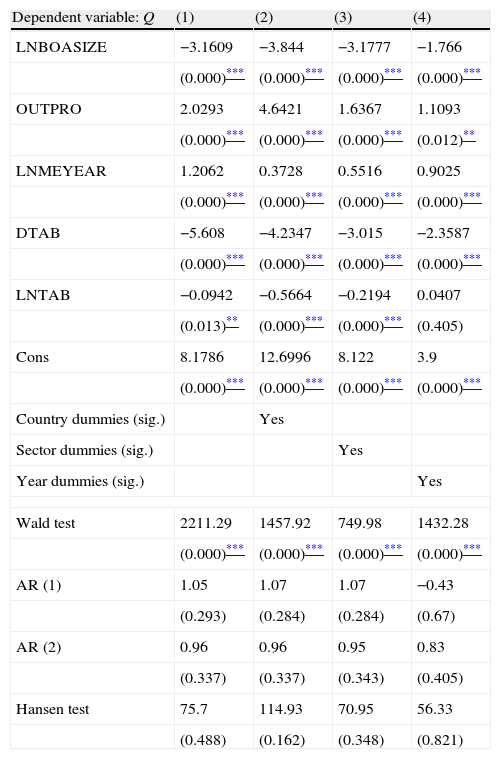
3Results3.1Results from basic and multiplicative modelsOur first analysis deals with the traditional assessment of board features (size, independence, and number of meetings) as determinants of business performance. In Table 5 we show the main results of Eq. (2) estimation, the basic model of board-performance relation. In column (1), our findings show a negative and significant impact of the logarithm of the number of board members, and a positive and significant impact for the proportion of outsiders and for the number of meetings on value. The signs prove robust when we include dummy variables that represent the country, sector, and year to which each sample observation belongs (columns (2)–(4)). These findings support the common idea that large boards are linked to poor performance, and concur with the findings in other papers such as Yermack (1996), Fernandez et al. (1997), Eisenberg et al. (1998), and Huther (1997). An enhanced capacity to monitor is balanced by problems inherent in large scale board set-ups. These problems can include such difficulties as those in communication and coordination amongst members, and free riding. By contrast, a greater presence of outsiders, and therefore a higher degree of independence, does seem to lead to improved performance. The positive sign for the number of board meetings held every year evidences a proactive function, such that more intense monitoring (or advising) is reflected in enhanced performance. Both debt and size show a negative link with performance. The four cases also show that the models we estimate are statistically significant (Wald test). Further, the GMM specification proves valid, as no second-order correlation exists (AR (2) test). Moreover, the Hansen test confirms the validity of the tools used in the estimation.
Eq. (2): GMM estimation. We report the two-step GMM system estimator (SE). The dependent variable is Tobin's Q proxy (Q). Explanatory variables are: log of board size (LNBOASIZE), proportion of outside directors (OUTPRO), log of meetings per year (LNMEYEAR), leverage ratio (DTAB), size of the firm (LNTAB), and country, sector, and time dummies. P>|z| of estimated coefficients are in parentheses. The Hansen test is distributed following a χ2 function with as many degrees of freedom as the estimated coefficients. Estimations in columns (2)–(4) include country, sector, and year dummies.
| Dependent variable: Q | (1) | (2) | (3) | (4) |
| LNBOASIZE | −3.1609 | −3.844 | −3.1777 | −1.766 |
| (0.000)*** | (0.000)*** | (0.000)*** | (0.000)*** | |
| OUTPRO | 2.0293 | 4.6421 | 1.6367 | 1.1093 |
| (0.000)*** | (0.000)*** | (0.000)*** | (0.012)** | |
| LNMEYEAR | 1.2062 | 0.3728 | 0.5516 | 0.9025 |
| (0.000)*** | (0.000)*** | (0.000)*** | (0.000)*** | |
| DTAB | −5.608 | −4.2347 | −3.015 | −2.3587 |
| (0.000)*** | (0.000)*** | (0.000)*** | (0.000)*** | |
| LNTAB | −0.0942 | −0.5664 | −0.2194 | 0.0407 |
| (0.013)** | (0.000)*** | (0.000)*** | (0.405) | |
| Cons | 8.1786 | 12.6996 | 8.122 | 3.9 |
| (0.000)*** | (0.000)*** | (0.000)*** | (0.000)*** | |
| Country dummies (sig.) | Yes | |||
| Sector dummies (sig.) | Yes | |||
| Year dummies (sig.) | Yes | |||
| Wald test | 2211.29 | 1457.92 | 749.98 | 1432.28 |
| (0.000)*** | (0.000)*** | (0.000)*** | (0.000)*** | |
| AR (1) | 1.05 | 1.07 | 1.07 | −0.43 |
| (0.293) | (0.284) | (0.284) | (0.67) | |
| AR (2) | 0.96 | 0.96 | 0.95 | 0.83 |
| (0.337) | (0.337) | (0.343) | (0.405) | |
| Hansen test | 75.7 | 114.93 | 70.95 | 56.33 |
| (0.488) | (0.162) | (0.348) | (0.821) | |
* Significant at 10% level.
Once the basic model is estimated our main goal is to ascertain whether there are any differences in the links assessed when we take into account circumstances where not only monitoring but also advising is relevant. Although the two functions can co-exist and might complement each other in boards of directors, managers may strike a trade-off between the advantages and drawbacks implicit in disclosing relevant information to board members. In such cases, shareholders could tip the balance in favor of one particular function or another, depending on certain features of the firm or the setting (Adams and Ferreira, 2007; Coles et al., 2008; Harris and Raviv, 2008). Thus, we consider the case in which the firm conducts its business activity in an area where acquiring and passing on highly specialized knowledge prove particularly valuable to the managers. Therefore, for firms in which information from managers can be especially valuable, boards would comprise a greater number of insiders and control by the latter would be beneficial (Harris and Raviv, 2008). This situation is particularly important for firms in high-technology sectors.
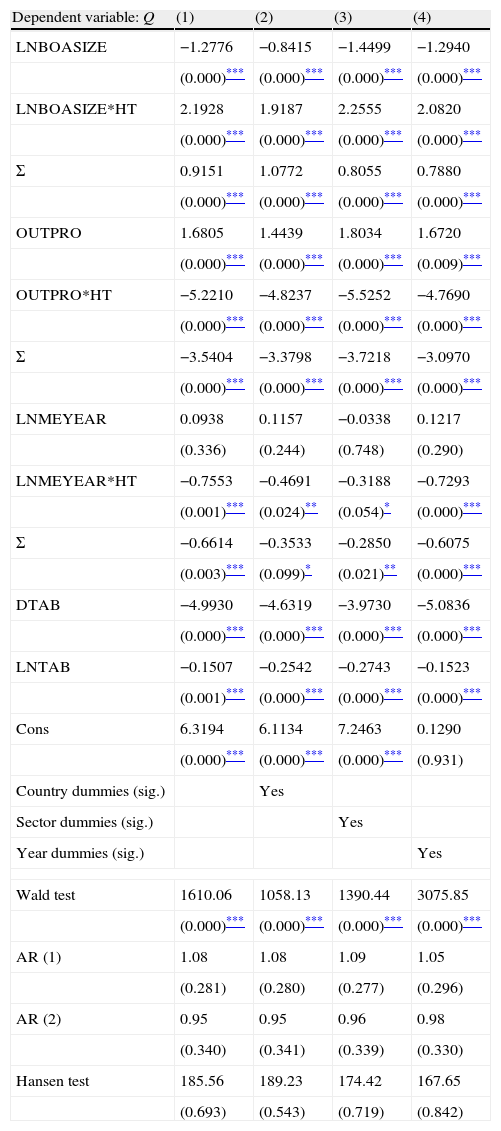
We assess this circumstance using the previously defined HT category variable in the estimations. Our interest lies not so much in ascertaining the impact of belonging to a high-tech sector on business performance, but rather in analyzing possible changes in the link between the features of the board and performance in different industries. Thus, we include the HT category variable interactively with the relevant variables in the analysis and we estimate Eq. (3). The results in Table 6 evidence significant changes and remain robust when we include the impact of country, sector, or time. In all cases the estimation of the equations prove statistically significant, and the values of the AR (2) and Hansen tests reflect the validity of the tools used in the GMM. The coefficients of the interactive variables show significant variations in the link between performance and board structure. We note the coefficient of the interactive variable (OUTPRO*HT) refers to the incremental effect of board composition on the performance of firms belonging to high-tech sectors compared to the reference group of firms in no high-tech sectors. The OUTPRO estimator provides information on no high-tech firms. Σ assesses the significance of the estimator for the group of firms in high-tech industries.
Eq. (3). GMM estimation. We report the two-step GMM system estimator (SE). The dependent variable is Tobin's Q proxy (Q). Explanatory variables are: log of board size (LNBOASIZE), proportion of outside directors (OUTPRO), log of meetings per year (LNMEYEAR), leverage ratio (DTAB), size of the firm (LNTAB), and country, sector, and time dummies. The HT dummy is included interactively. It takes the value of one if the firm belongs to a high-tech sector, and zero otherwise. Σ assesses the joint significance of the estimator for the reference group plus the interactive impact on the estimator of the group of high-tech firms. P>|z| of estimated coefficients are in parentheses. The Hansen test is distributed following a χ2 function with as many degrees of freedom as the estimated coefficients. Estimations in columns (2)–(4) include country, sector, and year dummies.
| Dependent variable: Q | (1) | (2) | (3) | (4) |
| LNBOASIZE | −1.2776 | −0.8415 | −1.4499 | −1.2940 |
| (0.000)*** | (0.000)*** | (0.000)*** | (0.000)*** | |
| LNBOASIZE*HT | 2.1928 | 1.9187 | 2.2555 | 2.0820 |
| (0.000)*** | (0.000)*** | (0.000)*** | (0.000)*** | |
| Σ | 0.9151 | 1.0772 | 0.8055 | 0.7880 |
| (0.000)*** | (0.000)*** | (0.000)*** | (0.000)*** | |
| OUTPRO | 1.6805 | 1.4439 | 1.8034 | 1.6720 |
| (0.000)*** | (0.000)*** | (0.000)*** | (0.009)*** | |
| OUTPRO*HT | −5.2210 | −4.8237 | −5.5252 | −4.7690 |
| (0.000)*** | (0.000)*** | (0.000)*** | (0.000)*** | |
| Σ | −3.5404 | −3.3798 | −3.7218 | −3.0970 |
| (0.000)*** | (0.000)*** | (0.000)*** | (0.000)*** | |
| LNMEYEAR | 0.0938 | 0.1157 | −0.0338 | 0.1217 |
| (0.336) | (0.244) | (0.748) | (0.290) | |
| LNMEYEAR*HT | −0.7553 | −0.4691 | −0.3188 | −0.7293 |
| (0.001)*** | (0.024)** | (0.054)* | (0.000)*** | |
| Σ | −0.6614 | −0.3533 | −0.2850 | −0.6075 |
| (0.003)*** | (0.099)* | (0.021)** | (0.000)*** | |
| DTAB | −4.9930 | −4.6319 | −3.9730 | −5.0836 |
| (0.000)*** | (0.000)*** | (0.000)*** | (0.000)*** | |
| LNTAB | −0.1507 | −0.2542 | −0.2743 | −0.1523 |
| (0.001)*** | (0.000)*** | (0.000)*** | (0.000)*** | |
| Cons | 6.3194 | 6.1134 | 7.2463 | 0.1290 |
| (0.000)*** | (0.000)*** | (0.000)*** | (0.931) | |
| Country dummies (sig.) | Yes | |||
| Sector dummies (sig.) | Yes | |||
| Year dummies (sig.) | Yes | |||
| Wald test | 1610.06 | 1058.13 | 1390.44 | 3075.85 |
| (0.000)*** | (0.000)*** | (0.000)*** | (0.000)*** | |
| AR (1) | 1.08 | 1.08 | 1.09 | 1.05 |
| (0.281) | (0.280) | (0.277) | (0.296) | |
| AR (2) | 0.95 | 0.95 | 0.96 | 0.98 |
| (0.340) | (0.341) | (0.339) | (0.330) | |
| Hansen test | 185.56 | 189.23 | 174.42 | 167.65 |
| (0.693) | (0.543) | (0.719) | (0.842) | |
The results show that board size has a positive, significant impact on business performance for HT firms, whereas board independence, expressed through the proportion of outsiders (OUTPRO), proves a negative factor for firms in high-tech industries and positive or non-significant for all other firms. Coles et al. (2008) obtain similar evidence, distinguishing between firms involved in intense R+D or not, supporting the proposal of Klein (1998) and Raheja (2005). Our findings confirm the differing impact of the variables most representative of the board on one group of firms or another, highlighting the different roles boards of directors may play. The presence of board members who have some link with the firm is well received, and advising management is welcomed in complex environments requiring a high degree of specific knowledge (Coles et al., 2008). The positive effect of insiders on performance supports the hypothesis that including managers on the board is valuable, as they can provide the information required and they can share it with the outsiders’ information in order to conduct enhanced governance.
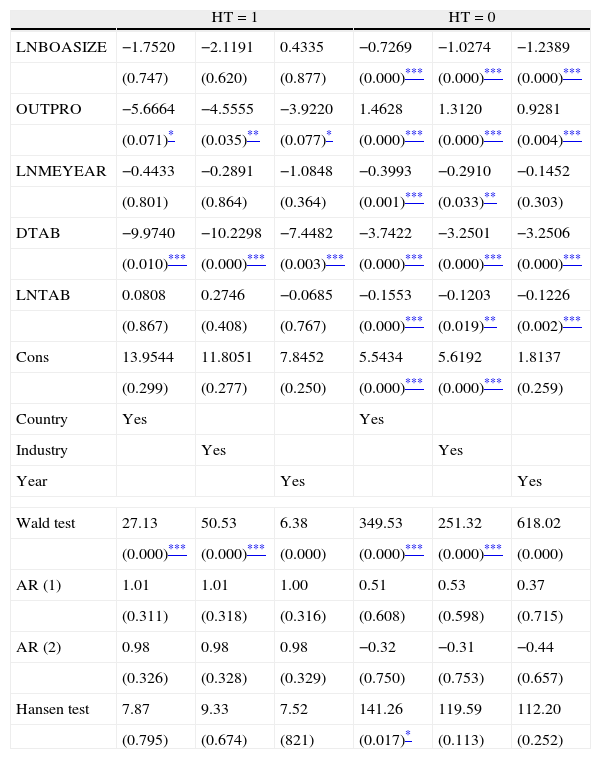
3.2Robustness analysisWe examine the robustness of our findings running alternative estimations of our empirical model. We divide the sample in terms of the HT variable and re-estimate the model for each sub-sample (Table 7). The findings support the main hypothesis regarding the involvement of outsiders and insiders in HT and not HT firms. When a firm runs its business in a sector where acquiring and passing on highly specialized information are important, the presence of insiders on the board is especially valuable (Harris and Raviv, 2008). This kind of directors and their knowledge are well valued in firms facing complex environments with high needs for knowledge (Coles et al., 2008). This result supports the conclusion that the presence of insiders can be valuable because they enjoy easier access to the information concerning the features of the business, and such information can be sharing with the board members in order to advise management more efficiently. It seems more likely that the board will be able to advise more effectively if the CEO proves more willing to share information.
Eq. (2). GMM estimation by sub-samples depending on HT. We report the two-step GMM system estimator (SE). The dependent variable is Tobin's Q proxy (Q). Explanatory variables are: log of board size (LNBOASIZE), proportion of outside directors (OUTPRO), log of meetings per year (LNMEYEAR), leverage ratio (DTAB), size of the firm (LNTAB), and country, sector, and time dummies. Estimation of column (1) corresponds to the subsample of firms for which HT equals one (knowledge intensive). Column (2) corresponds to the subsample of firms for which HT equals zero. P>|z| of estimated coefficients are in parentheses. The Hansen test is distributed following a χ2 function with as many degrees of freedom as the estimated coefficients.
| HT=1 | HT=0 | |||||
| LNBOASIZE | −1.7520 | −2.1191 | 0.4335 | −0.7269 | −1.0274 | −1.2389 |
| (0.747) | (0.620) | (0.877) | (0.000)*** | (0.000)*** | (0.000)*** | |
| OUTPRO | −5.6664 | −4.5555 | −3.9220 | 1.4628 | 1.3120 | 0.9281 |
| (0.071)* | (0.035)** | (0.077)* | (0.000)*** | (0.000)*** | (0.004)*** | |
| LNMEYEAR | −0.4433 | −0.2891 | −1.0848 | −0.3993 | −0.2910 | −0.1452 |
| (0.801) | (0.864) | (0.364) | (0.001)*** | (0.033)** | (0.303) | |
| DTAB | −9.9740 | −10.2298 | −7.4482 | −3.7422 | −3.2501 | −3.2506 |
| (0.010)*** | (0.000)*** | (0.003)*** | (0.000)*** | (0.000)*** | (0.000)*** | |
| LNTAB | 0.0808 | 0.2746 | −0.0685 | −0.1553 | −0.1203 | −0.1226 |
| (0.867) | (0.408) | (0.767) | (0.000)*** | (0.019)** | (0.002)*** | |
| Cons | 13.9544 | 11.8051 | 7.8452 | 5.5434 | 5.6192 | 1.8137 |
| (0.299) | (0.277) | (0.250) | (0.000)*** | (0.000)*** | (0.259) | |
| Country | Yes | Yes | ||||
| Industry | Yes | Yes | ||||
| Year | Yes | Yes | ||||
| Wald test | 27.13 | 50.53 | 6.38 | 349.53 | 251.32 | 618.02 |
| (0.000)*** | (0.000)*** | (0.000) | (0.000)*** | (0.000)*** | (0.000) | |
| AR (1) | 1.01 | 1.01 | 1.00 | 0.51 | 0.53 | 0.37 |
| (0.311) | (0.318) | (0.316) | (0.608) | (0.598) | (0.715) | |
| AR (2) | 0.98 | 0.98 | 0.98 | −0.32 | −0.31 | −0.44 |
| (0.326) | (0.328) | (0.329) | (0.750) | (0.753) | (0.657) | |
| Hansen test | 7.87 | 9.33 | 7.52 | 141.26 | 119.59 | 112.20 |
| (0.795) | (0.674) | (821) | (0.017)* | (0.113) | (0.252) | |
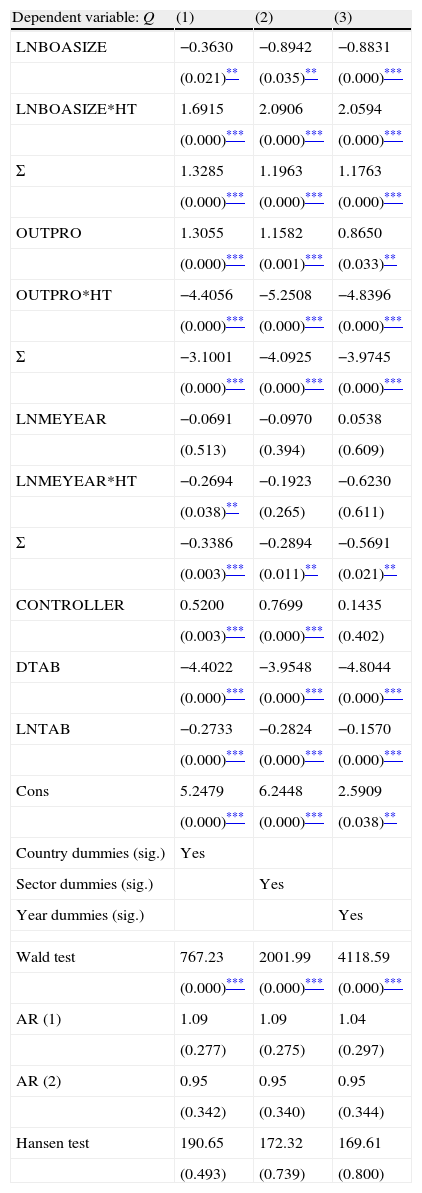
We also exanimate the sensitivity of results taking in account the corporate ownership structure of firm (Table 8). The ownership is relevant because an important block of ownership around the main shareholder or shareholders may prove decisive in solving the problem of supervising manager behavior and could lead to the board playing a predominantly advisory role. Thus, we use the dummy variable CONTROLLER that takes the value of one if over 25% of the average ownership is in the hands of the main shareholder during the period for which observations exist for a specific firm, and zero otherwise. We reestimate our model including this variable. The findings are similar to the previous one showing the different impact of board composition on performance. Thus, the percentage of outsiders shows a negative (positive) impact on value for firms belonging to high-tech (no high-tech) industries. This result reveals again that there is no unique and optimal board composition, and that outsider–insider combinations do not respond not only to monitoring reasoning but also to other motivations as advising managers. The effect of a concentrated ownership on performance is positive and significant in all estimations.
Eq. (3): GMM estimation with ownership concentration. We report the two-step GMM system estimator (SE). The dependent variable is Tobin's Q proxy (Q). Explanatory variables are: log of board size (LNBOASIZE), proportion of outside directors (OUTPRO), log of meetings per year (LNMEYEAR), ownership concentration (CONTROLLER), leverage ratio (DTAB), size of the firm (LNTAB), and country, sector, and time dummies. The HT dummy is included interactively. It takes the value of one if the firm belongs to a high-tech sector, and zero otherwise. Σ assesses the joint significance of the estimator for the reference group plus the interactive impact on the estimator of the group of high-tech firms. P>|z| of estimated coefficients are in parentheses. The Hansen test is distributed following a χ2 function with as many degrees of freedom as the estimated coefficients. Estimations in columns (1)–(3) include country, sector, and year dummies.
| Dependent variable: Q | (1) | (2) | (3) |
| LNBOASIZE | −0.3630 | −0.8942 | −0.8831 |
| (0.021)** | (0.035)** | (0.000)*** | |
| LNBOASIZE*HT | 1.6915 | 2.0906 | 2.0594 |
| (0.000)*** | (0.000)*** | (0.000)*** | |
| Σ | 1.3285 | 1.1963 | 1.1763 |
| (0.000)*** | (0.000)*** | (0.000)*** | |
| OUTPRO | 1.3055 | 1.1582 | 0.8650 |
| (0.000)*** | (0.001)*** | (0.033)** | |
| OUTPRO*HT | −4.4056 | −5.2508 | −4.8396 |
| (0.000)*** | (0.000)*** | (0.000)*** | |
| Σ | −3.1001 | −4.0925 | −3.9745 |
| (0.000)*** | (0.000)*** | (0.000)*** | |
| LNMEYEAR | −0.0691 | −0.0970 | 0.0538 |
| (0.513) | (0.394) | (0.609) | |
| LNMEYEAR*HT | −0.2694 | −0.1923 | −0.6230 |
| (0.038)** | (0.265) | (0.611) | |
| Σ | −0.3386 | −0.2894 | −0.5691 |
| (0.003)*** | (0.011)** | (0.021)** | |
| CONTROLLER | 0.5200 | 0.7699 | 0.1435 |
| (0.003)*** | (0.000)*** | (0.402) | |
| DTAB | −4.4022 | −3.9548 | −4.8044 |
| (0.000)*** | (0.000)*** | (0.000)*** | |
| LNTAB | −0.2733 | −0.2824 | −0.1570 |
| (0.000)*** | (0.000)*** | (0.000)*** | |
| Cons | 5.2479 | 6.2448 | 2.5909 |
| (0.000)*** | (0.000)*** | (0.038)** | |
| Country dummies (sig.) | Yes | ||
| Sector dummies (sig.) | Yes | ||
| Year dummies (sig.) | Yes | ||
| Wald test | 767.23 | 2001.99 | 4118.59 |
| (0.000)*** | (0.000)*** | (0.000)*** | |
| AR (1) | 1.09 | 1.09 | 1.04 |
| (0.277) | (0.275) | (0.297) | |
| AR (2) | 0.95 | 0.95 | 0.95 |
| (0.342) | (0.340) | (0.344) | |
| Hansen test | 190.65 | 172.32 | 169.61 |
| (0.493) | (0.739) | (0.800) | |
* Significant at 10% level.
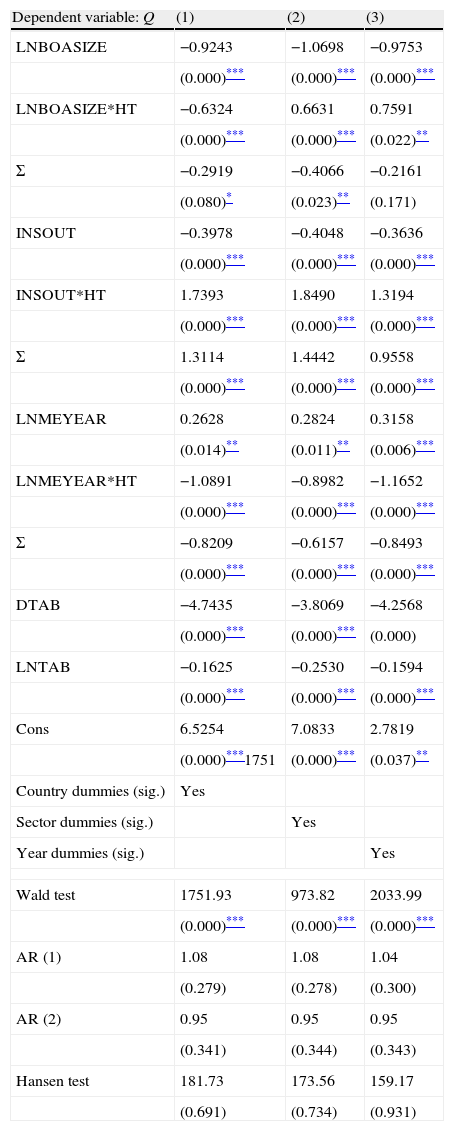
As the effect of board composition on value, justified as a trade-off between monitoring and advising, is the main result of our paper, we run new estimations changing the measure of board composition. Instead of using the proportion of outsiders (OUTPRO), we use the quotient of insiders over outsiders (INSOUT). This variable could capture the effect of board composition changes on value in a similar but different way. We use the same interactive procedure to estimate the effect of such variable on value depending on the belonging of a firm to high-tech industry (HT). The results in Table 9 are coherent with the previous ones. The positive and significant estimated coefficient of INSOUT*HT reveals that the presence of insiders is well valued in firms where the recollection and processing of information (knowledge) are key points of business. This finding challenges the idea that outsiders dominated boards provide a better performance at all, and it is coherent with recent literature supporting the trade-off between insiders and outsiders on board. In contrast, the negative and significant coefficient of INSOUT for non-tech firms could reflect the less importance of insiders on board because of the less advising needs or the bigger monitoring needs. These results are robust to the inclusion of country and year effects, and changes in the division of the sample. Whether we divide the sample in high-tech firms (HT=1) and non high-tech firms (HT=0), the results of board are robust with the previous showed. For the sake of brevity, we do not report them here.
Eq. (3): GMM estimation with INSOUT. We report the two-step GMM system estimator (SE). The dependent variable is Tobin's Q proxy (Q). Explanatory variables are: log of board size (LNBOASIZE), proportion of insiders over outsiders (INSOUT), log of meetings per year (LNMEYEAR), leverage ratio (DTAB), size of the firm (LNTAB), and country, sector, and time dummies. The HT dummy is included interactively. It takes the value of one if the firm belongs to a high-tech sector, and zero otherwise. Σ assesses the joint significance of the estimator for the reference group plus the interactive impact on the estimator of the group of high-tech firms. P>|z| of estimated coefficients are in parentheses. The Hansen test is distributed following a χ2 function with as many degrees of freedom as the estimated coefficients. Estimations in columns (1)–(3) include country, sector, and year dummies.
| Dependent variable: Q | (1) | (2) | (3) |
| LNBOASIZE | −0.9243 | −1.0698 | −0.9753 |
| (0.000)*** | (0.000)*** | (0.000)*** | |
| LNBOASIZE*HT | −0.6324 | 0.6631 | 0.7591 |
| (0.000)*** | (0.000)*** | (0.022)** | |
| Σ | −0.2919 | −0.4066 | −0.2161 |
| (0.080)* | (0.023)** | (0.171) | |
| INSOUT | −0.3978 | −0.4048 | −0.3636 |
| (0.000)*** | (0.000)*** | (0.000)*** | |
| INSOUT*HT | 1.7393 | 1.8490 | 1.3194 |
| (0.000)*** | (0.000)*** | (0.000)*** | |
| Σ | 1.3114 | 1.4442 | 0.9558 |
| (0.000)*** | (0.000)*** | (0.000)*** | |
| LNMEYEAR | 0.2628 | 0.2824 | 0.3158 |
| (0.014)** | (0.011)** | (0.006)*** | |
| LNMEYEAR*HT | −1.0891 | −0.8982 | −1.1652 |
| (0.000)*** | (0.000)*** | (0.000)*** | |
| Σ | −0.8209 | −0.6157 | −0.8493 |
| (0.000)*** | (0.000)*** | (0.000)*** | |
| DTAB | −4.7435 | −3.8069 | −4.2568 |
| (0.000)*** | (0.000)*** | (0.000) | |
| LNTAB | −0.1625 | −0.2530 | −0.1594 |
| (0.000)*** | (0.000)*** | (0.000)*** | |
| Cons | 6.5254 | 7.0833 | 2.7819 |
| (0.000)***1751 | (0.000)*** | (0.037)** | |
| Country dummies (sig.) | Yes | ||
| Sector dummies (sig.) | Yes | ||
| Year dummies (sig.) | Yes | ||
| Wald test | 1751.93 | 973.82 | 2033.99 |
| (0.000)*** | (0.000)*** | (0.000)*** | |
| AR (1) | 1.08 | 1.08 | 1.04 |
| (0.279) | (0.278) | (0.300) | |
| AR (2) | 0.95 | 0.95 | 0.95 |
| (0.341) | (0.344) | (0.343) | |
| Hansen test | 181.73 | 173.56 | 159.17 |
| (0.691) | (0.734) | (0.931) | |
We run additional estimations to control for other factors. One of them is based on the approval of codes of board in the analyzed countries. We take into account the approval of a new code of board because it could influence on the boards, on other governance mechanisms, and on performance. We define several dummy variables (CCG) that take the value of 1 from the date that the code is approved in each country, and 0 otherwise. Again, the results (no reported for the sake of brevity) show that when the advising is especially relevant because of the knowledge needs in high-tech industries, larger and less independent boards prove more valuable. Moreover, a more proactive board also has a positive impact on performance.
Despite the previously filtered outliers, we utilized an additional robust analysis using a winsorize process. Winsorize is the process of taking non-missing values of a variable and generating a new variable which is identical to the original except that the highest and lowest h values are replaced by the next values counting inwards from the extremes.5 Again, the results support the different role of boards according to a company's monitoring or advising needs. For the sake of brevity, we do not report them here.
4ConclusionsWe explore a specific context that may have a great impact on the board's dedication to the task of advising and monitoring, and on its subsequent effectiveness, the degree of involvement in high-tech sectors. We do not overlook the fact that the structure and composition of the board itself may be determined by performance as well as the nature of the board and the firm in which it is involved. We address the endogenous nature of the intervening variables by using the generalized method of moments (GMM) together with the panel method.
To achieve our goals we use a sample of 435 European firms and 2800 observations from Spain, France, Italy, and the UK. Our sample period covers between 1996 and 2005. The findings from our empirical research highlight the significant differences in the link between board structure and performance in each of the settings we examine. We find that in firms belonging to high-tech sectors, the proportion of insiders positively impact value, as compared to non high-tech firms. We show that the advisory role takes precedence over the monitoring function in settings where acquiring and conveying specific knowledge are particularly valued. Management's propensity to supply information to the board and efficient advising is strengthened in larger boards and in boards with a greater proportion of insiders.
Our research highlights the importance of suitably contextualizing any assessment of boards of directors as business governance mechanisms. It also emphasizes the need to take into account the differing functions these boards may carry out. Although it is clear that much work still remains to be done, the relevance of one function or another, depending on the contexts in hand, forces us to reconsider and reshape the empirical links traditionally evidenced in financial literature between performance and board structure. This fresh view might prove useful in improving and specifying recommendations included in Codes of Good Practices and might draw attention to the different marginal value of monitoring and advising, challenging the belief that one size (composition) fits all.
The authors benefit from the valuable comments of J. Almandoz, I. Aguiar, M. Campa, M.J. Casasola and E. Quevedo, as well as participants at the Finance Forum (Barcelona), the Financial Management Conference (Torino), and the Acede Conference (Leon). They also thank Sandra Sizer for editorial assistance. Financial support from the Education Ministry at the Regional Government of Castilla y Leon (GR144) is also acknowledged. A wider version of this research has been included as Working Paper 438/2009 in the working paper series of the Fundacion de las Cajas de Ahorros (FUNCAS). Any errors are the sole responsibility of the authors.

