


This paper evaluates the incidence of the board of directors, the nomination and remuneration committees (NRCs) and the ownership structure on the amount, composition and pay-performance sensitivity of the remuneration of executive directors. Using a panel of Spanish listed firms in the period 2005–2009, our results show that the increases in executives’ remuneration are linked to variations in shareholders’ wealth. We have also found evidence that the size of both the board and the NRC and the shareholdings of external large blockholders and executives affect the amount and structure of executive remuneration. Moreover, it is found that the existence of investment opportunities together with size and profitability all influence remuneration policy. Our results may have implications for policy makers regarding the composition of the board and NRCs as it have not be found that the presence of independent directors would restrain executives pay or increase of pay-performance sensitivity.
The recurrent outcry generated by the multi-million dollar salaries and severance packages received by company directors with demonstrably poor management records has revived the long-standing debate on the role played by remuneration schemes in the adoption of excessive risk, instability in the financial system and the loss of confidence in the markets functioning.
The interest aroused by company management remuneration policies has led to numerous studies from a variety of perspectives which have analyzed, among other aspects, the size and structure of payments and their relation with firm performance and the shareholder's wealth, the factors which influence them, and their influence on the market value of the company. The importance of this topic is further reflected in the existence of guidelines in corporate governance codes issued at international level and the legal recommendations made by national and supranational organisms in recent years advocating greater control over and transparency in the remuneration of company directors.
Apart from representing a compensation for work carried out, the remuneration received by executives is a mechanism that allows companies to attract, retain and motivate qualified professionals and which generates the appropriate incentives to ensure that executives act in the best interests of shareholders (Harris and Raviv, 1979).
The incentive aspect of remuneration has been analyzed in the economics literature where, from the perspective of agency theory, it is considered to be one of the elements shaping the structure of corporate administration. In this regard, remuneration constitutes a mechanism which provides incentives and discipline to executives, ensuring that the marginal benefits that can be obtained from opportunistic behaviour, in the sense of behaviour at odds with shareholders’ interests, are lower than the opportunity costs associated with this behaviour in terms of lower payments from the company (Shleifer and Vishny, 1997).
However, the design and implementation of remuneration policies for executives is a potential source of conflict in so far as executives often have the capacity to influence their own remuneration.3 To avoid behaviour contrary to the interests of the shareholders, most corporate good governance codes propose, among other recommendations, that the board of directors is dominated by independent directors and set up a nomination and remuneration committee (hereafter, NRC) to independently evaluate the remuneration policy of company executives and oversee that it is performance-related and complies with the principles of moderation and transparency.
In theory, the creation of an independent NRC within the board of directors is an appropriate way to avoid possible conflicts of interest interfering in the optimal design of remuneration policies, and for this reason the vast majority of Spanish publicly traded companies have incorporated them into their organization charts in recent years. However, evaluating the true effectiveness of NRCs as a supervisory and control mechanism is an empirical issue and no previous studies have addressed this in the Spanish case.
The aim of the present research is to provide fresh evidence on the factors which determine the remuneration policies of business executives. To do so, we analyze the role played by the board of directors and the NRCs in determining the remuneration of executive directors in Spain. In the Spanish market, firm ownership is highly concentrated and there is a legal system based on French civil law where there is a lesser protection of investors’ interests (La Porta et al., 1997). As a consequence of these specific characteristics, not only are the possible conflicts of interest between managers and owners of relevance, but also those between large and small shareholders. Therefore, it is an important matter in the Spanish context to consider how both the possible supervisory activities of the large shareholders and the interest conflicts with the small shareholders could have an effect on the shaping of executives remuneration.
With this in mind, the first objective of this paper is to analyze whether the executives’ remuneration is being used as a mean to motivate managerial value creation actions. If that were the case, we would expect to find evidence of a positive pay-performance sensitivity in executives’ remuneration. Another goal of this study is to determine whether certain features of the board of directors and the NRCs, as well as the concentration of the ownership structure in the hands of different shareholders (external and executives) can exert a significant influence on the amount and the structure of the remuneration received by executives and its pay-performance sensitivity.
The paper proceeds as follows. In the next section we discuss the theoretical framework of our research and in Section 3 we present the hypotheses which are to be empirically tested. In Section 4 we describe the methodology and the variables used. The databases used and the sample employed are detailed in Section 5. The most relevant results are presented in Sections 6 and 7 conclude.
2Theoretical backgroundThe theoretical analyses of the factors determining the remuneration policies of executives come from two main perspectives: economic and psychosocial (Bender, 2003). The former considers that the aim of remuneration policies is to generate economic incentives, whereas the latter explains the remuneration structure in terms of motivations related to the human and social dimensions of the organizations.
This existence of different theories has at least several implications. Firstly, it suggests that a wide set of variables, not always observable, may influence remuneration policies. Secondly, it may explain why studies, which survey the economic literature on this topic (Murphy, 1999; Core et al., 2003), highlight that the empirical evidence is usually not conclusive and that the models used have low explanatory power. Finally, it implies that the institutional framework (social, legal and cultural) within which companies carry out their activity may have an influence on the effect of these variables.
From the economics perspective, agency theory (Jensen and Meckling, 1976) suggests that the objectives of the managers (agents) and the owners (principals) of companies may diverge, so that in a context of asymmetric information the remuneration system can constitute a mechanism through which the interests of these two groups can be realigned.
Regarding the optimal type of remuneration contract, and with the aim of avoiding behaviour which does not maximize the value of the company, the economics literature considers it appropriate to apply remuneration policies where a percentage of pay depends on an observable measure of performance (Hart, 1995) and on the risk accepted in terms of unobservable factors (Prendergast, 1999).4
However, for the specific case of executive directors pay, an additional problem arises in that these have the capacity to influence the setting of their compensation. Thus, the design of remuneration policies may reflect the interests of executives instead of those of the shareholders (Bebchuk and Fried, 2004). And in line with Jensen and Murphy (2004), instead of constituting a mechanism for resolving agency problems between shareholders and managers, it may become a source of agency problems when the remaining corporate governance mechanisms do not correctly fulfil their supervisory role. Among these alternative corporate governance mechanisms, the literature highlights the presence of large shareholders, the managerial stockownership and the setting up of independent board of directors and CNRs, indicating that these affect the design of remuneration policies for top management.5
Concerning ownership concentration, large shareholders may have incentives to supervise the behaviour of directors given that the increase in the value of their shares as a result of that supervision may be greater than the costs of supervision (Holderness and Sheehan, 1988). Large shareholders will thus try to avoid unnecessary costs such as excessive compensation for executives and will push for the creation of incentive systems which direct executives’ efforts towards value creation. Therefore, it would be expected a moderating effect of large shareholders on executives’ pay and also a significant impact on the use of variable remuneration formulas and on the relationship between compensation and performance.
Several features of the board of directors are highlighted in the literature which could increase its supervisory effectiveness. These include its composition, in terms of the presence of a greater number of external or non executive directors (Fama and Jensen, 1983), and its structure, through the existence of delegated committees (Klein, 1998). However, the empirical evidence obtained for the Anglo-Saxon world is inconclusive. Brickley and James (1987) find that the compensation of CEOs is negatively related to the proportion of external directors while Kren and Kerr (1997), Cyert et al. (2002) and Sapp (2008) find no statistically significant relation. Main (1991) and Core et al. (1999) found a positive relation between the remuneration of CEOs and the percentage of independent directors.
With regard to delegated committees, there is evidence in favour of creating them in that it has been found that they allow greater specialization of the board's activity and hence greater operational effectiveness (Klein, 1998). There is also greater salary restraint among executives of companies which have a remuneration committee (Conyon, 1997). It has also been found that in companies where these committees enjoy greater independence there is less of tendency to give “in the money” stock options to executives (Yermack, 1997) and the compensation of executives is more strongly performance-related (Conyon and Peck, 1998; Weir and Laing, 2000). However, the effectiveness of these committees has also been questioned, with Anderson and Bizjak (2003) finding no relation between the committees’ independence and the executives’ pay.
Apart from the aspects discussed above, for the purposes of the present study account must be taken of the specific characteristics of the Spanish institutional framework.
Thus, along with possible conflicts of interest between management and shareholders we should add conflicts between small and large shareholders as a consequence of the high concentration of share ownership in the large publicly traded companies (Crespí, 1998), which in turn permits large shareholders the ability to exert effective influence on the decision-making process (Leech and Manjón, 2002). Similarly, the Spanish case is characterized by the existence of a legal system based on French civil law which affords a low level of protection for investors’ rights (La Porta et al., 1997) and organic structures in which the board of directors simultaneously carries out supervisory and management activities. These characteristics combine to provide the board with a high degree of autonomy and strong decision-making powers in comparison with countries such as Germany, the Netherlands or Japan where there is a prevalence of dual board structures which provide a greater balance of power.
In the Spanish context, therefore, not only should the classical arguments of agency theory in terms of opportunistic behaviour on the part of managers be considered, but also the possibility of opportunistic behaviour on the part of large shareholders. These shareholders, acting either as managers or in collusion with managers, may engage in “tunneling” (Johnson et al., 2000), meaning the expropriation of wealth from minority shareholders. An example of this is the establishment of excessive compensation for corporate administrators.
To deal with agency problems which may arise in executive compensation decisions, which do not involve any direct economic cost for the decision makers, most codes of good governance recommend forming delegated committees with specific responsibility for designing and supervising remuneration policy. Moreover, in order to ensure that these policies do not cater to the interests of the management team, it is recommended that these committees be formed by external directors, the majority of which should be independent.6
In summary, it can be established that in contexts of asymmetric information the degree of effort made by managers is not directly observed by shareholders, with the result that the set of control and supervisory mechanisms within the corporate government structure will have a bearing on the formulation of contracts. The present study attempts to provide fresh evidence in this topic by analyzing in the Spanish context whether certain characteristics of the board and NRCs and the firm's ownership structure, have an influence on the application of remuneration policies in line with shareholders’ interests.
3Hypotheses of the study3.1The relation of executive's pay and firm performanceThe agency theory considers the executives’ remuneration policies of the firm as a mechanism to align the interests of the managers and those of the shareholders. The obvious mean to align such interests is to make managerial remuneration dependent on the wealth of the shareholders by using some kind of incentive pay formula. Following this argument several authors have examined the link between the executives’ remuneration and firm performance. Jensen and Murphy (1990) and Murphy (1999) among other authors have found for the US market evidence of a positive sensitivity of executives’ remuneration to shareholders’ wealth. However, their results show also that the incentives provided are of little economic importance to effectively align the managerial and shareholders’ interests.
If Spanish firms use executive's remuneration as a mean to align the diverging interests of the shareholders and the managers we will expect to find the existence of a positive pay-performance sensitivity. Therefore we pose the following hypothesis:Hypothesis 1 The variation of executives’ remuneration is positively related to the increase in shareholders’ wealth.
The economic literature suggests that corporate governance structures have an impact on the executive remuneration policies adopted by the firms. Jensen and Murphy (2004) highlight the interdependence of corporate governance and remuneration practices, considering that a weak governance structure can lead to value-destroying remuneration practices. Governance-related factors such as the composition and size of the board and the NRC or the ownership structure of the firm have been considered as determinants of the size, composition and relation to performance of executive remuneration. In the remaining of this section, we review the existing literature about the influence of corporate governance on executive remuneration practices and derive several hypotheses about this matter.
3.2Board and NRC featuresThe board of directors is an internal supervisory mechanism which has the duties of hiring, firing and setting the remuneration of the firm's executives. The board, specially through its CNR, is responsible of designing an executive compensation package that incentives managers to take actions in line with the interests of the shareholders. The board independence and its size are commonly treated in the economic literature as features that affect both its supervisory capability and ability to design managerial remuneration schemes that promote shareholders’ interests.
Fama and Jensen (1983) argue that outside directors are better at making unbiased judgments about the quality of the CEO. Accordingly, hiring, firing and compensation decisions should be delegated to outside directors. It should be expected that the proportion of non executive directors should contribute to the moderation of executive pay levels and to a better fit between executive remuneration and firm performance.
There are evidences of a positive relationship between the proportion of non executive board members and pay-for-performance sensitivity. Conyon and Peck (1998) find a better fit between executive pay and firm performance in outsider dominated boards. Guest (2010) finds that the proportion of non executive members of the board strengthens the pay-performance link specially in poorly performing firms.
Although scarce, there is also evidence of the incidence of board outsiders on the reduction of executive pay. Chhaochharia and Grinstein (2009) analyze the effects of revised NYSE and NSDAQ listing standards, which require boards to have a majority of independent directors, as well as fully independent compensation committees. They find that CEO pay decreases by 17% more in noncompliant firms than in compliant firms, which is interpreted as the causal effect of improvements in board independence.
The interests of the managers, mainly remuneration and security in their jobs, would lead the inside directors to extend their influence to the NRCs, which are responsible of taking decisions relating to those matters. The independence of the NRCs is seen as a crucial factor in order to ensure that their recommendations are in accordance with shareholders’ interests. NRCs that have a greater degree of independence with respect to company managers and majority shareholders will have greater disciplinary capacity. In turn, this greater disciplinary capacity should be reflected in the implementation of remuneration schemes characterized by greater salary moderation, a closer relation to company performance and a higher weight of variable components.
With respect to the independence of the NRCs, the literature highlights that their work should be carried out independently of the criteria of the executive directors: if not they will have very limited supervisory capacity with the consequence that their decisions may not be consistent with the interests of shareholders. Moreover, it is suggested that the way of guaranteeing such independence is to avoid having executive directors on the committees. As a consequence, the vast majority of good governance codes at international level, including the Spanish Unified Code (2006), recommend that they be made up exclusively of external directors. Empirical evidence reported by Newman and Mozes (1999) shows that the relation between CEO compensation and performance is more favourable towards the CEO among firms that have insiders on the compensation committee. Similarly, Conyon and Peck (1998) find also that the proportion of external members in the NRC is positively related to the sensitivity of pay to performance.
Additionally to the interest conflicts involving small shareholders and the managers, in the Spanish case, there are potential conflicts between large and small shareholders, where the former can carry out expropriatory practices or “tunneling” such as setting excessive remuneration. This leads to a need for NRCs to have a majority of independent directors in order to constitute a counterweight to the influence of executive directors and non-independent external board members.
A high proportion of independent board members on the NRC could bring the remunerations of board members and top management more in line with shareholders’ interests by promoting moderate compensation packages more closely linked to company performance. This leads to the following hypotheses:Hypothesis 2 A greater presence of independent board members on the board of directors and the NRC will reduce the total amount of executive remuneration and will increase both the variable component of remuneration and its link to shareholders’ wealth.
Another board feature that could affect both executive compensation size and pay-performance sensitivity is board size. Due to group dynamics large boards may suffer from coordination problems and decision-making could tend to be a slow process. Additionally, large boards present free riding problems which erodes the supervisory capacity of such groups. Accordingly, board size is expected to have a positive impact on the size of executives’ pay and to lower the link between pay and performance.
In this sense, Main (1991), Core et al. (1999) and Conyon and He (2004) find empirical evidence of a positive relationship between board size and executive pay levels and Yermack (1996) and Conyon and He (2004) find a negative impact of board size on pay-performance sensitivity.
NRCs work as delegated committees of the board of directors, being their main task to make recommendations about hiring, firing and paying top executives being these recommendations subject to final board ratification. As a decision group the NRC faces the same size problems that may affect the board. Therefore, it is an empirical issue to test the possible effect of the NRC's size on executive pay levels and sensitivity to performance.
With this in mind, the third hypothesis to be tested is:Hypothesis 3 A larger board or NRC will increase the total amount of executive remuneration and will reduce both the variable component of remuneration and its relation to shareholders’ wealth.
As stated in the previous section the ownership structure of the firm is a crucial factor that influences executive compensation as it affects the shareholders’ incentives to monitor any aspects of managerial activity, including the setting up of their compensation packages. The large shareholders have both the incentives to control managers and the power to influence decisions about their compensation. Therefore, it is expected that the presence of large shareholders will increase the intensity of the supervision over the managers and consequently will be associated with a decrease of managerial pay, and a better link between executive remuneration and firm performance.
Accordingly to the supervisory activity expected from large shareholders, Cordeiro and Veliyath (2003) find that the number of blockholders exceeding 5% stake is negatively related to CEO cash compensation. Hartzell and Starks (2003) find for the US market that the institutional investors’ stock ownership has a negative effect on CEO compensation. Sapp (2008) finds for a sample of Canadian listed firms evidence of a negative effect of the controlling shareholders both over the remuneration received by the CEO and other top five managers. As far as pay-performance sensitivity is concerned, there is also evidence from Hartzell and Starks (2003) which shows a positive relationship between blockholders’ ownership and the sensitivity of CEO pay to firm performance.
Taking into account that the board and the NRC are the control mechanisms directly involved in the design of the firm's remuneration policies it would be also of interest to analyze the effect that the shareholdings of Board and NRC's members may have on the size of executive's pay and its link with performance. It can be argued that these mechanisms will have more incentives to exert managerial control when they represent large ownership stakes. As board's and NRC's members with high ownership stakes will suffer from the divertion of resources in the form of excessive CEO's remuneration, it is expected that board's and NRC's shareholdings will limit CEO's remuneration.
According to this, Conyon and He (2004) find for a sample of US IPO firms that the presence of large shareholders at the NRCs is associated both to a negative effect on CEO's pay size and to a more intense use of equity incentives. A negative relationship of board's and NRC's shareholdings with CEO's remuneration size is also obtained by Cyert et al. (2002). Sapp (2008) finds a negative relationship between director's shareholdings and the size of top executives’ remuneration, however this relationship is not found in the case of the CEO.
In line with the supervisory role played by large shareholders, we pose the following hypothesis:Hypothesis 4 A greater presence of large shareholders will reduce the total amount of executive remuneration and will increase both the variable component of remuneration and its relation to shareholders’ wealth.
The hypotheses presented in the third section are tested using panel data methods on a sample of companies listed on the Continuous Market of the Madrid Stock Exchange over the period 2005–2009.
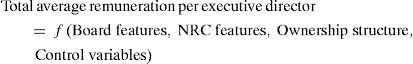
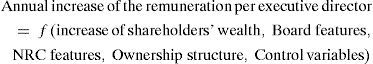
As we analyze three different aspects of executive remuneration: the average total executive remuneration, its pay-performance sensitivity, and the percentage represented by its variable components, we have built three regression models with these explained variables. The regression models which were estimated to analyze the factors determining the total remuneration of executive directors have the following structure:
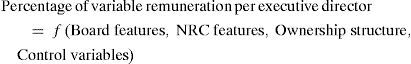
The regression models analyzing the weight of the variable component can be expressed as:
The third set of regression models follows the specification proposed by Jensen and Murphy (1990) to measure pay-performance sensitivity, controlling also for the possible effect of the firms’ corporate governance features.
In the first set of models the dependent variable is the natural logarithm of the average remuneration per executive director (REMEXEC). In the second one, the explained variable is the percentage of variable executives’ remuneration compared to the total executives’ pay (%VAREM). The dependent variable of the third model is the change in average executives’ remuneration from year t−1 to year t (ΔREMEXEC).
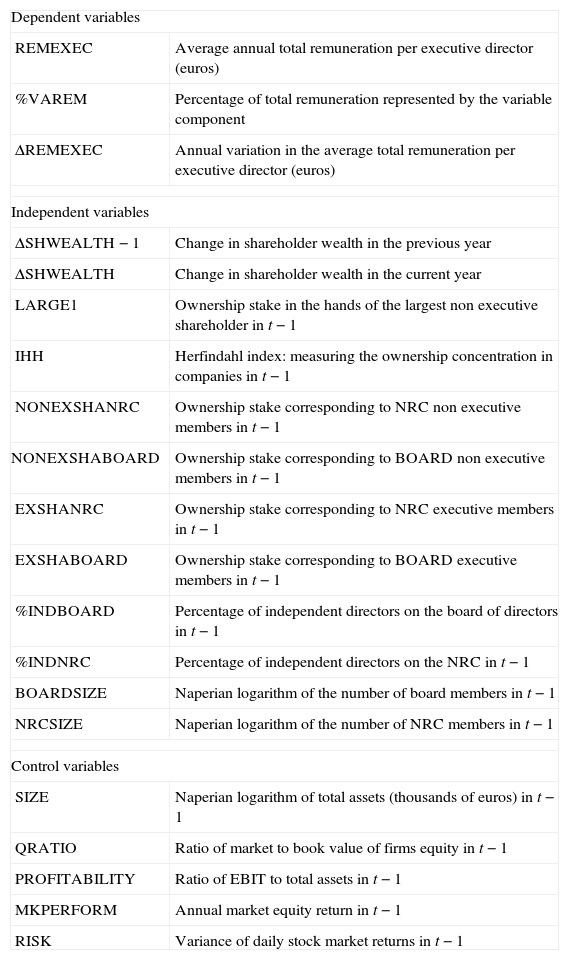
Our set of independent variables covers the three main aspects of corporate governance that may affect the executives’ remuneration, which appear in the hypotheses proposed in the previous section; these are the board of directors and the NRC's features, and the firm's ownership structure. In the third set of models, in which we test the pay-performance sensitivity, we add also the increase in shareholders’ wealth from year t−1 to t (ΔSHWEALTH−1) and along year t (ΔSHWEALTH). The increase of shareholders’ wealth in year t is calculated as the product of the firm's market capitalization at the end of year t−1 and the shareholder's market return in year t. We include a set of control variables that are commonly thought to affect executives’ remuneration. Table 1 describes the dependent variables, independent variables and control variables used in the different regression models.
Definition of variables.
| Dependent variables | |
| REMEXEC | Average annual total remuneration per executive director (euros) |
| %VAREM | Percentage of total remuneration represented by the variable component |
| ΔREMEXEC | Annual variation in the average total remuneration per executive director (euros) |
| Independent variables | |
| ΔSHWEALTH−1 | Change in shareholder wealth in the previous year |
| ΔSHWEALTH | Change in shareholder wealth in the current year |
| LARGE1 | Ownership stake in the hands of the largest non executive shareholder in t−1 |
| IHH | Herfindahl index: measuring the ownership concentration in companies in t−1 |
| NONEXSHANRC | Ownership stake corresponding to NRC non executive members in t−1 |
| NONEXSHABOARD | Ownership stake corresponding to BOARD non executive members in t−1 |
| EXSHANRC | Ownership stake corresponding to NRC executive members in t−1 |
| EXSHABOARD | Ownership stake corresponding to BOARD executive members in t−1 |
| %INDBOARD | Percentage of independent directors on the board of directors in t−1 |
| %INDNRC | Percentage of independent directors on the NRC in t−1 |
| BOARDSIZE | Naperian logarithm of the number of board members in t−1 |
| NRCSIZE | Naperian logarithm of the number of NRC members in t−1 |
| Control variables | |
| SIZE | Naperian logarithm of total assets (thousands of euros) in t−1 |
| QRATIO | Ratio of market to book value of firms equity in t−1 |
| PROFITABILITY | Ratio of EBIT to total assets in t−1 |
| MKPERFORM | Annual market equity return in t−1 |
| RISK | Variance of daily stock market returns in t−1 |
This table presents the definition of the variables used in the different models, dependent variables, the independent and control variables.
The board and NRC's characteristics considered are two, their independence and size. The independence is proxied by the percentage of independent directors, respectively in the board (%INDBOARD) and the NRC (%INDNRC). The size is measured by the log of the number of board's (BOARDSIZE) and NRC's members (NRCSIZE). The firm's ownership structure is proxied by four different variables: the ownership stake of the largest non executive shareholder (LARGE1), a Herfihdahl index that measures the dispersion of the ownership among the five largest shareholders (IHH), the ownership stakes represented by the firm's directors (NONEXSHABOARD; EXSHABOARD) and by NRC's members (NONEXSHANRC; EXESHANRC). As the incentives to exert control over the remuneration of the executives would be probably different in the case of executive directors and non executive directors, we have considered separately the effects of the shareholdings of these two groups of directors and NRC members.
We also include a series of control variables whose influence on corporate remuneration has been highlighted in several studies. These include the importance of future investment opportunities, proxied by the book to market ratio (QRATIO) which affects free cash-flows and the degree of discretion with which they can be used by directors. The size of the company, measured by the naperian logarithm of total assets (SIZE), determines the responsibilities and the profiles of the directors needed for managing the company. Other factors relevant for remuneration are company profitability (PROFITABILITY), measured by the ratio of EBIT to total assets, and total risk (RISK), measured by the variance of daily stock market returns.
All models are estimated using panel-corrected standard errors for heteroskedasticity and first-order auto correlation. To minimize possible problems of endogeneity all independent variables are lagged 1 year with respect to the dependent variables.7 The models account for the possible effects of the changes in general economic conditions by including year dummies. As executive pay Jensen and Murphy (1990) and pay-performance sensitivity Bryan et al. (2000) vary across industries, we have also included industry dummy variables to control this effect.
5Data descriptionThe final sample comprises 321 observations corresponding to 77 non-financial Spanish companies listed on the Continuous Market over the period 2005–2009. The companies analyzed are those which declared having an NRC and for which all the information necessary for constructing the variables used in the study was available.
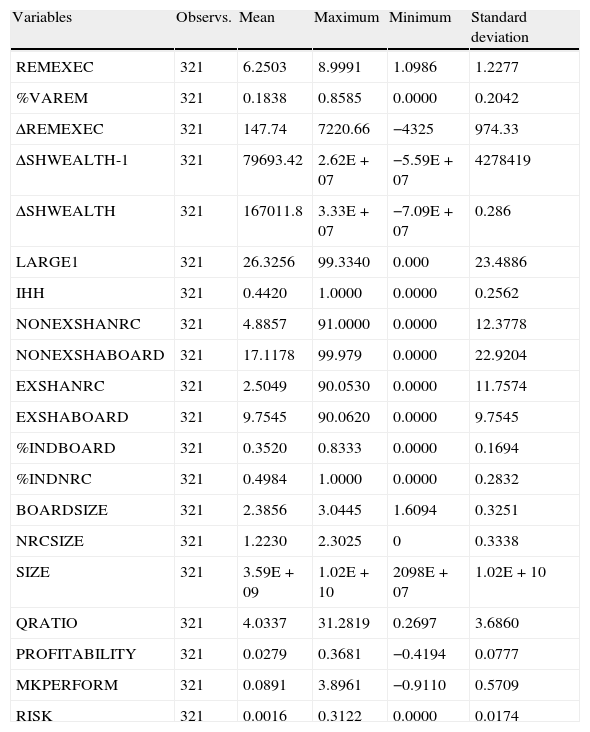
The executive compensation data, the characteristics of the NRCs and the shareholdings of the directors and large shareholders come from the official records of the National Stock Market Commission (CNMV) and the annual corporate governance reports that companies have been obliged to publish since 2003. The accounting data which is used to determine the size of the company and the returns on assets comes from the CNMV records. Finally, the share prices which are needed to estimate the level of business risk, market returns and the increase of shareholders’ wealth have been obtained from the records of the Madrid Stock Exchange. Some descriptive statistics of the variables used are presented in Table 2.
Descriptive statistics.
| Variables | Observs. | Mean | Maximum | Minimum | Standard deviation |
| REMEXEC | 321 | 6.2503 | 8.9991 | 1.0986 | 1.2277 |
| %VAREM | 321 | 0.1838 | 0.8585 | 0.0000 | 0.2042 |
| ΔREMEXEC | 321 | 147.74 | 7220.66 | −4325 | 974.33 |
| ΔSHWEALTH-1 | 321 | 79693.42 | 2.62E+07 | −5.59E+07 | 4278419 |
| ΔSHWEALTH | 321 | 167011.8 | 3.33E+07 | −7.09E+07 | 0.286 |
| LARGE1 | 321 | 26.3256 | 99.3340 | 0.000 | 23.4886 |
| IHH | 321 | 0.4420 | 1.0000 | 0.0000 | 0.2562 |
| NONEXSHANRC | 321 | 4.8857 | 91.0000 | 0.0000 | 12.3778 |
| NONEXSHABOARD | 321 | 17.1178 | 99.979 | 0.0000 | 22.9204 |
| EXSHANRC | 321 | 2.5049 | 90.0530 | 0.0000 | 11.7574 |
| EXSHABOARD | 321 | 9.7545 | 90.0620 | 0.0000 | 9.7545 |
| %INDBOARD | 321 | 0.3520 | 0.8333 | 0.0000 | 0.1694 |
| %INDNRC | 321 | 0.4984 | 1.0000 | 0.0000 | 0.2832 |
| BOARDSIZE | 321 | 2.3856 | 3.0445 | 1.6094 | 0.3251 |
| NRCSIZE | 321 | 1.2230 | 2.3025 | 0 | 0.3338 |
| SIZE | 321 | 3.59E+09 | 1.02E+10 | 2098E+07 | 1.02E+10 |
| QRATIO | 321 | 4.0337 | 31.2819 | 0.2697 | 3.6860 |
| PROFITABILITY | 321 | 0.0279 | 0.3681 | −0.4194 | 0.0777 |
| MKPERFORM | 321 | 0.0891 | 3.8961 | −0.9110 | 0.5709 |
| RISK | 321 | 0.0016 | 0.3122 | 0.0000 | 0.0174 |
The sample consists of a total of 321 observations on 77 non-financial companies listed on the Spanish Continuous Market over the period 2005–2009. We show descriptive statistics: mean, maximum, minimum and standard deviation of the variables used in the models.
The average annual total remuneration per executive director was 990,916 euro, ranging from a minimum of 15,000 euro to a maximum of 8,095,000 euro. Probably due to differences in sample and period selected, this value results slightly higher than the average 824,310 euro reported by Crespí and Pascual-Fuster (2008) for a set of firms listed in the Spanish Continuous Market in the period 2004–2006.
While linking pay to objectives is a common practice among publicly quoted companies in Spain, it can be observed that the amount is below that of the US and other European countries for which variable remuneration is more firmly established.8 Variable remuneration, as a percentage of total remuneration was 18.38% on average, with some companies declaring that they do not use variable remuneration at all, while others make strong use of it (with the variable component reaching a high of over 85% of total remuneration).
Regarding the corporate governance variables, the mean size of the board is 11.4, with independent directors accounting for 35% of the board members. These figures are similar to those reported by Crespí and Pascual-Fuster (2008) which show that the average board size was 10.91 members being 32.98% of them independent. The NRC average size and the proportion of independent members were respectively 3.5% and 49%.
Finally, in relation to ownership structure it can be seen that the largest non executive shareholders account on average for 26.32% of equity. This figure is significantly higher than those reported for Anglo-Saxon markets. For example, for the British market Ozkan (2007) reports that the average percentage of company shares owned by the four largest shareholders was 25.34% and Hartzell and Starks (2003) report for the US market that the shareholdings of the top five institutional shareholders amounted for 22.3% of the total capital. Finally, the ownership stakes in the hands of non executive board and NRC members were 17.11% and 9.75% respectively, while the shareholdings of executive members of the board and the NRC were 4.88% and 2.50%.
6ResultsWe now report the main results from the estimations of the different models used to determine the influence of board and NRC characteristics and firm's ownership structure on the amount, structure and pay-performance sensitivity of remuneration received by executive directors in Spanish publicly quoted companies. All the models are estimated using panel-corrected standard errors for heteroskedasticity and first-order auto correlation.
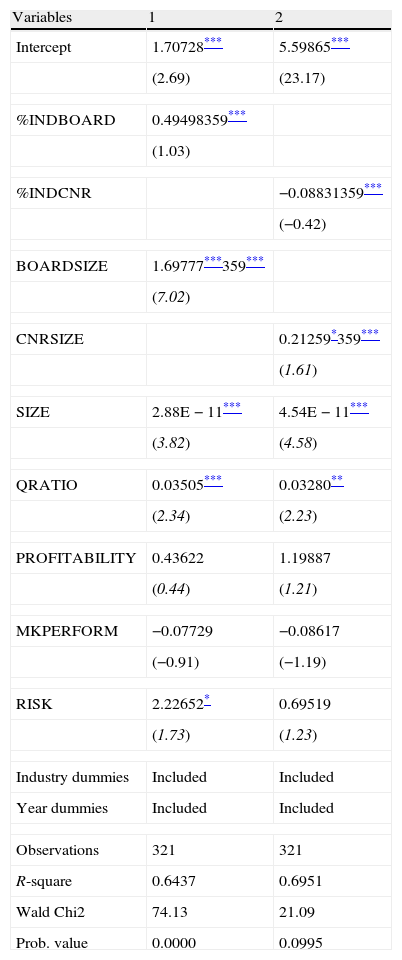
The results obtained for the set of models that analyze the determinants of the average total remuneration of executives (REMEXEC) are presented in Tables 3 and 4. Table 3 shows the effects of the board's and NRCs features on executive directors’ average total remuneration and Table 4 shows the effect of the ownership structure on the same dependent variable.
The average remuneration of executive directors and characteristics of the board and the remuneration committee.
| Variables | 1 | 2 |
| Intercept | 1.70728*** | 5.59865*** |
| (2.69) | (23.17) | |
| %INDBOARD | 0.49498359*** | |
| (1.03) | ||
| %INDCNR | −0.08831359*** | |
| (−0.42) | ||
| BOARDSIZE | 1.69777***359*** | |
| (7.02) | ||
| CNRSIZE | 0.21259*359*** | |
| (1.61) | ||
| SIZE | 2.88E−11*** | 4.54E−11*** |
| (3.82) | (4.58) | |
| QRATIO | 0.03505*** | 0.03280** |
| (2.34) | (2.23) | |
| PROFITABILITY | 0.43622 | 1.19887 |
| (0.44) | (1.21) | |
| MKPERFORM | −0.07729 | −0.08617 |
| (−0.91) | (−1.19) | |
| RISK | 2.22652* | 0.69519 |
| (1.73) | (1.23) | |
| Industry dummies | Included | Included |
| Year dummies | Included | Included |
| Observations | 321 | 321 |
| R-square | 0.6437 | 0.6951 |
| Wald Chi2 | 74.13 | 21.09 |
| Prob. value | 0.0000 | 0.0995 |
The estimations have been carried out on a sample of 321 observations on 77 non-financial companies listed on the Spanish Continuous Market over the period 2005–2009. The dependent variable is the naperian logarithm of the average total remuneration per executive director. The independent variables are those which capture the Board's and NRCs features, as well as control variables. All panel data models are estimated with corrected standard errors for heteroskedasticity and first-order autocorrelation. The STATA 10.1 software package has been used. T-statistics values in parentheses.
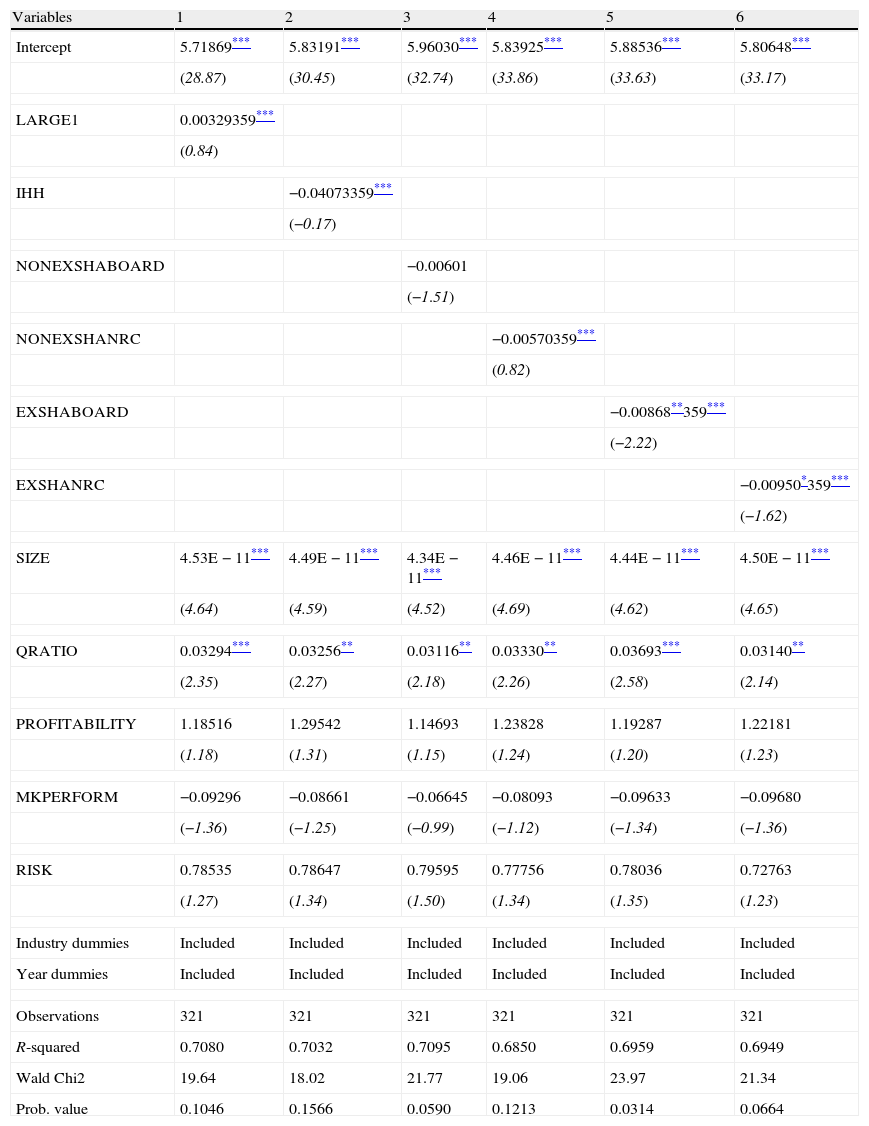
The average remuneration of executive directors and ownership structure.
| Variables | 1 | 2 | 3 | 4 | 5 | 6 |
| Intercept | 5.71869*** | 5.83191*** | 5.96030*** | 5.83925*** | 5.88536*** | 5.80648*** |
| (28.87) | (30.45) | (32.74) | (33.86) | (33.63) | (33.17) | |
| LARGE1 | 0.00329359*** | |||||
| (0.84) | ||||||
| IHH | −0.04073359*** | |||||
| (−0.17) | ||||||
| NONEXSHABOARD | −0.00601 | |||||
| (−1.51) | ||||||
| NONEXSHANRC | −0.00570359*** | |||||
| (0.82) | ||||||
| EXSHABOARD | −0.00868**359*** | |||||
| (−2.22) | ||||||
| EXSHANRC | −0.00950*359*** | |||||
| (−1.62) | ||||||
| SIZE | 4.53E−11*** | 4.49E−11*** | 4.34E−11*** | 4.46E−11*** | 4.44E−11*** | 4.50E−11*** |
| (4.64) | (4.59) | (4.52) | (4.69) | (4.62) | (4.65) | |
| QRATIO | 0.03294*** | 0.03256** | 0.03116** | 0.03330** | 0.03693*** | 0.03140** |
| (2.35) | (2.27) | (2.18) | (2.26) | (2.58) | (2.14) | |
| PROFITABILITY | 1.18516 | 1.29542 | 1.14693 | 1.23828 | 1.19287 | 1.22181 |
| (1.18) | (1.31) | (1.15) | (1.24) | (1.20) | (1.23) | |
| MKPERFORM | −0.09296 | −0.08661 | −0.06645 | −0.08093 | −0.09633 | −0.09680 |
| (−1.36) | (−1.25) | (−0.99) | (−1.12) | (−1.34) | (−1.36) | |
| RISK | 0.78535 | 0.78647 | 0.79595 | 0.77756 | 0.78036 | 0.72763 |
| (1.27) | (1.34) | (1.50) | (1.34) | (1.35) | (1.23) | |
| Industry dummies | Included | Included | Included | Included | Included | Included |
| Year dummies | Included | Included | Included | Included | Included | Included |
| Observations | 321 | 321 | 321 | 321 | 321 | 321 |
| R-squared | 0.7080 | 0.7032 | 0.7095 | 0.6850 | 0.6959 | 0.6949 |
| Wald Chi2 | 19.64 | 18.02 | 21.77 | 19.06 | 23.97 | 21.34 |
| Prob. value | 0.1046 | 0.1566 | 0.0590 | 0.1213 | 0.0314 | 0.0664 |
The estimations have been carried out on a sample of 321 observations on 77 non-financial companies listed on the Spanish Continuous Market over the period 2005–2009. The dependent variable is the naperian logarithm of the average total remuneration per executive director. The independent variables are those which capture the ownership structure, as well as control variables. All panel data models are estimated with corrected standard errors for heteroskedasticity and first-order autocorrelation. The STATA 10.1 software package has been used. T-statistics values in parentheses.
It can be seen that the size of the board, the market to book ratio and the size of the company are all positively related to the remuneration received by executive board members.
We have not found a statistically significant coefficient for the proportion of independent directors in the board or the NRC. This result is contrary to Hypothesis 2 in that a greater proportion of independent directors on the board or the NRC does not appear to moderate the amount of remuneration received by executive directors.
This is not what would be expected in accordance with theory and the recommendations of the corporate codes of good governance which advocate forming independent boards and remuneration committees. However, the result is similar to those obtained by Kren and Kerr (1997), Cyert et al. (2002) and Sapp (2008) who fail to find a statistically significant effect of the proportion of non executive directors on the level of executive's remuneration. This behaviour could reflect a lack of effective independence of these directors with respect to the executives, who are normally responsible for naming them, and which has been highlighted in several studies (Jensen, 1993; Bhagat and Black, 1999).
Other relevant result is the positive and significant relationship between the size of the board and the level of executive remuneration. Larger boards tend to be worse mechanisms of control in the sense that they fail to promote the restraint of executive pay levels. Rather than benefiting from the broader experience and the existence of multiple points of view, larger boards seem to suffer from incoordination and free rider problems and tend to be dominated by executive's interests. This result is similar to those obtained by Main (1991), Ozkan (2007, 2011), Sapp (2008) for the UK and Core et al. (1999) for the US.
We also tested whether certain economic characteristics of the firm influenced executive compensation. These are the size of the company and the opportunities for growth, both of which represent a demand for prestigious executives (Core et al., 1999), and company risk. The size of the company was found to have a positive influence on executive remuneration. This result, that is one of the few for which there is conclusive evidence in the literature, is in line with several empirical studies at international level (Indjejikian and Nanda, 2002; Cordeiro and Veliyath, 2003) and for the Spanish case (Crespí and Pascual-Fuster, 2008). It indicates that the greater amount of resources available in large companies and the more complex tasks to be performed by directors in these companies are reflected in higher remuneration for executive board members.
As regards growth opportunities, our results show a positive and significant relation between the market to book ratio and the compensation of executives. This positive influence of growth opportunities on remuneration has been found in previous studies (Core et al., 1999 and Ozkan, 2007), and together with the positive effect of company size it could suggest that large companies with profitable investment opportunities demand prestigious executives that have to be offered high compensation packages.
In Table 4, we show the effects of the ownership structure on the average total remuneration received by executive directors. We have not found evidence supporting the control activity performed by large non executive shareholders. However, we have found a negative and statistically significant relationship between the shareholdings of executive board members and their remuneration. We could interpret this result as a manifestation of the incentive alignment effect provided executives’ direct shareholdings. In companies where the executive members of the board are also significant owners of the firm's equity, they align their interests with value maximization. These executives may maintain low levels of remuneration with the aim of sending a positive sign to the market that may have a positive effect on the value of their firm's shares. As in models displayed on Table 3, the market to book ratio and firm's size are positively related to the pay level of executive board members.
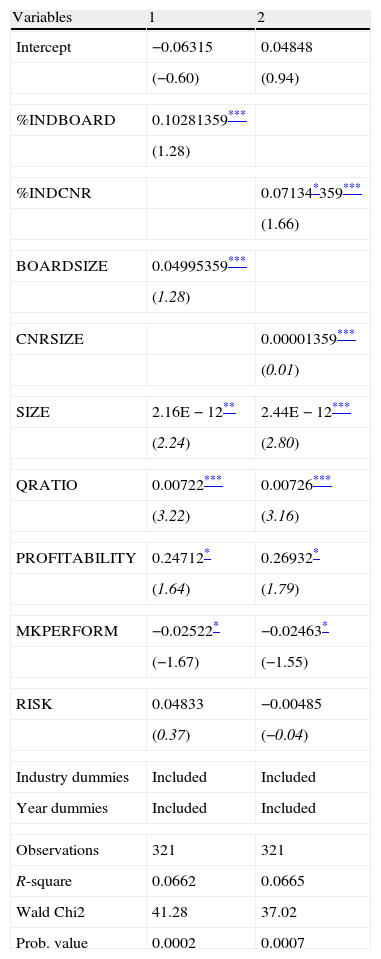
The second stage of the empirical analysis investigates the possible influence that the characteristics of the board and NRCs and also the firms’ ownership structure may have on the structure of executive's remuneration. To do so, the percentage of total executives remuneration represented by the variable component (%VAREM) is introduced as the dependent variable in the models. This variable component consists of the part of directors’ salaries that depends on the achievement of certain objectives. The independent variables are the same used in the previous models.
The models are presented in Tables 5 and 6.
The percentage of variable remuneration of executives and characteristics of the board and the remuneration committee.
| Variables | 1 | 2 |
| Intercept | −0.06315 | 0.04848 |
| (−0.60) | (0.94) | |
| %INDBOARD | 0.10281359*** | |
| (1.28) | ||
| %INDCNR | 0.07134*359*** | |
| (1.66) | ||
| BOARDSIZE | 0.04995359*** | |
| (1.28) | ||
| CNRSIZE | 0.00001359*** | |
| (0.01) | ||
| SIZE | 2.16E−12** | 2.44E−12*** |
| (2.24) | (2.80) | |
| QRATIO | 0.00722*** | 0.00726*** |
| (3.22) | (3.16) | |
| PROFITABILITY | 0.24712* | 0.26932* |
| (1.64) | (1.79) | |
| MKPERFORM | −0.02522* | −0.02463* |
| (−1.67) | (−1.55) | |
| RISK | 0.04833 | −0.00485 |
| (0.37) | (−0.04) | |
| Industry dummies | Included | Included |
| Year dummies | Included | Included |
| Observations | 321 | 321 |
| R-square | 0.0662 | 0.0665 |
| Wald Chi2 | 41.28 | 37.02 |
| Prob. value | 0.0002 | 0.0007 |
The estimations have been carried out on a sample of 321 observations on 77 non-financial companies listed on the Spanish Continuous Market over the period 2005–2009. The dependent variable is the percentage of total remuneration represented by the variable component. The independent variables are those which capture the Board's and NRCs features, as well as control variables. All panel data models are estimated with corrected standard errors for heteroskedasticity and first-order autocorrelation. The STATA 10.1 software package has been used. T-statistics values in parentheses.
The percentage of variable remuneration of executives and ownership structure.
| Variables | 1 | 2 | 3 | 4 | 5 | 6 |
| Intercept | 0.05249* | 0.01747 | 0.10086*** | 0.07709*** | 0.09162*** | 0.07937*** |
| (1.76) | (0.58) | (3.36) | (2.76) | (3.18) | (2.86) | |
| LARGE1 | 0.00087*359*** | |||||
| (1.67) | ||||||
| IHH | 0.14482***359*** | |||||
| (3.44) | ||||||
| NONEXSHABOARD | −0.00084 | |||||
| (−1.33) | ||||||
| NONEXSHANRC | 0.00039359*** | |||||
| (0.35) | ||||||
| EXSHABOARD | −0.00113**359*** | |||||
| (−2.11) | ||||||
| EXSHANRC | 0.00168*359*** | |||||
| (1.29) | ||||||
| SIZE | 3.04E−12*** | 2.80E−12*** | 2.69E−12*** | 2.93E−12*** | 2.78E−12*** | 2.92E−12*** |
| (3.41) | (3.31) | (3.13) | (3.30) | (3.07) | (3.32) | |
| QRATIO | 0.00784*** | 0.00743*** | 0.00734*** | 0.00758*** | 0.00808*** | 0.00786*** |
| (3.42) | (3.24) | (3.06) | (3.26) | (3.57) | (3.36) | |
| PROFITABILITY | 0.23761* | 0.25396* | 0.24894* | 0.27602* | 0.25519* | 0.28807** |
| (1.60) | (1.77) | (1.70) | (1.88) | (1.73) | (1.96) | |
| MKPERFORM | −0.02764* | −0.02719* | −0.02258* | −0.02680* | −0.02720* | −0.02435 |
| (−1.80) | (−1.68) | (−1.62) | (−1.74) | (−1.79) | (−1.58) | |
| RISK | −0.01957 | −0.02313 | 0.02265 | 0.01003 | 0.00944 | 0.01909 |
| (−0.20) | (−0.19) | (0.02) | (0.09) | (0.08) | (0.16) | |
| Industry dummies | Included | Included | Included | Included | Included | Included |
| Year dummies | Included | Included | Included | Included | Included | Included |
| Observations | 321 | 321 | 321 | 321 | 321 | 321 |
| R-squared | 0.0651 | 0.0864 | 0.0637 | 0.0579 | 0.0664 | 0.0638 |
| Wald Chi2 | 36.06 | 46.38 | 34.43 | 33.22 | 37.03 | 34.73 |
| Prob. value | 0.0006 | 0.0000 | 0.0010 | 0.0016 | 0.0004 | 0.0009 |
The estimations have been carried out on a sample of 321 observations on 77 non-financial companies listed on the Spanish Continuous Market over the period 2005–2009. The dependent variable is the percentage of total remuneration represented by the variable component. The independent variables are those which capture the ownership structure, as well as control variables. All panel data models are estimated with corrected standard errors for heteroskedasticity and first-order autocorrelation. The STATA 10.1 software package has been used. T-statistics values in parentheses.
The results provide evidence of the influence of the ownership structure, as well as the size of the company, its investment opportunities and profitability and faint traces of the influence of the CNR composition on the remuneration structure of executive board members.
With regard to the composition of the CNRs, the proportion of independent members of the committee has a positive influence on the percentage of variable or performance-related remuneration. In line with Hypothesis 2, when a greater proportion of independent members form part of the NRC, the implementation of remuneration policies with a greater variable component is favoured.
We have to be cautious with the interpretation of this finding as a sign of the control activity performed by independent CNR members for two reasons. First the relationship is only partially significant at the 10% level. Second, although we have found that the proportion of the variable component is greater in the presence of independent NRCs, we have failed to identify the moderating role of independent NRCs members as far as the total remuneration of executive board members is concerned. That is, independent NRC members favour a higher percentage of variable remuneration, but in the end, they do not favour any savings in executive remuneration.
We have found some evidence of the influence of the ownership structure on remuneration composition.
The results obtained show a positive influence of the ownership stake in the hands of the largest non executive shareholder and the concentration of the ownership stakes in the hands of the five largest shareholders on the proportion of executive director's variable remuneration. Once again, as in the case of CNR independent members, we have to be cautious about the interpretation of this result as we have failed to obtain evidence that supports the moderating role of large external shareholders on the total amount received by executive directors. Final evidence about the influence of ownership structure is the negative and significant relationship between the shareholdings of executive board members and the proportion of variable remuneration. This result can be explained by the risk aversion of the managers. If executive board members have already linked their wealth to that of the shareholders by investing part of their resources in the firm's stock, they would be reluctant to increase their risk exposure to the variations of firm's performance by adopting a variable remuneration scheme.
In addition, it is observed that large companies have remuneration structures in which the variable component predominates. Finally, it has been verified that more profitable companies (with higher ROI) and those that have more opportunities of investment (with higher market to book ratios) give more importance to performance-related pay formulas. This indicates that executive directors are more predisposed to accepting remuneration in variable form in companies that are currently more profitable and that have perspectives of being more profitable in the future. Contrarily to what we expected we have not found a similar relationship between the firm's market performance and the propensity to adopt variable remuneration formulae, being this relationship even negative and partially significant. We could interpret this result as a sign that the variable components of executives’ remuneration are based in the attainment of certain objectives related to accounting performance indicators rather than to market performance indicators.
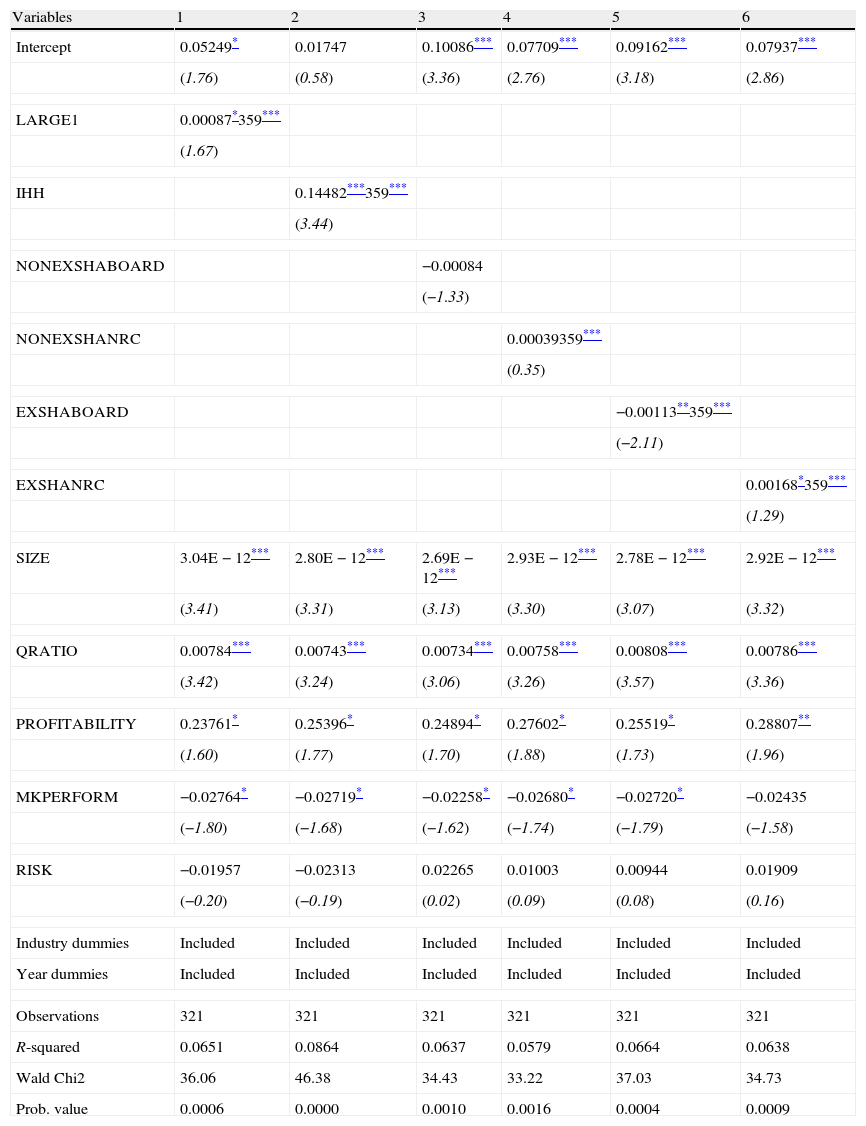
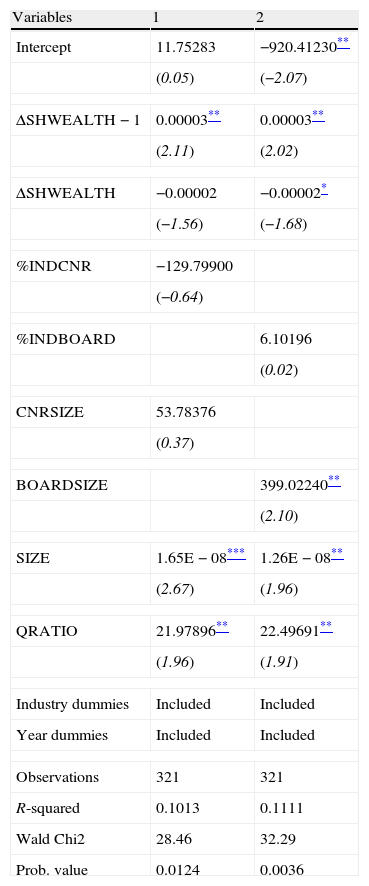
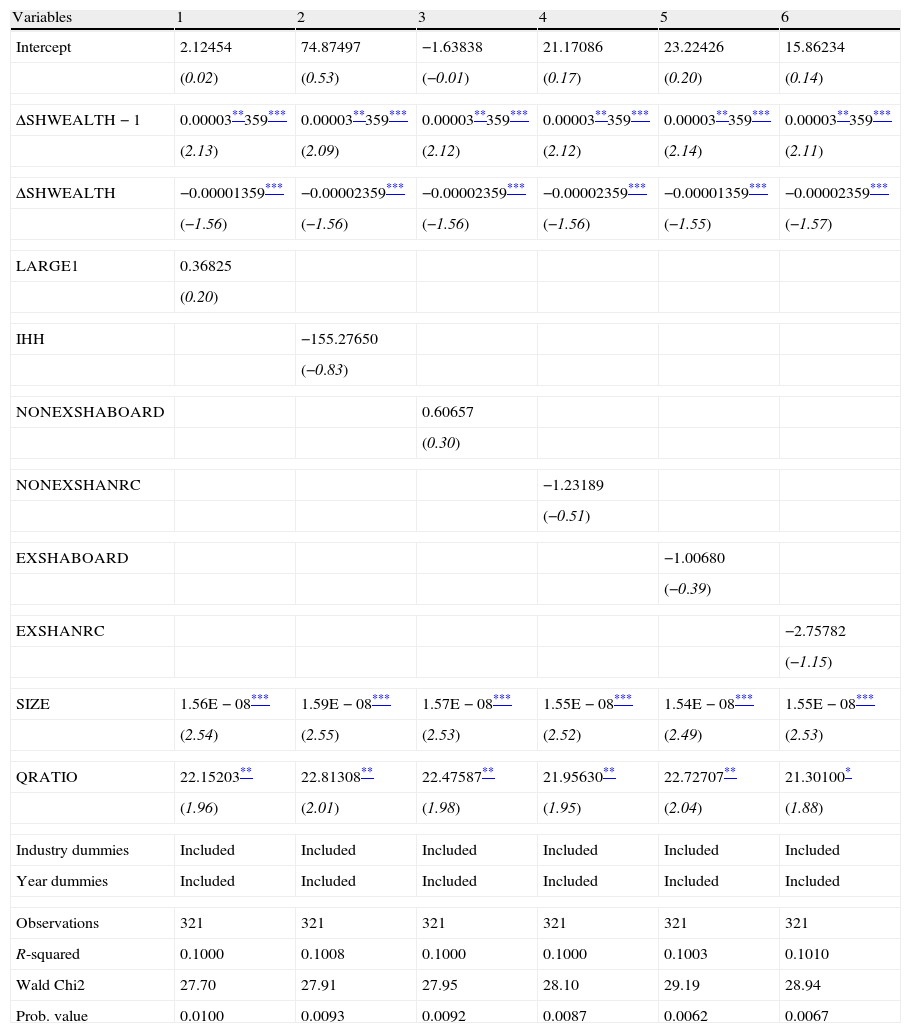
As a final part of our analysis of the determinants of executive directors remuneration, we investigate the sensitivity of executive compensation to shareholders’ wealth variations. If the remuneration practices followed by Spanish listed companies are used as a tool to align the interests of the shareholders and executives it will be expected to find a positive relationship between the annual increase in executives’ remuneration and the increase in shareholders’ wealth. The higher the coefficients obtained for our measure of shareholders’ wealth increase, the stronger the incentives provided to the executives. Additionally, we analyze weather the corporate governance features of the firm considered so far, that is the board's and NCR's features as well as the firm's ownership structure, contribute to the alignment of interests by intensifying pay-performance sensitivity. Results on pay-performance sensitivity are shown in Tables 7–10. Tables 7 and 8 show respectively the direct effect of corporate governance variables and other firm economic features on the annual increase of the average executive director's pay. Tables 9 and 10 display the interaction terms between the increase of shareholders’ wealth and corporate governance variables in order to test the effect of corporate governance on the pay-performance sensitivity.
Estimates of pay-performance sensitivity including Board's and NRCs features.
| Variables | 1 | 2 |
| Intercept | 11.75283 | −920.41230** |
| (0.05) | (−2.07) | |
| ΔSHWEALTH−1 | 0.00003** | 0.00003** |
| (2.11) | (2.02) | |
| ΔSHWEALTH | −0.00002 | −0.00002* |
| (−1.56) | (−1.68) | |
| %INDCNR | −129.79900 | |
| (−0.64) | ||
| %INDBOARD | 6.10196 | |
| (0.02) | ||
| CNRSIZE | 53.78376 | |
| (0.37) | ||
| BOARDSIZE | 399.02240** | |
| (2.10) | ||
| SIZE | 1.65E−08*** | 1.26E−08** |
| (2.67) | (1.96) | |
| QRATIO | 21.97896** | 22.49691** |
| (1.96) | (1.91) | |
| Industry dummies | Included | Included |
| Year dummies | Included | Included |
| Observations | 321 | 321 |
| R-squared | 0.1013 | 0.1111 |
| Wald Chi2 | 28.46 | 32.29 |
| Prob. value | 0.0124 | 0.0036 |
The estimations have been carried out on a sample of 321 observations on 77 non-financial companies listed on the Spanish Continuous Market over the period 2005–2009. The dependent variable is annual variation in the average total remuneration per executive director. The independent variables are those which capture the Board's and NRCs features, as well as control variables. All panel data models are estimated with corrected standard errors for heteroskedasticity and first-order autocorrelation. The STATA 10.1 software package has been used. T-statistics values in parentheses.
Estimates of pay-performance sensitivity including ownership structure.
| Variables | 1 | 2 | 3 | 4 | 5 | 6 |
| Intercept | 2.12454 | 74.87497 | −1.63838 | 21.17086 | 23.22426 | 15.86234 |
| (0.02) | (0.53) | (−0.01) | (0.17) | (0.20) | (0.14) | |
| ΔSHWEALTH−1 | 0.00003**359*** | 0.00003**359*** | 0.00003**359*** | 0.00003**359*** | 0.00003**359*** | 0.00003**359*** |
| (2.13) | (2.09) | (2.12) | (2.12) | (2.14) | (2.11) | |
| ΔSHWEALTH | −0.00001359*** | −0.00002359*** | −0.00002359*** | −0.00002359*** | −0.00001359*** | −0.00002359*** |
| (−1.56) | (−1.56) | (−1.56) | (−1.56) | (−1.55) | (−1.57) | |
| LARGE1 | 0.36825 | |||||
| (0.20) | ||||||
| IHH | −155.27650 | |||||
| (−0.83) | ||||||
| NONEXSHABOARD | 0.60657 | |||||
| (0.30) | ||||||
| NONEXSHANRC | −1.23189 | |||||
| (−0.51) | ||||||
| EXSHABOARD | −1.00680 | |||||
| (−0.39) | ||||||
| EXSHANRC | −2.75782 | |||||
| (−1.15) | ||||||
| SIZE | 1.56E−08*** | 1.59E−08*** | 1.57E−08*** | 1.55E−08*** | 1.54E−08*** | 1.55E−08*** |
| (2.54) | (2.55) | (2.53) | (2.52) | (2.49) | (2.53) | |
| QRATIO | 22.15203** | 22.81308** | 22.47587** | 21.95630** | 22.72707** | 21.30100* |
| (1.96) | (2.01) | (1.98) | (1.95) | (2.04) | (1.88) | |
| Industry dummies | Included | Included | Included | Included | Included | Included |
| Year dummies | Included | Included | Included | Included | Included | Included |
| Observations | 321 | 321 | 321 | 321 | 321 | 321 |
| R-squared | 0.1000 | 0.1008 | 0.1000 | 0.1000 | 0.1003 | 0.1010 |
| Wald Chi2 | 27.70 | 27.91 | 27.95 | 28.10 | 29.19 | 28.94 |
| Prob. value | 0.0100 | 0.0093 | 0.0092 | 0.0087 | 0.0062 | 0.0067 |
The estimations have been carried out on a sample of 321 observations on 77 non-financial companies listed on the Spanish Continuous Market over the period 2005–2009. The dependent variable is annual variation in the average total remuneration per executive director. The independent variables are those which capture the ownership structure, as well as control variables. All panel data models are estimated with corrected standard errors for heteroskedasticity and first-order autocorrelation. The STATA 10.1 software package has been used. T-statistics values in parentheses.
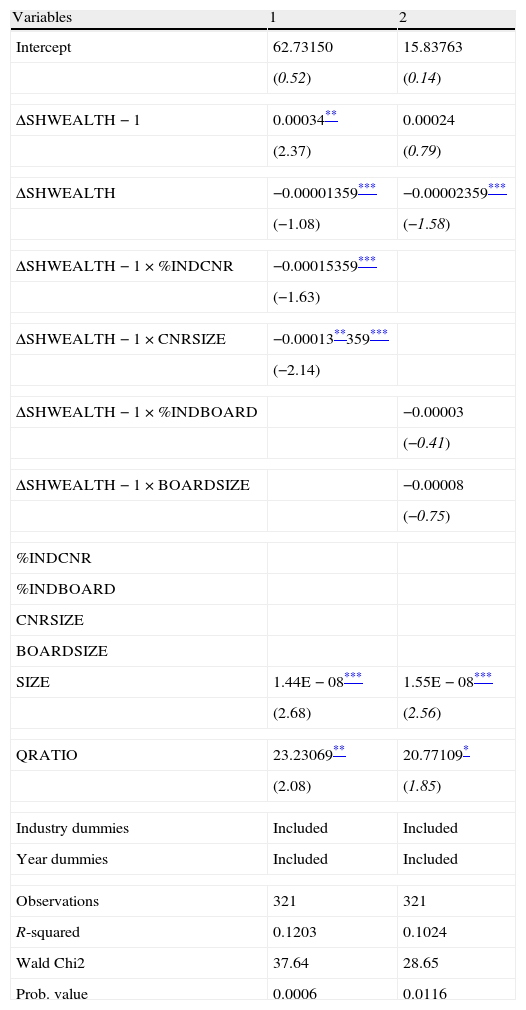
Estimates of pay-performance sensitivity including multiplicative effects of Board's and NRCs features.
| Variables | 1 | 2 |
| Intercept | 62.73150 | 15.83763 |
| (0.52) | (0.14) | |
| ΔSHWEALTH−1 | 0.00034** | 0.00024 |
| (2.37) | (0.79) | |
| ΔSHWEALTH | −0.00001359*** | −0.00002359*** |
| (−1.08) | (−1.58) | |
| ΔSHWEALTH−1×%INDCNR | −0.00015359*** | |
| (−1.63) | ||
| ΔSHWEALTH−1×CNRSIZE | −0.00013**359*** | |
| (−2.14) | ||
| ΔSHWEALTH−1×%INDBOARD | −0.00003 | |
| (−0.41) | ||
| ΔSHWEALTH−1×BOARDSIZE | −0.00008 | |
| (−0.75) | ||
| %INDCNR | ||
| %INDBOARD | ||
| CNRSIZE | ||
| BOARDSIZE | ||
| SIZE | 1.44E−08*** | 1.55E−08*** |
| (2.68) | (2.56) | |
| QRATIO | 23.23069** | 20.77109* |
| (2.08) | (1.85) | |
| Industry dummies | Included | Included |
| Year dummies | Included | Included |
| Observations | 321 | 321 |
| R-squared | 0.1203 | 0.1024 |
| Wald Chi2 | 37.64 | 28.65 |
| Prob. value | 0.0006 | 0.0116 |
The estimations have been carried out on a sample of 321 observations on 77 non-financial companies listed on the Spanish Continuous Market over the period 2005–2009. The dependent variable is annual variation in the average total remuneration per executive director. The independent variables are those which capture the Board's and NRCs features, as well as control variables. All panel data models are estimated with corrected standard errors for heteroskedasticity and first-order autocorrelation. The STATA 10.1 software package has been used. T-statistics values in parentheses.
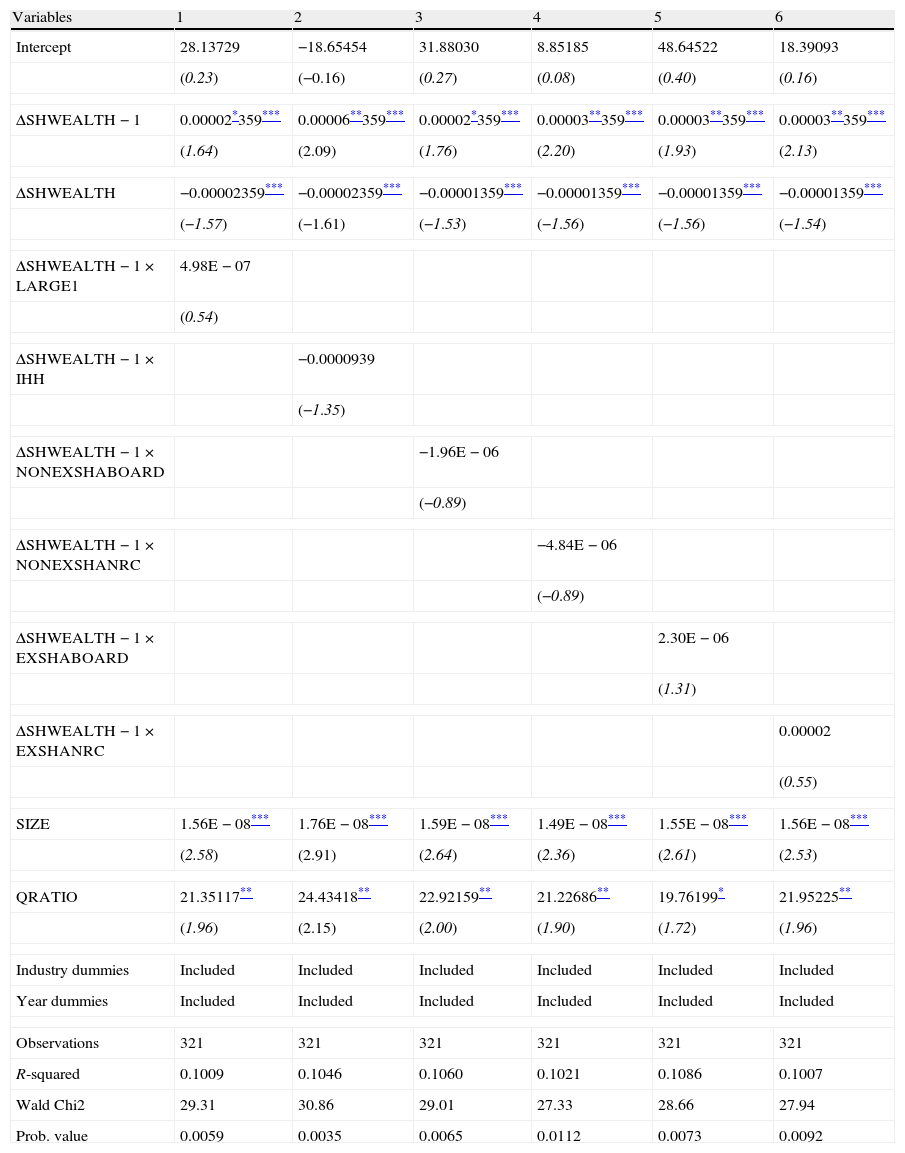
Estimates of pay-performance sensitivity including multiplicative effects of ownership structure.
| Variables | 1 | 2 | 3 | 4 | 5 | 6 |
| Intercept | 28.13729 | −18.65454 | 31.88030 | 8.85185 | 48.64522 | 18.39093 |
| (0.23) | (−0.16) | (0.27) | (0.08) | (0.40) | (0.16) | |
| ΔSHWEALTH−1 | 0.00002*359*** | 0.00006**359*** | 0.00002*359*** | 0.00003**359*** | 0.00003**359*** | 0.00003**359*** |
| (1.64) | (2.09) | (1.76) | (2.20) | (1.93) | (2.13) | |
| ΔSHWEALTH | −0.00002359*** | −0.00002359*** | −0.00001359*** | −0.00001359*** | −0.00001359*** | −0.00001359*** |
| (−1.57) | (−1.61) | (−1.53) | (−1.56) | (−1.56) | (−1.54) | |
| ΔSHWEALTH−1×LARGE1 | 4.98E−07 | |||||
| (0.54) | ||||||
| ΔSHWEALTH−1×IHH | −0.0000939 | |||||
| (−1.35) | ||||||
| ΔSHWEALTH−1×NONEXSHABOARD | −1.96E−06 | |||||
| (−0.89) | ||||||
| ΔSHWEALTH−1×NONEXSHANRC | −4.84E−06 | |||||
| (−0.89) | ||||||
| ΔSHWEALTH−1×EXSHABOARD | 2.30E−06 | |||||
| (1.31) | ||||||
| ΔSHWEALTH−1×EXSHANRC | 0.00002 | |||||
| (0.55) | ||||||
| SIZE | 1.56E−08*** | 1.76E−08*** | 1.59E−08*** | 1.49E−08*** | 1.55E−08*** | 1.56E−08*** |
| (2.58) | (2.91) | (2.64) | (2.36) | (2.61) | (2.53) | |
| QRATIO | 21.35117** | 24.43418** | 22.92159** | 21.22686** | 19.76199* | 21.95225** |
| (1.96) | (2.15) | (2.00) | (1.90) | (1.72) | (1.96) | |
| Industry dummies | Included | Included | Included | Included | Included | Included |
| Year dummies | Included | Included | Included | Included | Included | Included |
| Observations | 321 | 321 | 321 | 321 | 321 | 321 |
| R-squared | 0.1009 | 0.1046 | 0.1060 | 0.1021 | 0.1086 | 0.1007 |
| Wald Chi2 | 29.31 | 30.86 | 29.01 | 27.33 | 28.66 | 27.94 |
| Prob. value | 0.0059 | 0.0035 | 0.0065 | 0.0112 | 0.0073 | 0.0092 |
The estimations have been carried out on a sample of 321 observations on 77 non-financial companies listed on the Spanish Continuous Market over the period 2005–2009. The dependent variable is annual variation in the average total remuneration per executive director. The independent variables are those which capture the ownership structure, as well as control variables. All panel data models are estimated with corrected standard errors for heteroskedasticity and first-order autocorrelation. The STATA 10.1 software package has been used. T-statistics values in parentheses.
Although we find evidence supporting the existence of a positive and statistically significant relationship between the increase in shareholder's wealth and the variation of executives’ remuneration, we have not found evidence of any effect of corporate governance variables on the intensity of this pay-performance link. We have obtained evidence of a positive relationship between the increase in shareholders’ wealth in year t−1 and the increase of executives remuneration in year t. The size of the coefficients obtained suggest that on average, for an increase in 1000 euro in shareholders’ wealth in year t−1 the executives obtain an increase of 0.03 euro of total remuneration in year t. Although the relationship is statistically significant the incentives provided seem to be poor to effectively align managerial and shareholders’ interests.
Pay-performance sensitivity is equally low in most studies conducted for other markets and varies depending on the components of CEO's remuneration considered. The increase in CEO's cash remuneration per 1000 $ increase in shareholders’ wealth found for the US by Jensen and Murphy (1990) and Murphy (1999) were respectively 0.0135 and 0.014. In the Japanese market Kato and Kubo (2006) find that a 1000 yen increase in shareholders’ wealth yields a 0.034 yen increase in CEO's cash compensation. Merhebi et al. (2006) find for the Australian market that for a 2-year consecutive 1000 Australian dollar increase in shareholders’ wealth, CEO pay increases by approximately 20.1 cents. However, our results can not be directly comparable to these others in which sensitivity is calculated just for the CEO pay not for the group of executives with a seat on the board.
Except for a positive effect detected for the board's size, we have not found any evidence supporting the existence of a direct relationship between the features of the board or the NRC or firms’ ownership structure and the increases in executive directors’ remuneration. However, we have found evidence of higher increases in executive remuneration for larger firms with more profitable investment opportunities proxied by the market to book ratio.
In order to analyze how corporate governance features affect pay-performance sensitivity, we run additional models including interaction terms of the increase of shareholders’ wealth in year t−1 with the variables representing the structure and size of the board and NRC as well as the firm's ownership structure. Results for these models are shown in Tables 9 and 10. We have only found evidence supporting the existence of a negative effect of the CNR's size on the pay-performance association. Larger CNRs seem to be less effective at designing remuneration schemes that link executives’ pay to shareholders’ wealth. None of the other corporate governance variables seem to affect the pay-performance relationship.
To summarize, with regard to the hypotheses of this study, the evidence obtained shows that the executives’ pay is sensitive to shareholders’ wealth changes, although the incentives provided are of little economic importance. The presence of independent members in the board or the NRC does not have any particular effect on the executives’ remuneration. From a corporate governance perspective only the size of the board and the NRC seem to have an impact on the design of executive remuneration packages being large decision groups associated with higher remuneration levels which are less sensitive to firm's performance.
The firm's ownership structure seems to have an effect on the executives’ remuneration. The ownership stake in the hands of the executive board members seems to provide incentives to moderate of the size of executives pay, but has also the effect of lowering the use of variable pay schemes, probably due to managerial risk aversion. There is also some evidence that the concentration of the ownership structure in the hands of external (non executive) shareholders favours the use of variable components of compensation.
The main economic determinants of executives pay seems to be firm's size and the existence of investment opportunities. Larger firms with more profitable investment opportunities pay higher salaries with a higher variable component.
7Discussion and conclusionsThe remuneration policy for company managers, and in particular executive directors, is considered as an incentive mechanism by the agency theory. However, it is also possible that these policies may constitute a source of conflicts of interest when the remaining mechanisms which make up the corporate governance structure do not adequately carry out their supervisory role.
Given this background, in this research we have studied the possible influence of the board of directors, the NRCs and the ownership structure on the remuneration of executives in Spanish listed firms. An analysis is carried out as to whether these corporate governance variables have an effect on executive compensation policies.
This study contributes to the scarce evidence available for the Spanish market regarding the role played by the corporate governance on executive remuneration. While previous studies for the Spanish case exist which have analyzed the remuneration of top management and board members, none of these has considered the characteristics of NRCs as a factor which potentially determines remuneration policy and pay-performance sensitivity have not been analyzed.
A first relevant result obtained is the existence of a positive relationship between the increase of shareholder's wealth and the increase of executive directors average compensation. The pay-performance sensitivity reported implies an increase of 3 cents in executive directors average pay per each 1000 euro increase of shareholders’ wealth. Although the interests of the shareholders and the executive directors are apparently linked, the importance of the economic incentives provided is probably not strong enough to effectively motivate managers to pursue value creation.
The main results relating the effect of corporate governance variables on remuneration policies show, firstly, that the presence of independent directors on the NRC or the board does not have any effect on the size of executive remuneration, its structure or its pay-performance sensitivity. This result is contrary to what would be expected as a consequence of compliance with the recommendations of the in force Spanish code of best practice (Unified Code, 2006).
In the second place, we have obtained evidence of the negative effect of the board and the NRC size on the adoption of remuneration formulas that contribute to the shareholders’ interests. Large boards and NRCs are inefficient control mechanisms as they contribute respectively to an increase in executives pay size and a decrease of the pay-performance sensitivity.
The firm's ownership structure is also a determinant of the remuneration policies adopted by Spanish listed companies. The ownership concentration in the hands of large non executive shareholders favours the adoption of variable remuneration schemes and the ownership stake of executive board members has a double effect. On the one side it has a moderating effect on the size of executive's pay, which could be interpreted as a manifestation of an alignment effect derived from managerial stock ownership. On the other side it has a negative effect on the adoption of variable remuneration schemes, which can be interpreted as a result of managerial risk aversion.
Finally, in line with previous empirical evidence our results confirm that aspects such as the existence of profitable investment opportunities, company size and profitability exert a significant influence on executive remuneration policies.
Taken together, the results related to the influence of the composition of the board and the NRCs on executive remuneration confirm that independent directors are not effective at representing the minority shareholders’ interest as far as executive remuneration practices is concerned. This result provides further cause for debate on the lack of real independence of these directors.
While recognizing that Spain has significantly advanced in terms of good corporate governance in recent years, which in part is reflected by a greater presence of independent directors in the various company organs, there is still work to be done. Measures need to be formulated which guarantee the independence of these directors, overhauling the present procedures used to select them and limiting the influence of executives in organs responsible for the nomination of directors and top management.
Regarding the limitations of the present study, it should be highlighted that it is necessary a more complete and individualized public disclosure of the different elements of board members’ remuneration, which will allow us to study the factors that may affect the design of the remuneration packages for individual members of the board, such as the CEO. The improvement in transparency regarding the remuneration of firm's managers and directors will presumably have a positive impact on the implementation of remuneration schemes according to shareholders’ interests, and from an academic perspective it will facilitate the comparison of our results with the many studies about CEO pay conducted in different economies worldwide.
The authors are grateful for the financial support received from the Spanish Ministry of Science and Innovation through project ECO2009-11758.

