


Rapid progression of COVID-19 pneumonia may put patients at risk of requiring ventilatory support, such as non-invasive mechanical ventilation or endotracheal intubation. Implementing tools that detect COVID-19 pneumonia can improve the patient’s healthcare. We aim to evaluate the efficacy and efficiency of the artificial intelligence (AI) tool GE Healthcare’s Thoracic Care Suite (featuring Lunit INSIGHT CXR, TCS) to predict the ventilatory support need based on pneumonic progression of COVID-19 on consecutive chest X-rays.
MethodsOutpatients with confirmed SARS-CoV-2 infection, with chest X-ray (CXR) findings probable or indeterminate for COVID-19 pneumonia, who required a second CXR due to unfavorableclinical course, were collected. The number of affected lung fields for the two CXRs was assessed using the AI tool.
ResultsOne hundred fourteen patients (57.4±14.2 years, 65−57%-men) were retrospectively collected. Fifteen (13.2%) required ventilatory support. Progression of pneumonic extension ≥0.5 lung fields per day compared to pneumonia onset, detected using the TCS tool, increased the risk of requiring ventilatory support by 4-fold. Analyzing the AI output required 26s of radiological time.
ConclusionsApplying the AI tool, Thoracic Care Suite, to CXR of patients with COVID-19 pneumonia allows us to anticipate ventilatory support requirements requiring less than half a minute.
La rápida progresión de la neumonía por COVID-19 puede implicar la necesidad de recurrir a sistemas de respiración asistida, como, por ejemplo, la ventilación mecánica no invasiva o la intubación endotraqueal. La introducción de herramientas que detecten la neumonía por COVID-19 puede mejorar la atención sanitaria de los pacientes. Nuestro objetivo es evaluar la eficacia y la eficiencia de la herramienta de inteligencia artificial (IA) Thoracic Care Suite de GE Healthcare (que incorpora Lunit INSIGHT CXR) para predecir la necesidad de recurrir a la respiración asistida en función de la progresión de la neumonía en la COVID-19 en radiografías torácicas consecutivas.
MétodosSe incluyeron pacientes ambulatorios con infección por SARS-CoV-2 confirmada, con hallazgos probables o indeterminados de neumonía por COVID-19 en la radiografía torácica (RXT) y que necesitaron someterse a una segunda RXT debido a la evolución clínica desfavorable. En las dos RXT se evaluaron el número de campos pulmonares afectados mediante la herramienta de IA.
ResultadosSe incluyeron 114 pacientes (57,4±14,2 años, 65−57 %- varones) de forma retrospectiva. 15 pacientes (el 13,2 %) precisaron respiración asistida. La progresión de la diseminación neumónica ≥0,5 campos pulmonares al día en comparación con el inicio de la neumonía, detectada mediante la herramienta TCS, cuadruplicó el riesgo de precisar respiración asistida. El análisis de los resultados de IA precisó 26 segundos.
ConclusionesAplicar la herramienta de IA, Thoracic Care Suite, a la RXT de pacientes con neumonía por COVID-19 nos permite predecir la necesidad de recurrir a la respiración asistida en menos de medio minuto.
The exceptional situation generated by the SARS-CoV-2 (COVID-19) pandemic has strained the resources of healthcare systems around the world to the limit, due to the combination of a large influx of patients and the sick leave of health professionals.1,2 In cases where SARS-CoV-2 affects the lower respiratory tract and causes pneumonia, the patient may require assisted ventilation, which can range from oxygenation with nasal prongs to intensive care, including mechanical ventilation and even extracorporeal membrane oxygenation in the most extreme situations.3 Predicting these clinical needs in order to avoid overloading hospital units could improve patient care and the organisation of the departments that provide it.4
Chest x-ray (CXR) is the most widely used tool for the diagnosis and monitoring of COVID-19 pneumonia.5 The initial progression of pneumonia on CXR is also an indicator of prognosis.6 For example, a rapid increase in the Brixia score on CXR is an independent prognostic factor for the need to resort to assisted ventilation.6 However, accurately quantifying Brixia score variations is a task that must be performed by an experienced radiologist.7 Given the current lack of resources8 due to the shortage of radiologists and work overload, it is not possible to ask expert radiologists to calculate the Brixia score in addition to preparing the full radiological report. Artificial intelligence (AI) tools could help save time in any type of pandemic situation that involves possible pneumonia. Several AI models have been successfully evaluated in the laboratory setting.9 However, research on their effectiveness in real clinical situations is scarce, probably due to the inherent difficulties of integrating these systems into daily practice and evaluating their results. Problems in overcoming these obstacles will delay or prevent health services from benefiting from these tools in clinical practice, which would undoubtedly be a missed opportunity, considering that these resources could help us both in the current pandemic and in possible future ones.
Furthermore, radiology departments may procure AI tools marketed by different medical technology companies, but these AI tools are not designed for or specifically focused on the diagnosis of COVID-19. Even so, they could be helpful if the diagnostic results were scientifically proven. This is why this study aims to assess the performance of the commercial AI tool Thoracic Care Suite (TCS) in real-life situations, applied to CXR (AI-CXR) in the initial monitoring of COVID-19 pneumonia, in order to anticipate the need for assisted ventilation. Our hypothesis is that, as we did previously without AI,6 it could help us predict unfavorable outcomes and disease progression. As a secondary objective, when assessing the efficiency of the workflow with TCS, we will quantify the time needed by the radiologist to include the results within the radiology report.
Materials and methodsWe performed a retrospective observational study in a single centre, approved by the Ethics Committee of our centre (internal EST code: 38/20), in accordance with the STROBE statement. The patient's informed consent was not considered necessary.
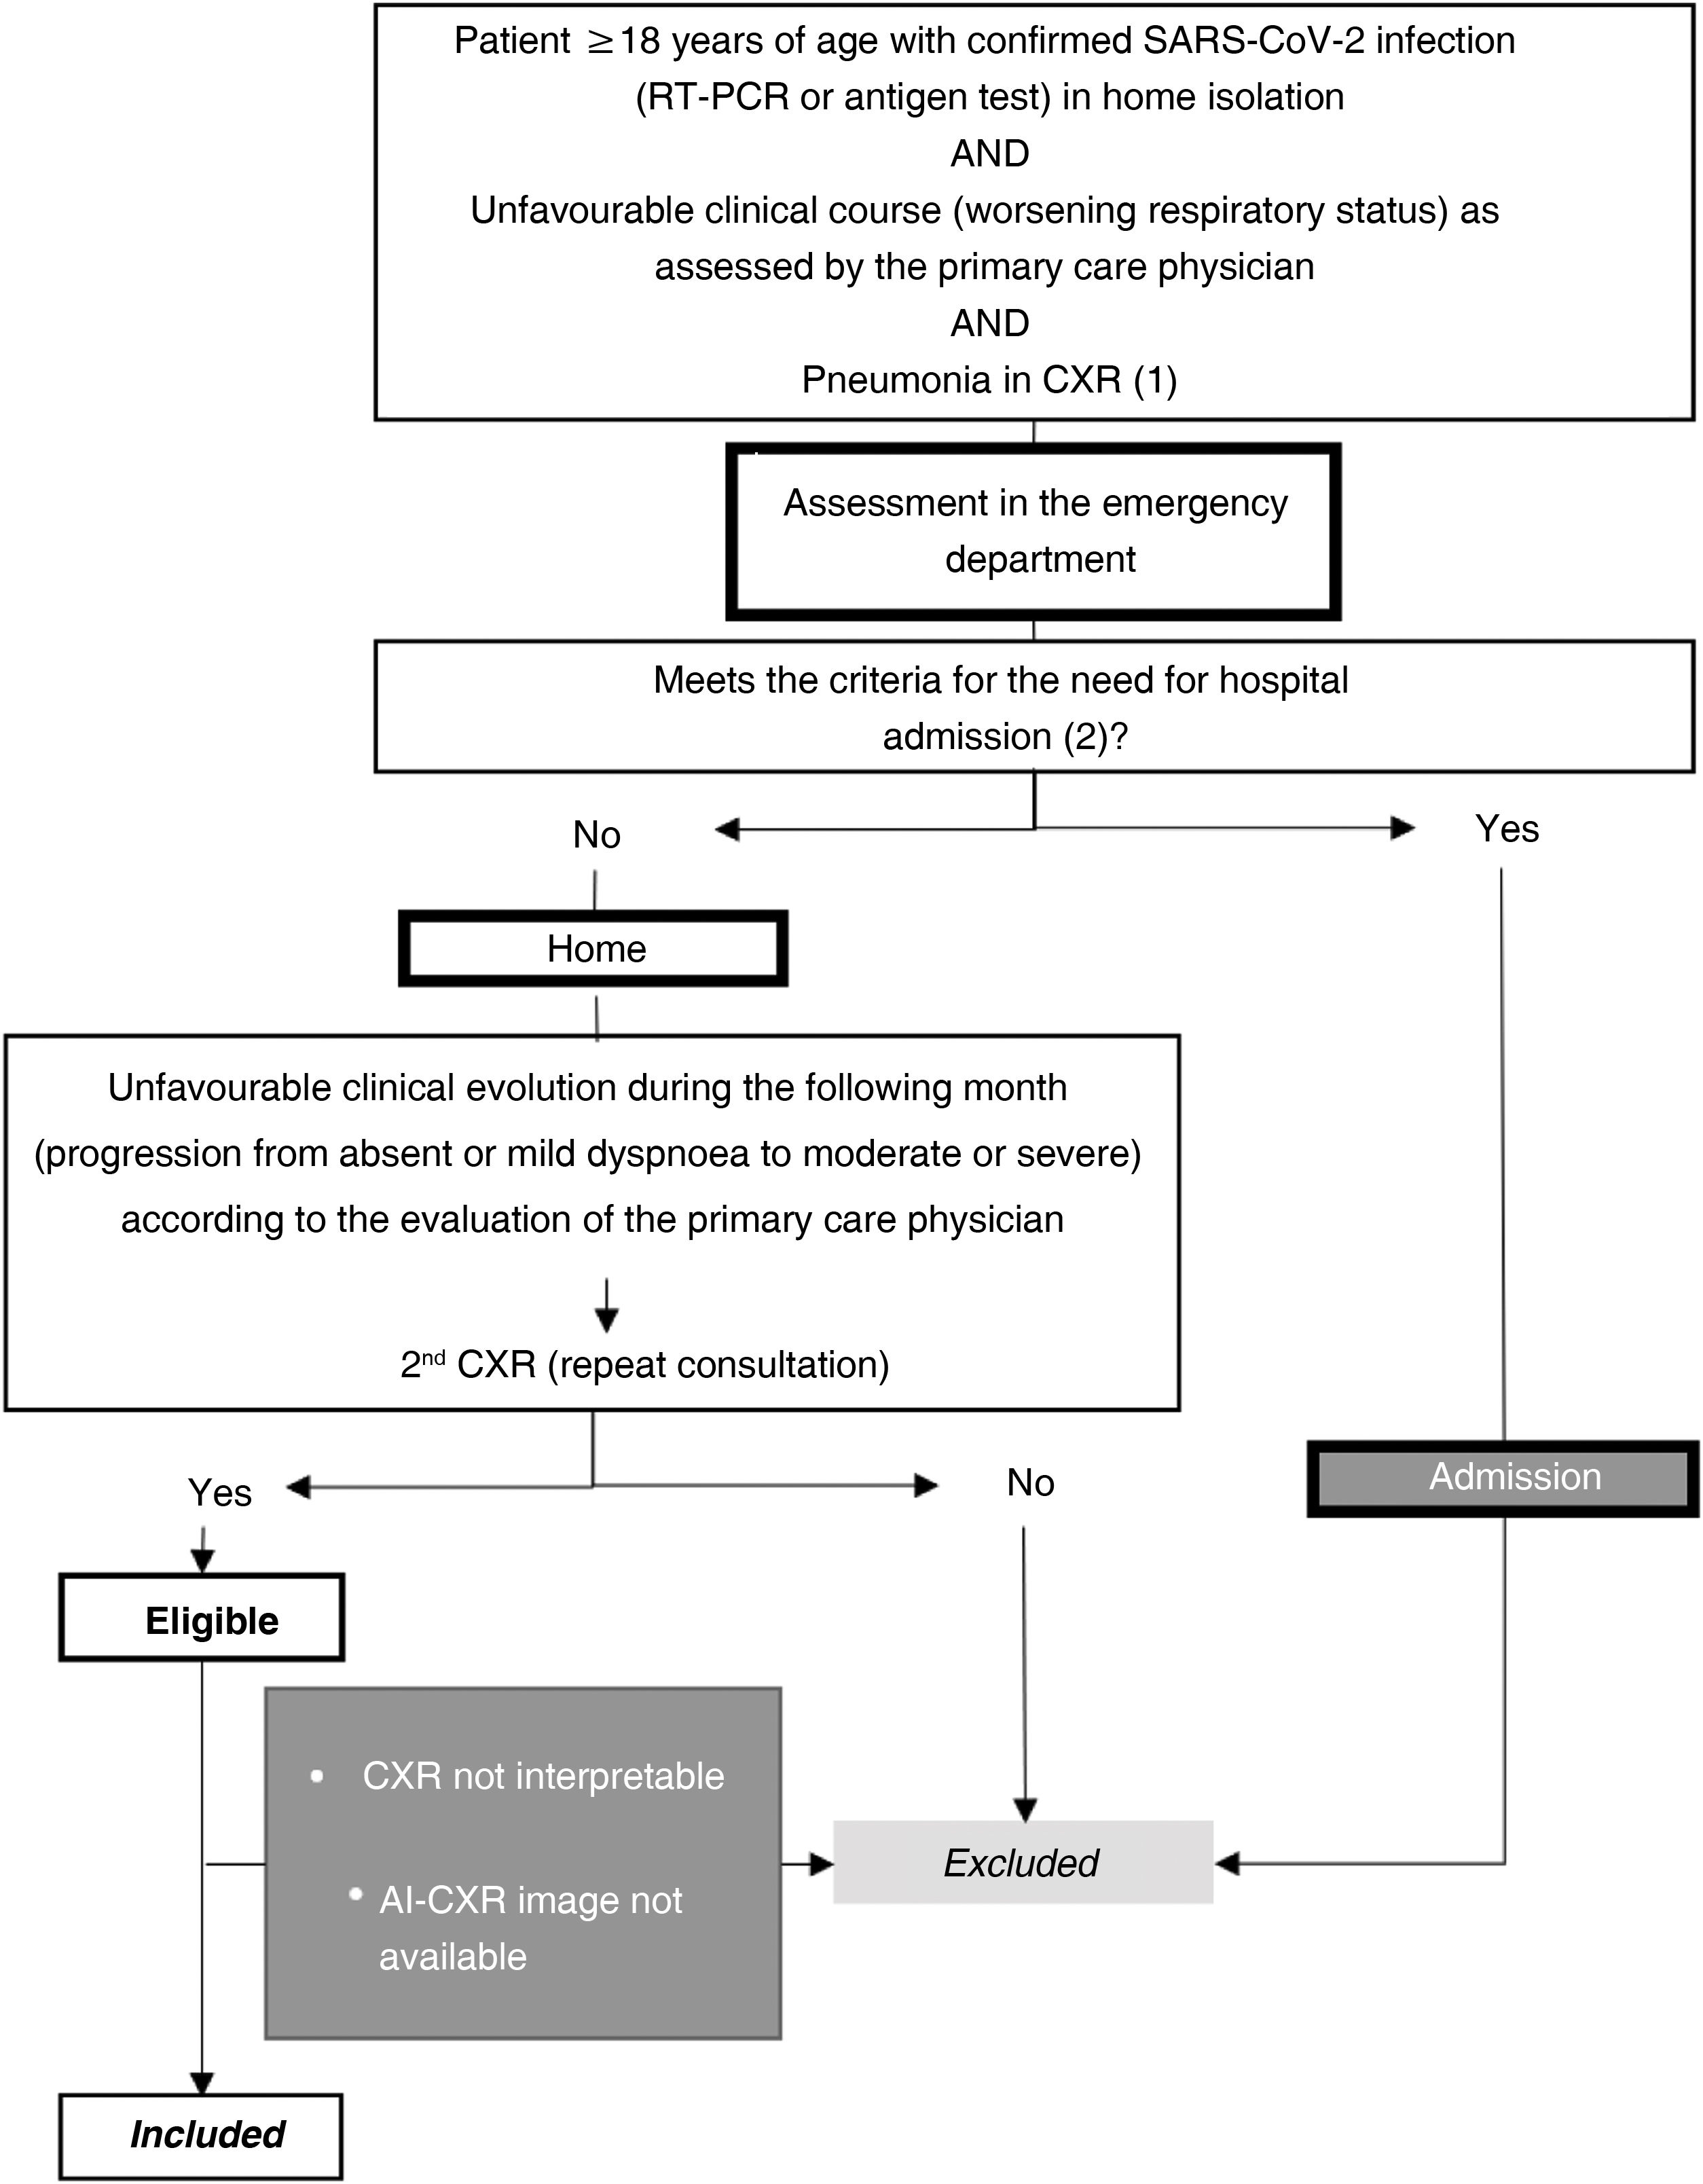
Setting and sample selectionThe selection criteria were: a) patients ≥18 years old; b) positive reverse transcription polymerase chain reaction (RT-PCR) or antigen test for SARS-CoV-2 infection; c) unfavorable respiratory evaluation and initial CXR (CXR1) with pulmonary opacities, probable or indeterminate findings of COVID-19 pneumonia10; d) without criteria making hospital admission necessary at the time of CXR1 (no dyspnoea, respiratory rate <22, oxygen saturation ≥95%, Brixia score <14 and without risk of progression taking into account concomitant diseases); e) and who require a second consultation and a new CXR (CXR2) due to an unfavorable clinical evolution at home during the month after the first CXR (Fig. 1).
 Pneumonia on chest X-ray: pulmonary opacities, probable or indeterminate findings of COVID-19 pneumonia. (2) Hospitalisation criteria: Main criteria: -Dyspnoea. -Respiratory rate ≥22. -Basal O2 saturation < 94%. Additional criteria to take into account: -Brixia score on chest X-ray: -0–4: low-risk patient. -5–13: the need for admission must be correlated with the clinical and historical history. -14–18: high-risk patient. -Patients at high risk according to concomitant diseases. AI-CXR: CXR processed with the AI tool; CXR: chest x-ray; RT-PCR: real-time reverse transcription polymerase chain reaction.")
Sample selection with inclusion and exclusion criteria.
(1) Pneumonia on chest X-ray: pulmonary opacities, probable or indeterminate findings of COVID-19 pneumonia.
(2) Hospitalisation criteria:
Main criteria:
-Dyspnoea.
-Respiratory rate ≥22.
-Basal O2 saturation < 94%.
Additional criteria to take into account:
-Brixia score on chest X-ray:
-0–4: low-risk patient.
-5–13: the need for admission must be correlated with the clinical and historical history.
-14–18: high-risk patient.
-Patients at high risk according to concomitant diseases.
AI-CXR: CXR processed with the AI tool; CXR: chest x-ray; RT-PCR: real-time reverse transcription polymerase chain reaction.
Patients were excluded if radiological images were non-diagnostic due to poor technical quality or if AI-CXR images were not available (Fig. 1).
SARS-CoV-2 infection was confirmed by the primary care physician before requesting CXR1 or by the emergency physician shortly after CXR1. Admission to the intensive care unit was determined based on the severity of respiratory failure, requiring assisted breathing (Supplementary document).
Radiological variablesWe collected data from CXR1 and CXR2 to determine radiological evolution. CXR1 was the first CXR in which pulmonary opacities were observed, probable or indeterminate findings of COVID-19 pneumonia.10 CXR2 was the first follow-up CXR after CXR1. In both examinations we evaluated the usual posteroanterior projection and, in bedridden patients, the X-ray taken in bed.
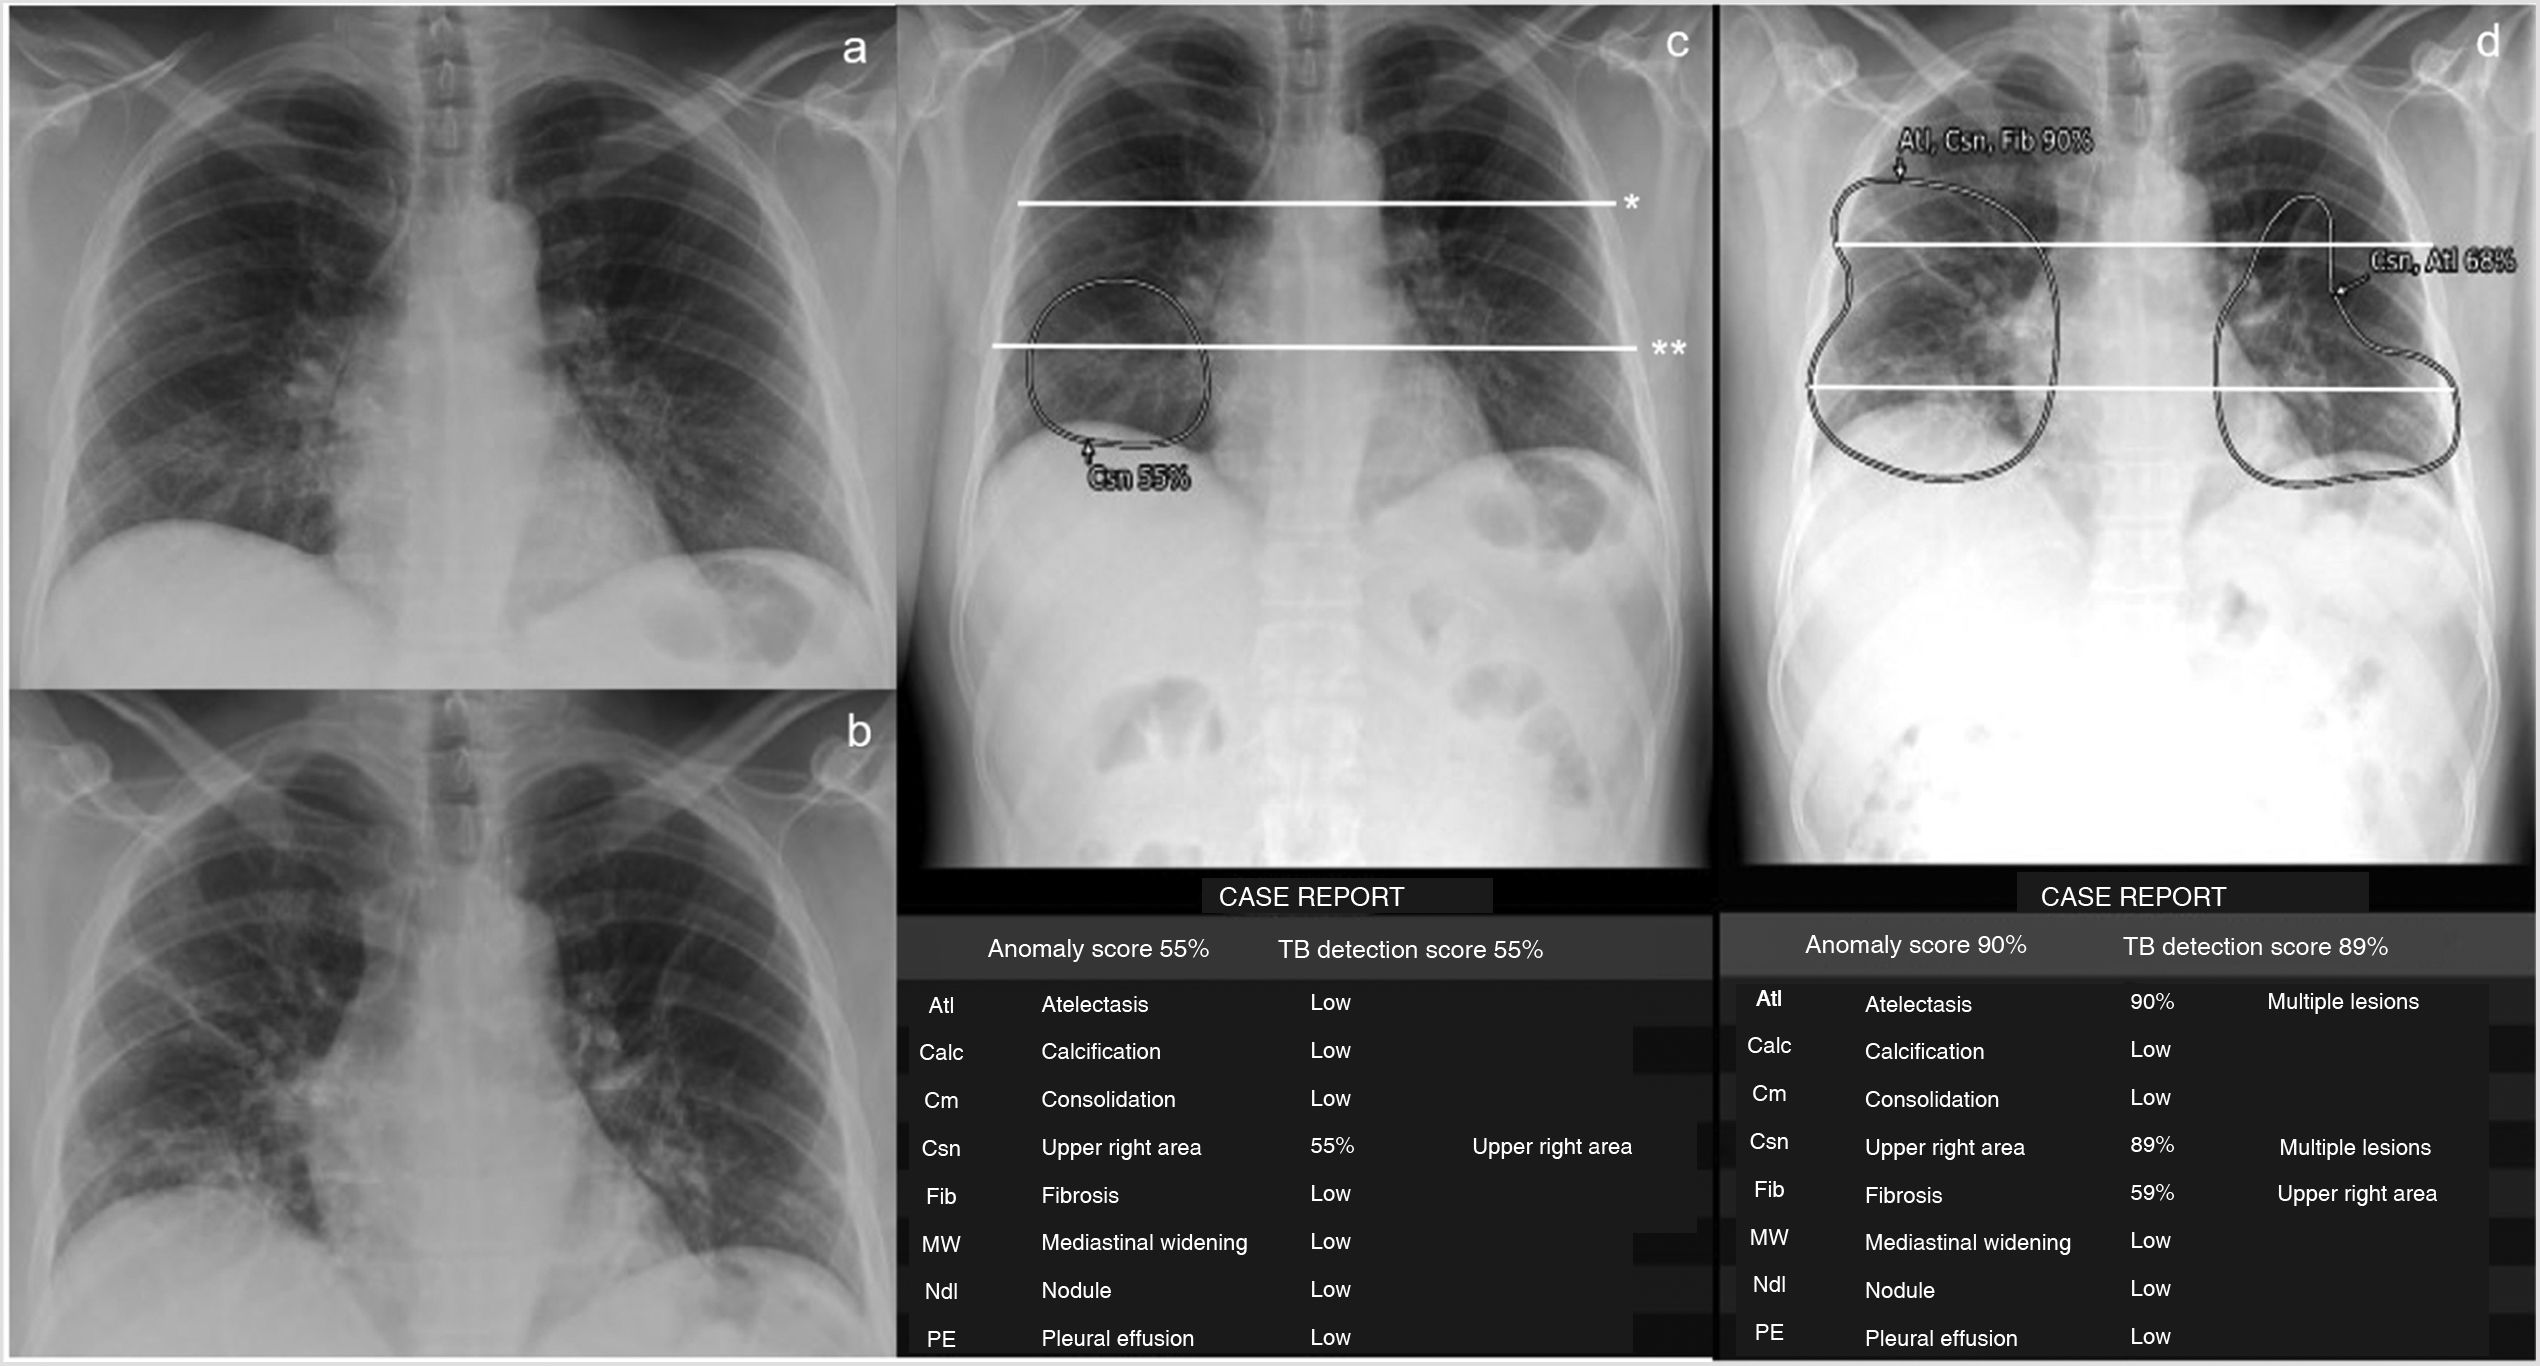
Thoracic Care Suite (which incorporates Lunit Insight CXR, GE Healthcare, Milwaukee, WI, United States) is a commercial AI algorithm designed to detect eight abnormal radiological findings related to thoracic conditions (Fig. 2). In our centre, the TCS is configured with a predetermined threshold and considers any of these findings positive if its probability is greater than 30%. In this study, only TCS lung findings designated by the program as “consolidation,” “nodule,” and “atelectasis” were considered findings indicative of COVID-19 pneumonia. COVID-19 pneumonia causes consolidation with nodular morphology,11 especially at the beginning, something that the TCS interprets as nodules. Therefore, if the nodules detected by TCS had poorly defined margins according to the radiologist's interpretation (consolidations with nodular morphology, unlike interstitial nodules, which have precise margins), they were included as findings indicative of COVID-19 pneumonia. If the program detected atelectasis inside the consolidations, this was also included as a finding indicative of COVID-19 pneumonia (Fig. 2). However, we did not include isolated findings of atelectasis outside the consolidations.
 in posteroanterior projection, obtained on consecutive days (a and b) and detected with the GE Healthcare Thoracic Care Suite tool (which incorporates Lunit Insight CXR) (c and d). The lungs are divided into 6 fields by manually drawing a line that crosses the lower edge of the aortic arch (*) and another (**) which divides the lung below the first one into 2 upper-lower parts as similar as possible in size. The area of consolidation detected by the tool, which affects 2 lung fields in the first CXR, is circled in c. In the CXR study performed the following day, the tool detects an increase in the extent of the consolidations, including atelectasis (d). The extent of involvement progressed from 2 to 6 lung fields, i.e. 4 lung fields in one day. The patient required mechanical ventilation. The data presented in the following tables, namely probability (%) of each outcome, location of outcomes, outcomes other than “consolidations,” “atelectasis” and “nodules,” and “tuberculosis screening score” were not considered for this study.")
Patient with low-grade fever, myalgia, general malaise and a week of evolution with positive RT-PCR for SARS-CoV-2 and pneumonia visible on the chest X-ray (CXR) in posteroanterior projection, obtained on consecutive days (a and b) and detected with the GE Healthcare Thoracic Care Suite tool (which incorporates Lunit Insight CXR) (c and d). The lungs are divided into 6 fields by manually drawing a line that crosses the lower edge of the aortic arch (*) and another (**) which divides the lung below the first one into 2 upper-lower parts as similar as possible in size. The area of consolidation detected by the tool, which affects 2 lung fields in the first CXR, is circled in c. In the CXR study performed the following day, the tool detects an increase in the extent of the consolidations, including atelectasis (d). The extent of involvement progressed from 2 to 6 lung fields, i.e. 4 lung fields in one day. The patient required mechanical ventilation. The data presented in the following tables, namely probability (%) of each outcome, location of outcomes, outcomes other than “consolidations,” “atelectasis” and “nodules,” and “tuberculosis screening score” were not considered for this study.
To quantify the extent of COVID-19 pneumonia, each lung was divided into three lung fields (Fig. 2), according to previous references.7 Our primary radiological variable was the number of involved lung fields determined by TCS with findings indicative of COVID-19 pneumonia. The radiologist checked the radiological abnormalities identified by the AI tool inside the lung fields and only included those findings indicative of COVID-19 pneumonia. The evaluator did not correct the number of lung fields affected by findings indicative of COVID-19 pneumonia obtained according to the AI result. The number of affected lung fields in the first CXR (LF-AI-CXR1) and second CXR (LF-AI-CXR2) were counted. Progression or improvement was also assessed by dividing the difference between LF-AI-CXR1 and LF-AI-CXR2 by the days between the two CXRs and was defined as daily radiological worsening rate in AI-CXR=LF-AI-CXR2–LF-AI-CXR1/days between CXR1 and CXR2.
The process was as follows: the radiologist showed the AI-CXR image on the workstation, manually applied lines to divide the lung fields (Fig. 2) and interpreted whether the radiological semiology in the areas described by the AI tool were findings indicative of COVID-19 pneumonia in each lung field. The number of fields affected by findings indicative of COVID-19 pneumonia was recorded in an Excel database. The time needed to complete the entire radiological report process was measured. In this case, the time used by the AI tool during the post-image processing period was not included, as this post-processing had already been performed before collecting the data for this study. However, in a clinical situation, the tool can be applied directly to the digital X-ray immediately after it is obtained, and the AI result is sent to the picture archiving and communication system (PACS). Basically, the AI does not require any post-processing time. A radiologist with 12 years of experience in thoracic and emergency radiology evaluated the AI-CXR images included in this study.
Non-radiological variablesThe primary endpoint was the need to resort to assisted ventilation, either non-invasive mechanical ventilation or endotracheal intubation (criteria included in the Supplementary document). We also collected data on sex, comorbidities, immunosuppressive treatment and days from symptom onset to CXR1 and CXR2.
Statistical methodsAccording to a previous article,6 assuming a percentage of need for assisted ventilation of 17%, an accuracy of 6.5% and a replacement rate of 10%, and taking into account a 95% confidence interval, the sample size was calculated at 109 patients.
Quantitative variables were expressed as mean±standard deviation or median (interquartile range, IQR) according to normal or non-normal distribution, and qualitative variables were expressed as absolute and relative frequencies. The χ2, Kruskal-Wallis and ANOVA tests were used for the bivariate comparison.
The diagnostic performance of the radiological variables was determined by the area under the curve (AUC) in the receiver operating characteristic (ROC), sensitivity and specificity, positive (PPR) and negative (NPR) probability ratios, the positive (PPV) and negative (NPV) predictive values, all with a 95% confidence interval (95% CI) and the DeLong test for pairwise comparison of ROC curves.
Multivariate analysis using binary logistic regression was performed to determine the association between the need for assisted ventilation and the main effects of non-radiological variables.
Differences were considered statistically significant if p<0.05 with IBM-SPSS-Statistics v 20 and Med-Calc v 12.7.0. The analysis was performed by JMPM (radiologist).
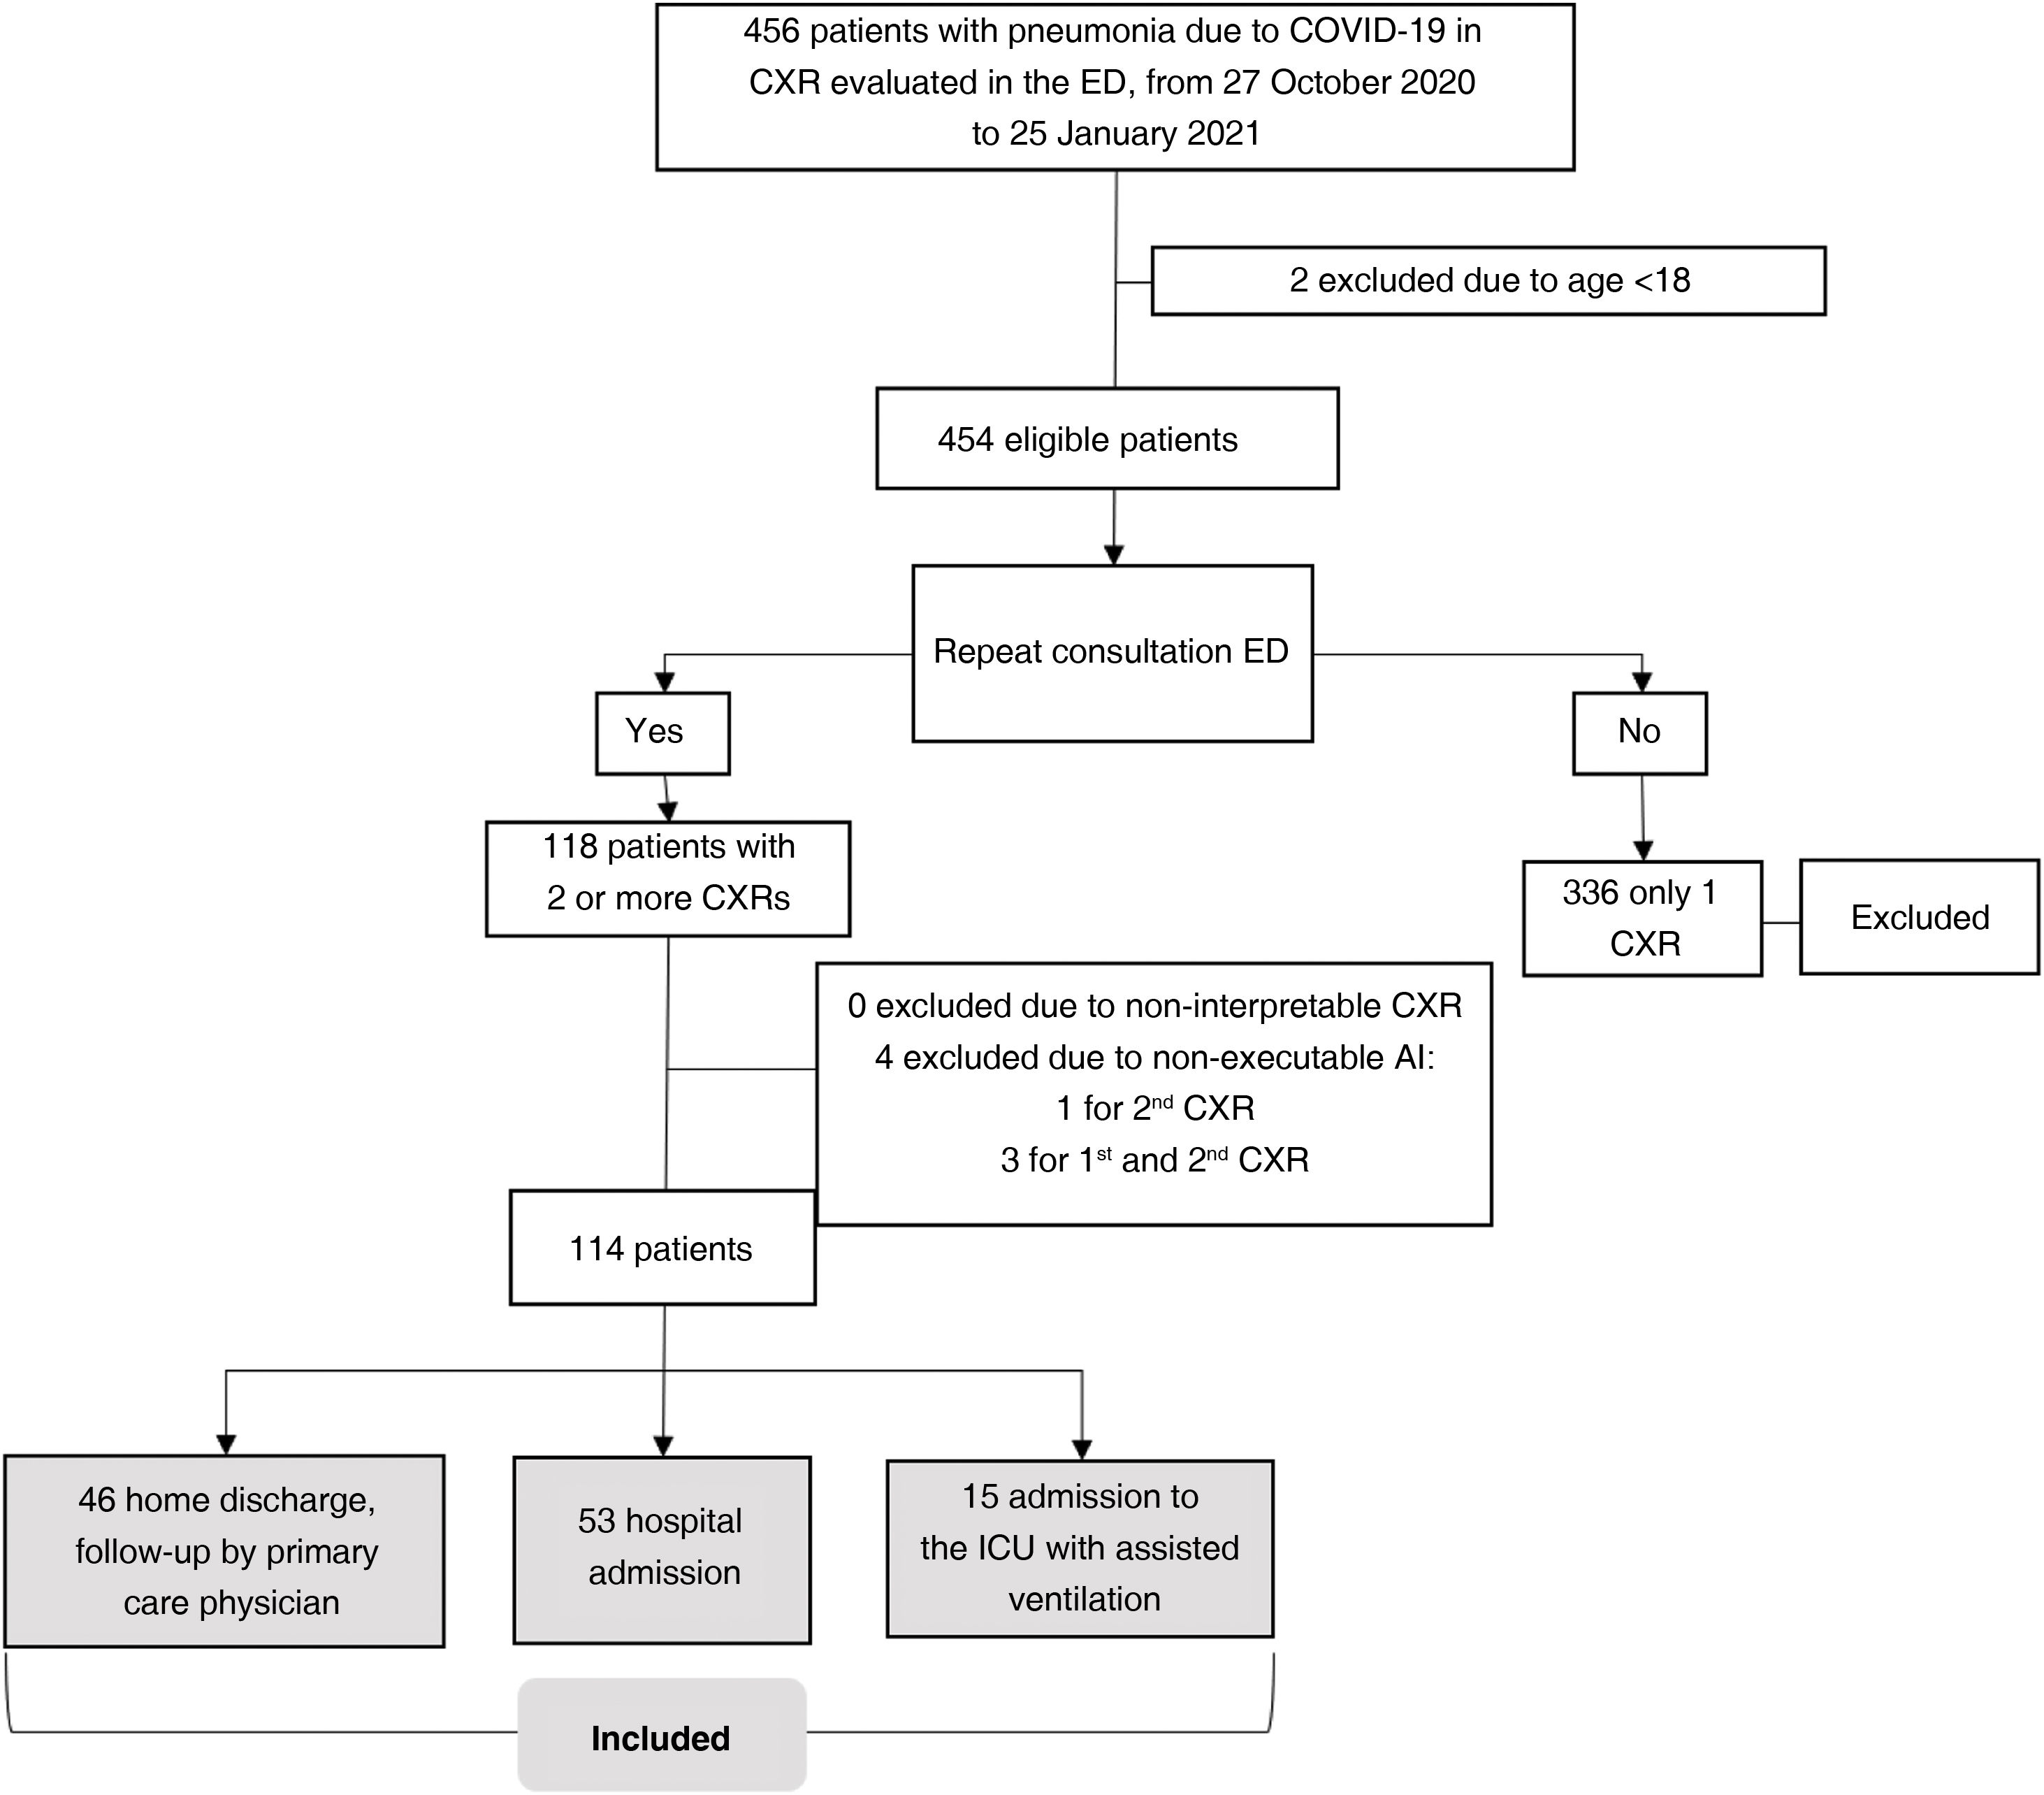
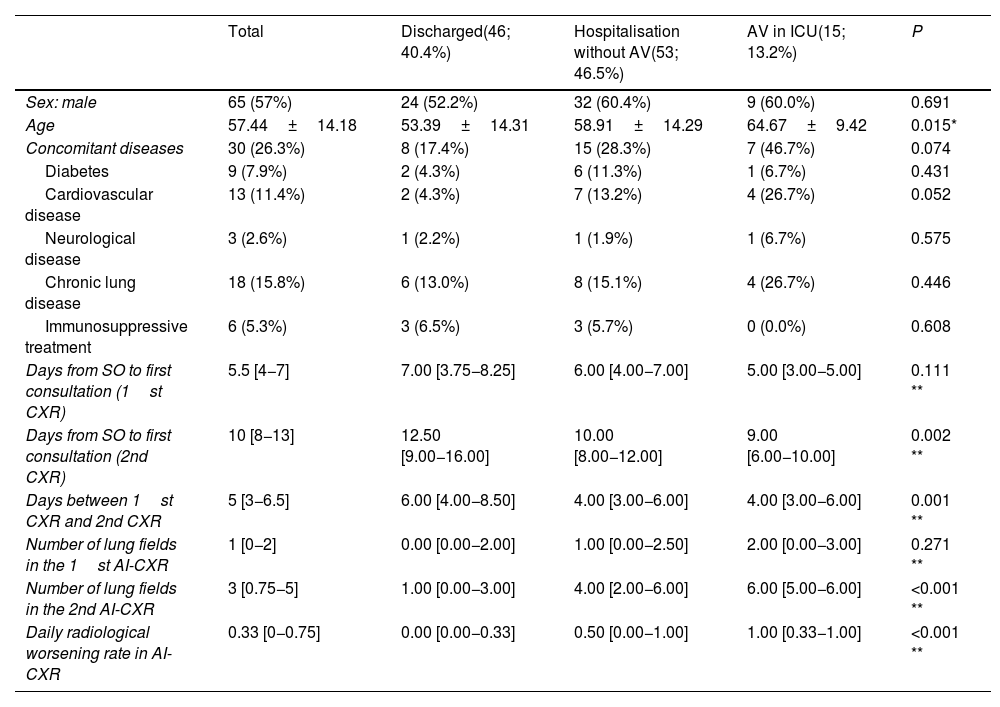
ResultsSampleOutpatients with COVID-19 considered eligible were included consecutively from 27 October 2020 to 25 January 2021. The initial sample comprised 118 patients with CXR1 and CXR2. Four patients were excluded because AI-CXR images could not be obtained for technical reasons. In total, 114 patients were included (57.4±14.2; 65 men), 53 (46.5%) required hospital admission and 15 (13.2%) required assisted ventilation in the ICU (Fig. 3). The characteristics of the sample are shown in Table 1.

Sample characteristics.
| Total | Discharged(46; 40.4%) | Hospitalisation without AV(53; 46.5%) | AV in ICU(15; 13.2%) | P | |
|---|---|---|---|---|---|
| Sex: male | 65 (57%) | 24 (52.2%) | 32 (60.4%) | 9 (60.0%) | 0.691 |
| Age | 57.44±14.18 | 53.39±14.31 | 58.91±14.29 | 64.67±9.42 | 0.015* |
| Concomitant diseases | 30 (26.3%) | 8 (17.4%) | 15 (28.3%) | 7 (46.7%) | 0.074 |
| Diabetes | 9 (7.9%) | 2 (4.3%) | 6 (11.3%) | 1 (6.7%) | 0.431 |
| Cardiovascular disease | 13 (11.4%) | 2 (4.3%) | 7 (13.2%) | 4 (26.7%) | 0.052 |
| Neurological disease | 3 (2.6%) | 1 (2.2%) | 1 (1.9%) | 1 (6.7%) | 0.575 |
| Chronic lung disease | 18 (15.8%) | 6 (13.0%) | 8 (15.1%) | 4 (26.7%) | 0.446 |
| Immunosuppressive treatment | 6 (5.3%) | 3 (6.5%) | 3 (5.7%) | 0 (0.0%) | 0.608 |
| Days from SO to first consultation (1st CXR) | 5.5 [4−7] | 7.00 [3.75−8.25] | 6.00 [4.00−7.00] | 5.00 [3.00−5.00] | 0.111 ** |
| Days from SO to first consultation (2nd CXR) | 10 [8−13] | 12.50 [9.00−16.00] | 10.00 [8.00−12.00] | 9.00 [6.00−10.00] | 0.002 ** |
| Days between 1st CXR and 2nd CXR | 5 [3−6.5] | 6.00 [4.00−8.50] | 4.00 [3.00−6.00] | 4.00 [3.00−6.00] | 0.001 ** |
| Number of lung fields in the 1st AI-CXR | 1 [0−2] | 0.00 [0.00−2.00] | 1.00 [0.00−2.50] | 2.00 [0.00−3.00] | 0.271 ** |
| Number of lung fields in the 2nd AI-CXR | 3 [0.75−5] | 1.00 [0.00−3.00] | 4.00 [2.00−6.00] | 6.00 [5.00−6.00] | <0.001 ** |
| Daily radiological worsening rate in AI-CXR | 0.33 [0−0.75] | 0.00 [0.00−0.33] | 0.50 [0.00−1.00] | 1.00 [0.33−1.00] | <0.001 ** |
The results are shown as a function of absolute frequency (percentage), mean±standard deviation in the case of normal distribution, and median (25th and 75th quartiles) in case of non-normal distribution. Assisted ventilation means the need for non-invasive ventilation or endotracheal intubation. χ2 tests, *ANOVA test, **Kruskal-Wallis test.
Assisted ventilation and admission to the intensive care unit were not a direct consequence of the patient's second clinical evaluation, but of the final result after a period of hospitalisation.
Abbreviations: ICU: intensive care unit; SO: symptom onset; AV: assisted ventilation.
The number of lung fields affected in AI-CXR was greater in patients who required assisted ventilation, but statistical significance was only reached in AI-CXR2 (6.00 IQR: 5.00−6.00; 4.00 IQR: 2.00−6.00 and 1.00 IQR: 0.00−3.00 with respect to the need for assisted ventilation, hospital admission and discharge, respectively; p<0.001). The timing of CXR2 from the onset of symptoms ranged between eight and 13 days (IQR), with greater variability in milder patients discharged again, with an IQR of nine to 16 days (Table 1). The median time between CXR1 and CXR2 was five days (IQR: 3.0–6.5), but this fell to four (IQR: 3.00−6.00) in patients who required hospital admission or assisted ventilation (p= 0.001).
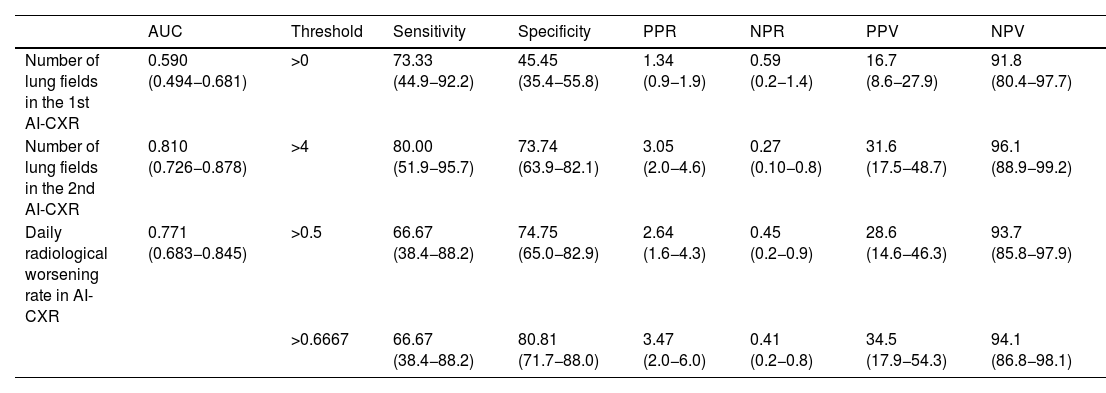
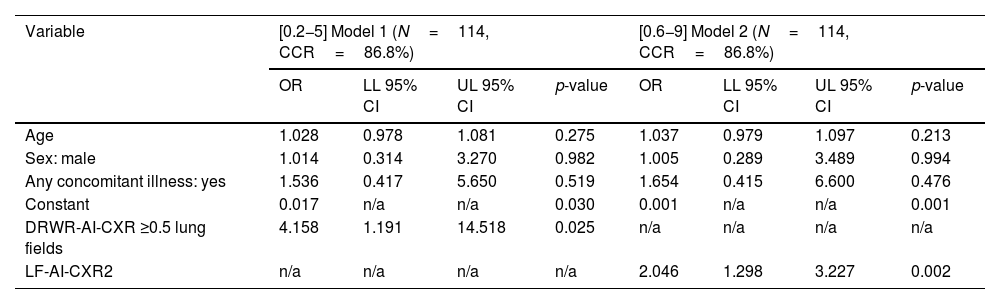
Progression of affected lung fields between AI-CXR1 and AI-CXR2 was an independent risk factor for the need for assisted ventilation. In fact, the daily radiological worsening rate of AI-CXR was higher in patients who required assisted ventilation, with values of 1.00 (IQR: 0.33−1.00); 0.50 (IQR: 0.00−1.00) and 0.00 (IQR: 0.00−0.33) for the need for assisted ventilation, hospital admission and discharge, respectively (p<0.001; Table 1). The AUC of the daily radiological worsening rate in AI-CXR to predict the need for assisted ventilation was 0.771 (95% CI: 0.683−0.845; p< 0.001; Table 2). When pneumonia progressed ≥0.5 lung fields per day, there was a 4.2-fold increase in the need for assisted ventilation according to binary logistic regression (95% CI: 1.19–14.52; p= 0.025, Table 3) with sensitivity of 66.67 (95% CI: 38.4−88.2), specificity of 74.75 (95% CI: 65.0−82.9), PPR of 2.64 (95% CI: 1.6−4.3), NPR of 0.45 (95% CI: 0.2−0.9), PPV of 28.6 (95% CI: 14.6−46.3) and NPV of 93.7 (95% CI: 85.8−97.9) for the need for assisted ventilation (Table 2). When pneumonia progressed by 0.67 lung fields per day, the specificity reached 80.81 (95% CI: 71.7−88.0) and the NPV 94.1 (95% CI: 86.8−98.1), with the sensitivity figure remaining at 66.67 (38.4−88.2) (Table 2).
Diagnostic performance of the number of lung fields in the first and second AI-CXR and daily radiological worsening rate in AI-CXR.
| AUC | Threshold | Sensitivity | Specificity | PPR | NPR | PPV | NPV | |
|---|---|---|---|---|---|---|---|---|
| Number of lung fields in the 1st AI-CXR | 0.590 (0.494−0.681) | >0 | 73.33 (44.9−92.2) | 45.45 (35.4−55.8) | 1.34 (0.9−1.9) | 0.59 (0.2−1.4) | 16.7 (8.6−27.9) | 91.8 (80.4−97.7) |
| Number of lung fields in the 2nd AI-CXR | 0.810 (0.726−0.878) | >4 | 80.00 (51.9−95.7) | 73.74 (63.9−82.1) | 3.05 (2.0−4.6) | 0.27 (0.10−0.8) | 31.6 (17.5−48.7) | 96.1 (88.9−99.2) |
| Daily radiological worsening rate in AI-CXR | 0.771 (0.683−0.845) | >0.5 | 66.67 (38.4−88.2) | 74.75 (65.0−82.9) | 2.64 (1.6−4.3) | 0.45 (0.2−0.9) | 28.6 (14.6−46.3) | 93.7 (85.8−97.9) |
| >0.6667 | 66.67 (38.4−88.2) | 80.81 (71.7−88.0) | 3.47 (2.0−6.0) | 0.41 (0.2−0.8) | 34.5 (17.9−54.3) | 94.1 (86.8−98.1) |
The data in brackets are confidence intervals of 95%.
AI-CXR: CXR processed with the AI tool; AUC: area under the curve; NPR: negative probability ratios; NPV: negative predictive value; PPR: positive probability ratios; PPV: positive predictive value.
Binary logistic regression models for the rate of radiological worsening of the CXR processed with the AI tool ≥0.5 lung fields (model 1) and number of affected lung fields in the second CXR processed with the AI tool (model 2).
| Variable | [0.2−5] Model 1 (N=114, CCR=86.8%) | [0.6−9] Model 2 (N=114, CCR=86.8%) | ||||||
|---|---|---|---|---|---|---|---|---|
| OR | LL 95% CI | UL 95% CI | p-value | OR | LL 95% CI | UL 95% CI | p-value | |
| Age | 1.028 | 0.978 | 1.081 | 0.275 | 1.037 | 0.979 | 1.097 | 0.213 |
| Sex: male | 1.014 | 0.314 | 3.270 | 0.982 | 1.005 | 0.289 | 3.489 | 0.994 |
| Any concomitant illness: yes | 1.536 | 0.417 | 5.650 | 0.519 | 1.654 | 0.415 | 6.600 | 0.476 |
| Constant | 0.017 | n/a | n/a | 0.030 | 0.001 | n/a | n/a | 0.001 |
| DRWR-AI-CXR ≥0.5 lung fields | 4.158 | 1.191 | 14.518 | 0.025 | n/a | n/a | n/a | n/a |
| LF-AI-CXR2 | n/a | n/a | n/a | n/a | 2.046 | 1.298 | 3.227 | 0.002 |
The reference categories for dichotomous qualitative variables were “sex: female,” “any concomitant disease: no”.
95% CI: 95% confidence interval; AI-CXR: CXR processed with the AI tool; CCR: correct classification rate; DRWR-AI-CXR: daily radiological worsening rate of the CXR processed with the AI tool; LF-AI-CXR2: number of lung fields in the second AI-CXR; LL: lower limit; n/a: not applicable; OR: odds ratio; UL: upper limit.
Although the LF-AI-CXR2 achieved a better AUC (0.810; 95% CI: 0.657−0.886; Table 2), no significant differences were obtained between LF-AI-CXR2 and the daily radiological worsening rate of AI-CXR in the pairwise comparison of the ROC curves (p= 0.550), and the prognostic capacity of the need for assisted ventilation of LF-AI-CXR2 was worse according to the binary logistic regression analysis, with a relative risk of 2.05 (95% CI: 1.30–3.23; p= 0.002, Table 3).
Time taken to obtain AI-CXR dataThe AI-CXR images included in this study were evaluated in a single session. Two AI-CXR images were evaluated in each patient, i.e. 228 images (114×2). Each CXR image was loaded into the viewer, the existence of consolidations or nodules with poorly defined margins was interpreted when detected by TCS, and the number of lung fields affected by these results was noted. The entire session lasted 98min, meaning 25.78s were spent on each AI-CXR image (98×60=5880/228) or, in other words, 2.33 AI-CXR images were evaluated per minute (228/98).
Non-radiological variablesAlthough the age of the patients who required assisted ventilation was higher in the univariate analysis (64.67±9.42, 58.91±14.29 and 57.44±14.18 years with respect to the need for assisted ventilation, hospital admission and discharge, respectively; p= 0.015) and they were more likely to suffer from comorbidities (46.7%; 28.3%; 17.4%, respectively; p= 0.074), these variables did not independently influence the outcome of assisted ventilation in the multivariate analysis (Tables 1 and 3).
DiscussionIn this study we observed that the use of the TCS tool to determine the initial progression of lung consolidations in COVID-19 pneumonia is feasible. In cases that progressed at a rate of at least "half a lung field per day," the risk of requiring assisted ventilation quadrupled in the short term. The complete radiological process to obtain the result of the extent of COVID-19 pneumonia required an average of 26s per X-ray. Although the number of affected lung fields in CXR2 obtained better AUC figures in our analysis, the better prognostic capacity of the daily radiological worsening rate of AI-CXR may be influenced by the added value of the rate of worsening included in the equation for the last one. In contrast, the timing of the second X-ray varied between patients, depending on their own perception of worsening or the GP's perception after having spoken to the patient on the phone.
In many centres, a CXR report is not created due to limited human resources.12 However, during the pandemic, the need to create radiological reports for a large number of patients with suspected COVID-19 pneumonia has driven changes to improve results in radiology.4 In these circumstances, radiology departments are interested in tools that quickly provide useful diagnostic and prognostic information, even if they are not specifically designed for the evaluation of COVID-19. In this study we have shown the effectiveness of an AI tool available on the market, initially developed for other lung diseases, applied to patients with COVID-19 pneumonia. Radiologists would only have to spend 26s per AI-CXR result to determine the number of affected lung fields detected by the algorithm. Systematic application of this tool would help detect the rapid progression of pneumonia. Other work on the application of AI to the prognosis of COVID-19 based on imaging tests, such as computed tomography,13 is less intuitive for humans and has only been developed in the laboratory.
According to systematic reviews and critical appraisal of COVID-19 prognostic models,14 the only ones that have shown evidence of reliability for this purpose did not include radiological variables.14,15 However, we have previously shown that systematic use of follow-up data provided by CXR in patients with COVID-19 would provide critical prognostic information.6 For all these reasons, we believe that in many centres overloaded by scarce resources or enormous workloads, or both at the same time, commercial algorithms, despite not being specifically designed for these results, can provide significant help.
Several AI studies have reported good results in predicting the need for assisted ventilation based on the first CXR performed in the emergency department in patients with suspected COVID-19 pneumonia.16–18 However, they cannot be easily compared with our results due to methodological differences. The way we provide radiological care to primary care patients at our centre4 probably made it easier to perform CXR earlier than elsewhere. If this is proven to be true, we could have detected a greater number of mild pneumonias with CXR1 and the difference between the radiological findings of CXR1 and CXR2 could have a better prognostic capacity than the findings found in our CXR1. However, we still believe that the prognostic capacity of the difference between CXRs would be useful even in patients with more advanced pneumonia at the time of diagnosis. In fact, the specificity recorded (58.8%) was worse when AI was applied to CXR117 than in our CXR1 vs. CXR2 approach (75%–81%). This means that patients who progress rapidly would not be detected based on CXR1 results alone. On the other hand, despite having also demonstrated the predictive value of AI tools in chest CT performed in patients with COVID-19 pneumonia,13,19 their usefulness is much more limited, since CT is limited to patients with suspected complications.20 Furthermore, due to the current workload of many radiology departments, it would not be feasible to perform a CT scan on all patients with suspected COVID-19 pneumonia in the emergency department, especially when AI results must be validated by a radiologist.
Our study had a number of limitations. One limitation is that the sensitivity and specificity of lung progression of specific lesions of COVID-19 pneumonia through 0.5 fields or more per day to predict the need for mechanical ventilation are 66% and 74%, respectively. Although in our case the performance of the AI tool was lower than that of a human evaluator in determining the severity of lung involvement,6the advantage of the tool compared to a human evaluator is that it can be applied to all CXRs as it provides quick results. Another limitation is that the progression in the number of lung fields was only taken into account when an affected lung field was not affected in the previous CXR, but not if its progression had occurred within the same previously affected field. Although it could be extrapolated to a worsening in the same lung field, we consider that the involvement of a new lung field is more pertinent since, except in areas adjacent to fields already affected, it is most likely that the appearance of consolidations in a new field implies more lung involvement than progression in an already affected field. On the other hand, we have not measured whether the progression of COVID-19 pneumonia detected with AI-CXR predicts progression sooner than worsening inflammatory markers or oxygenation would. However, the information in our study can be obtained from CXRs performed during pneumonia follow-up, i.e. without additional tests. Finally, it is possible that age and concomitant diseases did not influence the prognosis due to our small sample size, but we believe that this is unlikely to have modified the prognostic capacity independent of the radiological variable used in this study.
In fact, the structural shortage of human resources, the policies of radiology departments regarding CXR reporting and the enormous workloads during epidemics could have a relevant impact on the way the AI tool could be used in the area of emergency care. Whatever the reason, the potential consequences should not be ignored. In particular, during epidemics, when radiologists cannot ensure rapid evaluation of AI results before they are available to the requesting physician, false positive AI-CXR results could lead to unnecessary procedures. Similarly, false negatives in AI-CXR (e.g. in our case, the risk of progression would not be detected in 33.3% [100−66.7%] of patients) would likely result in insufficient follow-up decisions. We therefore need much more responsive AI solutions in the future. Relying on negative AI results will likely reduce the radiologist's workload by avoiding evaluation of CXRs classified as normal.
In summary, the initial progression of COVID-19 pneumonia by half a lung field or more per day, as shown by the TCS tool, quadruples the risk of respiratory failure requiring mechanical ventilation. With this information provided by the AI, it takes the radiologist an average of 26s to record the number of affected lung fields.
FundingThis study did not receive any specific grant from funding agencies in the public, commercial or non-profit sectors. The authors have limited themselves to evaluating the performance of the program provided by the company General Electric specifically for this study, without any contractual relationship or remuneration for the services.
Authorship- •
Responsible for study integrity: JMPM.
- •
Study concept: JMPM, JMGS.
- •
Study design: JMPM.
- •
Data collection: JMPM, RPC.
- •
Data analysis and interpretation: JMPM.
- •
Statistical processing: JMPM; MBR.
- •
Literature search: JMPM.
- •
Drafting of the article: JMPM.
- •
Critical review of the manuscript and significant intellectual contribution: JMPM, JMGS, MBR, RPC.
- •
Approval of the final version: JMPM, JMGS, MBR, RPC.
The authors declare that they have no conflicts of interest.
The following is Supplementary data to this article:

