


Supplement "Advances in Musculoskeletal Radiology"
More infoIt is known that COVID-19 has multisystemic effects. However, its early effects on muscle tissue have not been clearly elucidated. The aim of this study is to investigate early changes in the pectoral muscle in patients with COVID-19 infection.
Materials and methodsThe pectoral muscle areas (PMA) and pectoral muscle index (PMI) of 139 patients diagnosed with COVID-19 were measured from chest CTs taken at the time of the first diagnosis and within 6 months after the diagnosis. The effect of the infection on the muscle area was investigated by evaluating whether there was a change between the two measurements. Lung involvement of the infection in the first CT was scored with the CT severity score (CT-SS). In addition, the effects of patients' clinics, CT-SS, length of hospital stay, and intubation history on changes in the muscle area were investigated.
ResultsWhen the PMA and PMI values were compared, there was a statistically significant decrease in the values in the control CT group compared to the first diagnosis CT group. The difference was found higher in intubated patients. CT-SS was associated with a decrease in PMI.
ConclusionCOVID-19 is one of the causes of acute sarcopenia. Pectoralis muscle is part of the skeletal muscle, and there may be a decrease in the muscle area in the early period of the disease.
Sabemos que la COVID-19 afecta a múltiples órganos. Sin embargo, sus primeros efectos en el tejido muscular todavía no se han esclarecido. Este estudio tiene por objetivo investigar las alteraciones iniciales que se observan en el músculo pectoral de pacientes con COVID-19.
Materiales y métodosLas áreas del músculo pectoral (AMP) y el índice del músculo pectoral (IMP) de 139 pacientes diagnosticados de COVID-19 se midieron a partir de TC (tomografías computarizadas) torácicas obtenidas en el momento de establecer el primer diagnóstico y en los 6 meses posteriores al mismo. El efecto de la infección en el área muscular se investigó mediante la evaluación de alteraciones entre las dos mediciones. La afectación pulmonar de la infección en la primera TC se puntuó según la puntuación de gravedad de la TC (CT severity score, CT-SS). También se investigaron los efectos de la clínica del paciente, la CT-SS, la duración del ingreso y los antecedentes de intubación en las alteraciones del área muscular.
ResultadosAl comparar los valores del AMP y el IMP, se observó una disminución estadísticamente significativa de los valores en el grupo con una TC de control en comparación con el grupo con una TC de primer diagnóstico. Se observó una mayor diferencia en los pacientes intubados. La CT-SS se asoció a una disminución del IMP.
ConclusiónLa COVID-19 es una de las causas de sarcopenia aguda. El músculo pectoral forma parte del músculo esquelético, y puede producirse una disminución del área muscular en los periodos iniciales de la enfermedad.
Sarcopenia is a syndrome characterised by loss of skeletal muscle mass and a degenerative loss of muscle quality. It can occur in patients of normal weight, who are overweight or who are underweight. It therefore differs from ordinary weight loss or cachexia.1 The European Working Group on Sarcopenia in Older People 2 (EWGSOP2) defines acute sarcopenia as sarcopenia that occurs within six months of a stress-induced event.2 Acute sarcopenia is most commonly observed in hospitalised patients. Old age is a risk factor, yet it is becoming increasingly accepted that it can occur at any age. Acute sarcopenia can occur in people with previously strong muscle structures after severe disease progression.3
Coronavirus disease (COVID-19) causes anorexia, weight loss and decreased albumin levels in humans. Despite a lack of sufficient studies,4–6 this suggests that severe COVID-19 is associated with cachexia, myalgia and muscle wasting. In addition, bed rest during post-COVID-19 recovery can lead to severe sarcopenia.7
Computed tomography (CT) and magnetic resonance imaging (MRI) are sensitive imaging techniques capable of distinguishing adipose tissue and other soft tissues. Therefore, these methods are recommended for predicting adipose tissue and skeletal muscle mass.8 It has been reported that there is an association between the pectoralis muscle area (PMA) recorded by CT and the bioimpedance measurement of lean mass, lung function, symptoms and exercise capacity. Furthermore, low PMA and pectoralis muscle index (PMI) values—the latter obtained by dividing PMA by the patient’s squared height—have been found to be prognostic factors in many benign and malignant diseases.9,10
However, there is little knowledge about these changes in the context of COVID-19. The aim of this study was to use CT to investigate the effect of COVID-19 on muscle areas (PMA and PMI).
Materials and methodsStudy design and patientsThis was a retrospective study approved by the ethics committee of our hospital. No informed consent was required.
Inclusion criteria for the study were: positive reverse transcription-polymerase chain reaction (RT-PCR) in nasopharyngeal or oropharyngeal samples obtained between April and July 2020, and the availability of findings from two chest CT scans: one at diagnosis (within four days of diagnosis) and the other within six months of diagnosis. Exclusion criteria were: patients younger than 18, motion artefacts appearing on CT images, or asymmetric position on CT that could affect the measurements.
Clinical assessmentThe initial clinical condition of the patients was assessed and scored using four categories: 1 (mild illness): mild or minimal clinical symptoms; 2 (extended illness): presence of fever and respiratory symptoms, absence of dyspnoea or need for oxygen support; 3 (severe illness): fever or suspected respiratory tract infection and severe dyspnoea and/or elevated respiratory rate (≥30 breaths per minute) and/or decreased oxygen saturation (SpO2 ≤93% on room air) and/or PaO2/FiO2 ≤300 mmHG; 4 (critical illness): dyspnoea requiring mechanical ventilation, septic shock and other organ failure requiring monitoring and treatment in the intensive care unit (ICU).10
The patients' comorbidities were recorded including hypertension, asthma, chronic obstructive pulmonary disease, heart failure, malignant neoplasms, immunosuppression, coronary artery disease, diabetes and chronic kidney disease.
We also registered data on hospitalisations, intubation history and mortality. The patients were divided into four groups in terms of hospitalisation: group 1: non-hospitalised patients; group 2: patients hospitalised for less than 10 days; group 3: patients hospitalised for more than 10 days; group 4: patients admitted to ICU.
CT protocolAll chest CT scans were performed in the supine position, with the patient holding their breath and without the administration of intravenous contrast medium. All scans were performed on the device designated for patients with suspected COVID-19, following the respective imaging protocol (Toshiba Alexion 16-slice CT scanner, Toshiba Medical Systems, Nasu, Japan). The lung image was obtained from the apex to the diaphragm in all cases. The following technical parameters were used: tube current modulation: 0−250 mAs, tube voltage: 90−120 kV; slice thickness: 3 mm; pitch factor: 0.8; rotation time: 75 s; field of view: 250−300 mm, and matrix: 512 × 512 .
CT evaluationThe score assigned to each patient in the study was calculated on the basis of the extent of lung involvement on the first chest CT scan obtained in the first four days after diagnosis. The CT severity score (CT-SS) was calculated on the basis of the first CT scan image. The lungs were divided into 20 segments, as per the Boyden classification of bronchi: 10 segments in the right lung and 10 segments in the left lung. Zero points were allocated if the segment was normal, 1 point if 50% of the segment was affected and 2 points if more than 50% of the segment was affected. The total CT score was calculated by adding together all scores from all segments. The total score ranged from 0 (no involvement) to 40 (more than 50% of each segment involved in all 20 segments).11 Two radiologists, with 9 and 12 years’ experience in diagnostic CT imaging, evaluated the chest CT images independently. They were blinded to the patients’ ages and analytical and clinical findings. The CT window centre was set at −500 Hounsfield units (HU) and the window width at 1,500 HU. When the two radiologists disagreed on the CT-SS, a third radiologist, with 30 years’ experience, assessed the images, and a joint decision was made.
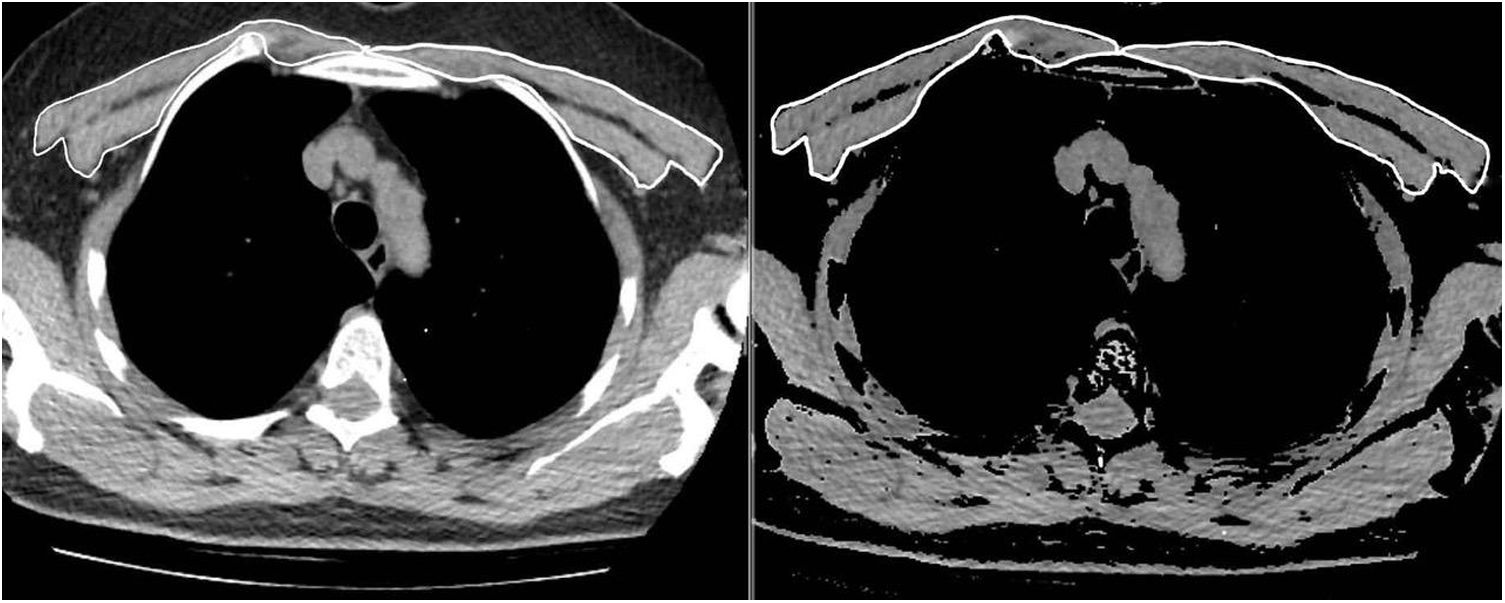
The same two radiologists measured the PMA for the first and second CT scans, while blinded to the patients’ names, ages, analytical and clinical findings, and the dates of the CT scans. To achieve inter-observer agreement, a second observer radiologist repeated the PMA measurements for 63 consecutive patients using the same method while also being blinded to the results of the first measurement. The pectoralis major and minor muscles were identified within the attenuation range of -50 to 90 HU in a single section above the aortic arch, as in the literature (Fig. 1). The PMA value (cm2) was calculated by adding together the bilateral pectoralis major and minor muscle areas.10 In addition, the PMI was calculated by dividing the PMA value by the patient's squared height (cm2/m2).
Statistical analysis
NCSS (Number Cruncher Statistical System) 2007 (Kaysville, Utah, USA) was used for the statistical analyses. Descriptive statistical methods (mean, standard deviation, median, first quartile, third quartile, frequency, percentage, minimum, maximum) were used. An assessment of the conformity of quantitative data to normal distribution was carried out using the Shapiro-Wilk test and graphic evaluations. The dependent t-test was used to evaluate the observed change in PMA and PMI values from the first measurement to the follow-up measurement. The independent t-test was used to compare quantitative variables with the normal distribution between the two groups of images. The Mann-Whitney U test was used to compare quantitative variables with abnormal distribution between the two groups. The Kruskal–Wallis test was used to compare quantitative variables with abnormal distribution between more than two groups. Pearson and Spearman correlation coefficients were used to assess the relationship between quantitative variables, and the intraclass correlation coefficient (ICC) level was used to assess inter-observer agreement. Univariate and multivariate logistic regression analyses were performed to determine factors affecting intubation and mortality. Univariate and multivariate linear regression analyses were performed to determine factors affecting CT-SS. Statistical significance was set at p < 0.05.
ResultsThe age of 139 patients included in the study ranged from 27 to 87 years (mean: 59.01 ± 14.34). Female patients accounted for 43.2% (n = 60) and male patients accounted for 56.8% (n = 79). The CT-SS score of the cases ranged from 0 to 38. Comorbidities were detected in 75.5% of the patients (n = 105).
Hospitalisation rates were as follows: group 1: 8.6% (n = 12); group 2: 30.3% (n = 42); group 3: 30.3% (n = 42), and group 4: 30.8% (n = 43). 15.8% of patients (n = 22) had been intubated and 11.5% of them died (n = 16).
The time interval between the first CT scan and the follow-up CT scan ranged from 2 to 137 days, with a mean of 39.5 ± 42.01 days. This time interval was less than 30 days for 55.4% of patients (n = 77), between 30 and 90 days for 23.7% (n = 33), and 90 days or more for 20.9% (n = 29).
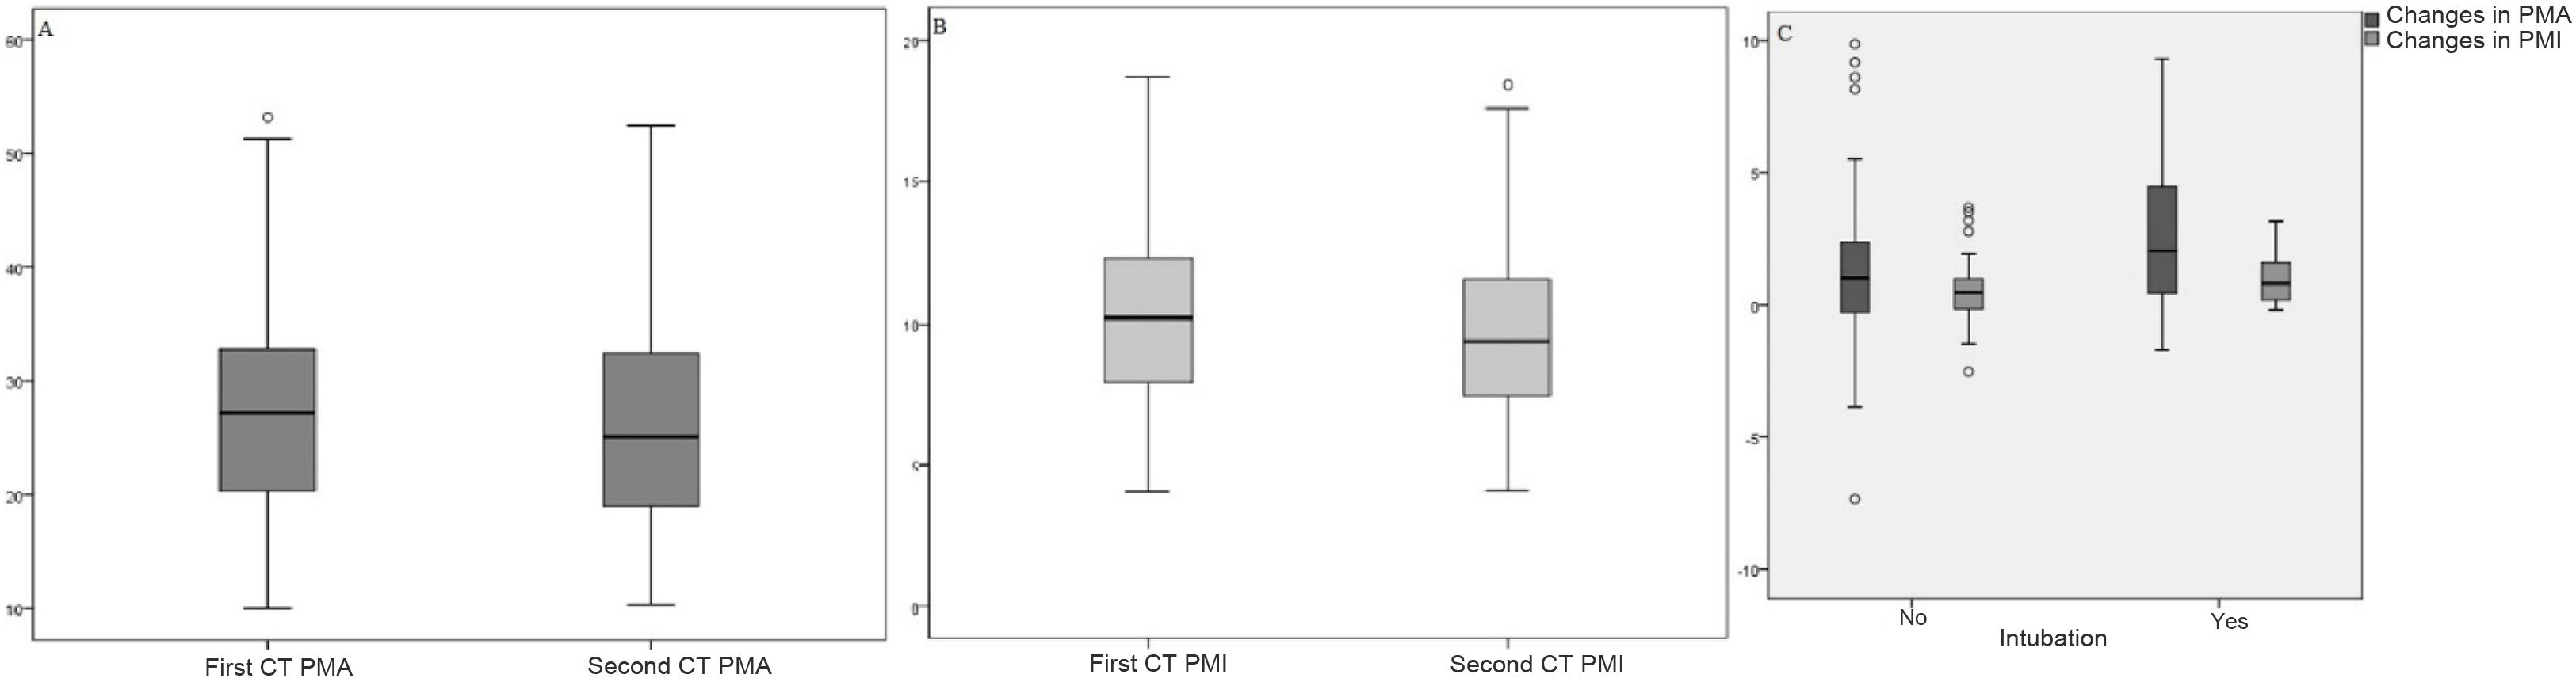
PMA values ranged from 10.01 to 53.21 cm2 in the first chest CT, and from 10.36 to 52.5 cm2 in the second. PMI values ranged from 4.12 to 18.67 cm2/m2 in the first chest CT, and from 4.15 to 18.42 cm2/m2 in the follow-up scan.
On comparison of the first and second CT measurements, a mean change in PMA values of 1.34 ± 2.66 cm2 and a mean change in PMI values of 0.54 ± 0.99 cm2/m2 were statistically significant (p < 0.001) (Table 1).
Distribution of PMA and PMI measurements for two scans.
| PMA (cm2) | PMI (cm2/m2) | |
|---|---|---|
| Mean ± SD | Mean ± SD | |
| First CT | 27.58 ± 9.60 | 10.26 ± 3.21 |
| Follow-up CT | 26.24 ± 9.27 | 9.73 ± 3.07 |
| Changes | 1.34 ± 2.66 | 0.54 ± 0.99 |
| P | < 0.001* | < 0.001* |
| ICC (CI 95%) | 0.960 (0.945−0.971) | 0.951 (0.932−0.964) |
PMA, pectoralis muscle area; ICC, intra-class correlation coefficient; PMI, pectoralis muscle index.
Dependent t-test.
Changes in PMA and PMI scores are not statistically significant according to sex, comorbidities, time elapsed between first measurement and follow-up, length of hospital admission, or mortality (p > 0.05). Meanwhile, changes in PMA and PMI scores were statistically significant in terms of intubation status (p < 0.05); the difference was higher in intubated patients (Table 2). The distribution of PMA-PMI values in the first chest CT and follow-up chest CT, and the distribution of PMA-PMI differences in terms of intubation, are shown in Fig. 2.
Assessments in terms of changes in PMA and PMI.
| Changes in PMA (Δ) | Changes in PMI (Δ) | ||
|---|---|---|---|
| Age | ra | 0.057 | 0.046 |
| p | 0.506 | 0.593 | |
| Clinical score | rb | 0.101 | 0.098 |
| p | 0.237 | 0.250 |
| Mean ± SD | Mean ± SD | |
|---|---|---|
| Sex | ||
| Female | 1.02 ± 1.66 | 0.46 ± 0.72 |
| Male | 1.59 ± 3.21 | 0.59 ± 1.15 |
| pc | 0.183 | 0.427 |
| Comorbidities | ||
| None | 0.91 ± 2.73 | 0.41 ± 1.04 |
| Yes | 1.48 ± 2.64 | 0.58 ± 0.97 |
| pc | 0.272 | 0.399 |
| OR (CI 95%) | OR (CI 95%) | |
|---|---|---|
| Time elapsed between first and follow-up CTs | ||
| <30 days | 0.80 (−0.08−2.60) | 0.38 (−0.04−0.98) |
| 30−90 days | 1.35 (−0.12−2.75) | 0.55 (−0.04−1.21) |
| >90 days | 1.13 (−1.71−2.83) | 0.50 (−0.23−1.17) |
| pd | 0.746 | 0.794 |
| Hospitalisation | ||
| Non-hospitalised patients | 0.34 (−0.61−1.82) | 0.14 (−0.15−0.65) |
| Patients hospitalised for less than 10 days | 0.97 (−0.78−2.59) | 0.49 (−0.31−1.14) |
| Patients hospitalised for more than 10 days | 1.42 (0.12−2.64) | 0.54 (0−0.98) |
| Patients admitted to intensive care unit | 1.13 (−0.08−4.1) | 0.5 (−0.04−1.46) |
| pd | 0.241 | 0.302 |
| Intubation | ||
| No | 1.01 (−0.28−2.37) | 0.46 (−0.15−0.98) |
| Yes | 2.05 (0.43−4.47) | 0.82 (0.18−1.6) |
| pe | 0.034* | 0.033* |
| Death | ||
| No | 1.1 (−0.27−2.69) | 0.5 (−0.11−1.11) |
| Yes | 0.65 (0.11−2.88) | 0.27 (0.04−1.17) |
| pe | 0.719 | 0.707 |
PMA, pectoralis muscle area; PMI, pectoralis muscle index.
 Pectoralis muscle area (PMA) distribution. (B) Pectoralis muscle index (PMI) values on the first and follow-up chest CT scans. (C) Distribution of differences in pectoralis muscle area and pectoralis muscle index according to intubation status.")
The inter-observer agreement coefficient was ICC 0.960 (CI 95%: 0.945−0.971) for the PMA measurements, and ICC 0.951 (CI 95%: 0.932−0.964) for the PMI measurements, indicating complete agreement.
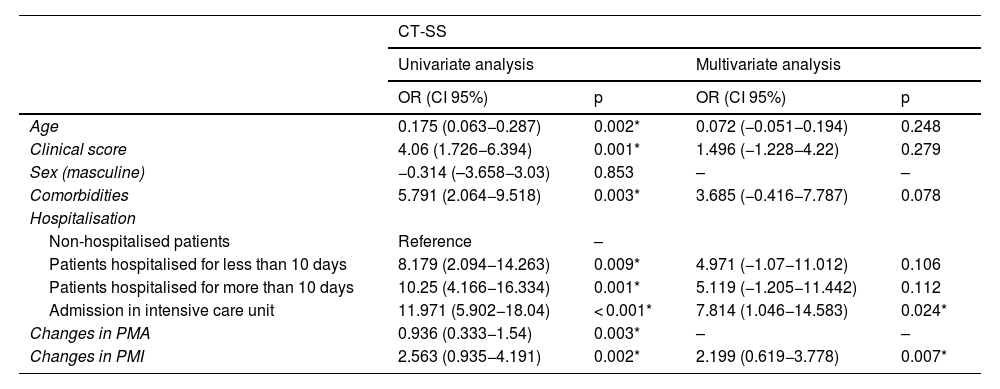
Univariate and multivariate linear regression analyses were performed to determine factors affecting CT-SS and intubation. In the univariate assessments, age, clinical score, comorbidities, length of hospitalisation, and values of PMA and PMI change were found to significantly influence CT-SS (p < 0.05). These variants were included in the multivariate analysis. The model obtained was considered statistically significant (F = 4.850; p < 0.001, R2adj = 0.182). ICU admission and PMI values were found to be significant in the model. The CT-SS of patients hospitalised in an intensive care unit proved to be 7.814 higher than the scores of patients who were not hospitalised (OR: 7.814, CI 95%: 1.046−14.583), p = 0.024). When the PMI value increased by one unit, the CT-SS increased by 2.199 units (OR: 2.199; 95% CI: 0.619−3.778; p = 0.007) (Table 3).
Results of the univariate and multivariate analyses of factors affecting CT-SS.
| CT-SS | ||||
|---|---|---|---|---|
| Univariate analysis | Multivariate analysis | |||
| OR (CI 95%) | p | OR (CI 95%) | p | |
| Age | 0.175 (0.063−0.287) | 0.002* | 0.072 (−0.051−0.194) | 0.248 |
| Clinical score | 4.06 (1.726−6.394) | 0.001* | 1.496 (−1.228−4.22) | 0.279 |
| Sex (masculine) | −0.314 (–3.658−3.03) | 0.853 | – | – |
| Comorbidities | 5.791 (2.064−9.518) | 0.003* | 3.685 (−0.416−7.787) | 0.078 |
| Hospitalisation | ||||
| Non-hospitalised patients | Reference | – | ||
| Patients hospitalised for less than 10 days | 8.179 (2.094−14.263) | 0.009* | 4.971 (−1.07−11.012) | 0.106 |
| Patients hospitalised for more than 10 days | 10.25 (4.166−16.334) | 0.001* | 5.119 (−1.205−11.442) | 0.112 |
| Admission in intensive care unit | 11.971 (5.902−18.04) | < 0.001* | 7.814 (1.046−14.583) | 0.024* |
| Changes in PMA | 0.936 (0.333−1.54) | 0.003* | – | – |
| Changes in PMI | 2.563 (0.935−4.191) | 0.002* | 2.199 (0.619−3.778) | 0.007* |
PMA, pectoralis muscle area; CT-SS, CT severity score; PMI, pectoralis muscle index.
Linear regression analysis.
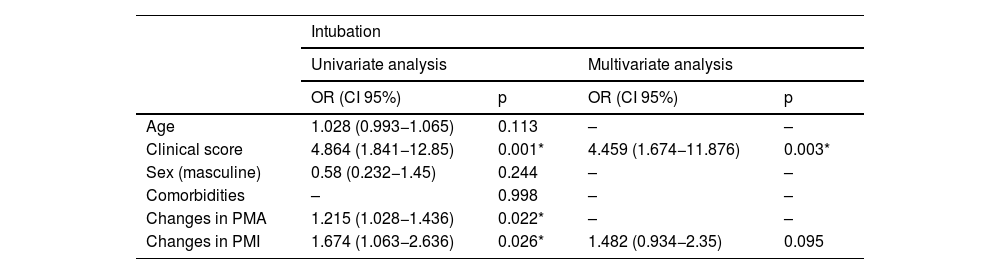
The univariate assessments demonstrated that the clinical score and values of PMA and PMI change were significantly associated with intubation (p < 0.05). These variants were included in the multivariate analysis. The model obtained was considered statistically significant (χ2 = 16.751; p < 0.001). The clinical score was found to be significant in the model. When the clinical score increased by one unit, intubation increased by 4.459 (OR: 4.459; CI 95%: 1.674−11.876; p = 0.003) (Table 4).
Results of univariate and multivariate analysis of factors affecting intubation.
| Intubation | ||||
|---|---|---|---|---|
| Univariate analysis | Multivariate analysis | |||
| OR (CI 95%) | p | OR (CI 95%) | p | |
| Age | 1.028 (0.993−1.065) | 0.113 | – | – |
| Clinical score | 4.864 (1.841−12.85) | 0.001* | 4.459 (1.674−11.876) | 0.003* |
| Sex (masculine) | 0.58 (0.232−1.45) | 0.244 | – | – |
| Comorbidities | – | 0.998 | – | – |
| Changes in PMA | 1.215 (1.028−1.436) | 0.022* | – | – |
| Changes in PMI | 1.674 (1.063−2.636) | 0.026* | 1.482 (0.934−2.35) | 0.095 |
PMA, pectoralis muscle area; PMI, pectoralis muscle index.
Logistic regression analysis.
Univariate logistic regression analyses were performed to determine factors affecting mortality. Multivariate analysis was not performed because only the clinical score was found to be significant in the univariate assessments. The model obtained for the clinical score was considered statistically significant (χ2 = 14.505; p < 0.001). When the clinical score increased by one unit, the risk of mortality increased by 7.114 (OR: 7.114; 95% CI: 2.053–24.654; p = 0.002).
DiscussionIn our study, when we compared the PMA and PMI measurements obtained from the first and follow-up CT scans of patients diagnosed with COVID-19, we observed a statistically significant decrease in the values as the disease progressed.
While sarcopenia lasting less than six months is considered acute, sarcopenia persisting beyond six months is considered chronic.2,12 The lack of muscle may increase the need for physiotherapy and affect the length of hospital stay.13 A rapid loss of muscle mass and function must be demonstrated in order to confirm the diagnosis of acute sarcopenia. Muscle measurements should be taken in the early stages of the disease before it progresses.3 CT is considered the preferred method for measuring muscle areas.14 One study demonstrated that PMA measurement by means of a single axial slice on chest CT images is associated with spirometric measurements related to chronic obstructive pulmonary disease.15 Another study showed that PMA is positively correlated with skeletal muscle mass in the body regardless of sex, weight or age. These results show that single-slice PMA measurements are indicators that could be used to gauge the skeletal muscle mass of the population at large.8 The results of our study indicate that there is a loss of PMA in the acute post-COVID-19 process among our study population. In a study of adult patients with COVID-19, pneumonia severity score, PMA and PMI have been associated with certain negative disease-related outcomes.10 From the assessments conducted to determine the factors affecting CT-SS, our study showed that age, clinical score, comorbidities, hospitalisation, and the change in PMA and PMI values between the two CT images had a significant effect on CT-SS.
There is as yet no precise knowledge of the mechanical effects of COVID-19 on skeletal muscle.16 It is understood that people who have recovered from COVID-19 are at increased risk of muscle loss and acute sarcopenia.13,17
Between a quarter and half of symptomatic patients with COVID-19 experience myalgia and fatigue.16 SARS-CoV-2 enters cells via the angiotensin-converting enzyme 2 (ACE2) receptor using the transmembrane protease serine 2 (TMPRSS2). After binding to the receptor, the viral envelope fuses with the cell membrane, and the genetic material of the virus enters the cell.7,16,18 ACE2 receptors are found throughout the body and therefore damage can occur in various tissues. Myalgia and muscle wasting can be partially explained by the presence of the ACE2 receptor in muscle.7 Some data indicate that muscle pain does not increase as COVID-19 intensifies.19 However, other studies suggest that myalgia is an important predictor of overall disease severity in patients with abnormal CT and chest X-ray findings.20
Myalgia and muscle dysfunction have been widely observed in patients with SARS infection. This condition demonstrates there is a decrease in muscle strength and endurance due to the pro-inflammatory effects of the possible viral infection.16 In patients with COVID-19 and hypoalbuminaemia, a number of inflammatory cytokines increase including C-reactive protein, tumour necrosis factor alpha (TNF-α) and interleukin (IL). The cytokine response has a negative impact on muscle protein synthesis.4,13 Interferon gamma (IFN-γ), IL-1 beta, IL-6, IL-17 and TNF-α can induce muscle fibre proteolysis.16 As cells age, cell proliferation stops and high amounts of inflammatory cytokines are secreted. Consequently, inflammation and the effects of acute diseases may intensify with age.13
Anorexia is associated with COVID-19. The anosmia and ageusia that arise from COVID-19 are among its causes. Anorexia can also occur as a result of elevated levels of inflammatory cytokines.7
Demyelination of neurons has been observed in patients with SARS infection, which may also contribute to muscle weakness and fatigue. In addition, many patients with SARS infection have been given corticosteroids to limit acute inflammation, and these drugs can directly cause muscle atrophy.16
In our study, we found no statistical significance between the PMA and PMI values detected in the two CT images and age, clinical scores, gender, comorbidities, time elapsed between the first CT scan and the follow-up CT scan, hospitalisation or mortality. This suggests that the infection affects the decrease in muscle area as an independent factor.
Reduced muscle function in patients with COVID-19 is more evident in those who have received intensive care. This may be related to the extended period of bed rest and muscle relaxants used for prolonged prone positioning.21,22 Another reason for muscle loss and weakness in COVID-19 is the immobility of patients on mechanical ventilation in ICU.23 Sarcopenia is thought to be associated with a decrease in diaphragm muscle thickness.24 Sudden decreases in diaphragm muscle thickness in hospitalised patients can lead to dyspnoea, which in turn may prolong the need for mechanical ventilation in hospitalised patients.25 Our study showed that intubation had a significant influence on the decrease in PMA and PMI values, which leads us to suggest that intubation may contribute to the loss of muscle area.
Giraudo et al.26 conducted a retrospective study in which they measured paravertebral muscle values in HU on chest CT images that were obtained during the first three weeks of hospitalisation for patients with COVID-19. In their published results, they concluded that muscle loss in patients with COVID-19 could be an indication of ICU admission. In the Attaway et al. study,27 PMA, the erector spinae and the percentage change normalised to 30 days in cross-sectional muscle areas of patients with COVID-19 were compared to those observed in patients without COVID-19. This study reported acute sarcopenia, determined by decreased PMA and erector spinae muscle area, in patients with COVID-19, and these findings were associated with poor outcomes. The findings support the results obtained in our study.
Our study has certain limitations. Since we only included patients with COVID-19 whose CT images were obtained during the diagnosis process, it was not possible to evaluate patients who had not required a CT scan for clinical reasons on their first visit. As there was no information concerning ageusia, loss of appetite, myalgia or muscle symptoms in the patients' medical records, it was not possible to evaluate and compare these symptoms. In addition, there were no records regarding the blood levels of inflammatory cytokines for some patients so we could not study the effects of the inflammatory cytokine response in muscle. This method is not routine practice in many centres and exposes participants to additional radiation risk. Our study was retrospective and no additional radiation exposure was necessary. Due to the retrospective design of our study, the statistical strength of the analyses is relatively weak. The time interval between the two CT scans was variable in our study. There could also be a selection bias, as it is not the same to have a CT scan performed four or six months later.
ConclusionsIn conclusion, COVID-19 causes a decrease in PMA and PMI, pectoralis muscle measurements, and skeletal muscle atrophy. There is a significant link between this negative effect and patients being intubated. As PMA and PMI values can be measured in patients with chest CT scans without the need for additional imaging, they could help assess disease progression.
FundingThis research has not received funding support from any centre or organisation.
Author contributions- 1
Research coordinators: YA, SOG, ESG, BH, IS.
- 2
Development of study concept: AY, SOG.
- 3
Study design: AY, SOG, ESG.
- 4
Data collection: AY, ESG.
- 5
Data analysis and interpretation: AY, SOG.
- 6
Data processing: AY, SOG, ESG.
- 7
Literature search: AY, SOG, ESG, BH, IS.
- 8
Writing of article: AY, SOG, ESG, BH, IS.
- 9
Critical review of the manuscript with intellectually relevant contributions: BH, IS.
- 10
Approval of final version: AY, SOG, ESG, BH, IS.
The authors declare that they have no conflicts of interest.

