


We aimed to analyze the relationship between the initial chest X-ray findings in patients with severe acute respiratory syndrome due to infection with SARS-CoV-2 and eventual clinical worsening and to compare three systems of quantifying these findings.
Material and methodsThis retrospective study reviewed the clinical and radiological evolution of 265 adult patients with COVID-19 attended at our center between March 2020 and April 2020. We recorded data related to patients’ comorbidities, hospital stay, and clinical worsening (admission to the ICU, intubation, and death). We used three scoring systems taking into consideration 6 or 8 lung fields (designated 6A, 6B, and 8) to quantify lung involvement in each patient’s initial pathological chest X-ray and to classify its severity as mild, moderate, or severe, and we compared these three systems. We also recorded the presence of alveolar opacities and linear opacities (fundamentally linear atelectasis) in the first chest X-ray with pathologic findings.
ResultsIn the χ2 analysis, moderate or severe involvement in the three classification systems correlated with hospital admission (P = .009 in 6A, P = .001 in 6B, and P = .001 in 8) and with death (P = .02 in 6A, P = .01 in 6B, and P = .006 in 8). In the regression analysis, the most significant associations were 6B with alveolar involvement (OR 2.3; 95%CI 1.1.–4.7; P = .025;) and 8 with alveolar involvement (OR 2.07; 95% CI 1.01.–4.25; P = .046). No differences were observed in the ability of the three systems to predict clinical worsening by classifications of involvement in chest X-rays as moderate or severe.
ConclusionModerate/severe extension in the three chest X-ray scoring systems evaluating the extent of involvement over 6 or 8 lung fields and the finding of alveolar opacities in the first pathologic X-ray correlated with mortality and the rate of hospitalization in the patients studied. No significant difference was found in the predictive ability of the three classification systems proposed.
El propósito de este estudio en 265 pacientes con síndrome respiratorio agudo severo por coronavirus 2 (SARS-CoV-2) es establecer una relación entre la cuantificación inicial de los hallazgos en la radiografía de tórax en pacientes con COVID-19 y un eventual empeoramiento clínico, así como comparar tres sistemas de cuantificación que se proponen.
Material y métodosEn este estudio retrospectivo se revisó la evolución clínica y radiológica de 265 pacientes adultos con infección por COVID-19 atendidos en nuestro centro entre marzo y abril de 2020, registrándose la presencia de comorbilidades, así como datos de estancia hospitalaria y empeoramiento clínico (ingreso en unidad de cuidados intensivos/intubación y fallecimiento). La afectación en la radiografía de tórax inicial patológica de cada paciente se cuantificó siguiendo tres sistemas de puntuación diferentes sobre 6 u 8 campos pulmonares (denominados 6 A, 6 B y 8) para determinar una afectación leve, moderada o grave y establecer comparación entre dichos sistemas. También se registró la presencia de opacidades alveolares y opacidades lineales (fundamentalmente atelectasia laminar) en la primera radiografía patológica.
ResultadosLa afectación moderada o grave en los tres sistemas de cuantificación (6 A, 6 B y 8) mostró correlación en el estudio de χ2 con la variable ingreso hospitalario (P = 0,009, 0,001, 0,001, respectivamente) y fallecimiento de los pacientes (P = 0,02, 0,01, 0,006, respectivamente). El estudio de regresión mostró como más significativas las asociaciones 6 B + afectación alveolar [odds ratio (OR) 2,3, P = 0,025, intervalo de confianza (IC) al 95% 1,1–4,7) y clasificación 8 + afectación alveolar (OR 2,07, P = 0,046, IC 95% 1,01–4,25). La afectación moderada o grave en la radiografía de tórax no mostró diferencias significativas entre los tres sistemas de cuantificación en el estudio predictivo de empeoramiento clínico.
ConclusiónLa extensión moderada/grave en los tres sistemas de puntuación de la radiografía de tórax valorando la extensión de enfermedad sobre 6 y 8 campos pulmonares y la existencia de opacidades alveolares en la primera radiografía patológica se correlacionó con la mortalidad y la tasa de hospitalización en los pacientes estudiados. No se apreció una diferencia significativa en la capacidad predictiva de los tres sistemas de cuantificación propuestos.
The COVID-19 pandemic outbreak has caused a serious problem of saturation of health services in different countries.1 Until now, many publications have focused on computed tomography (CT) findings, clinical evolution and comparison with chest X-ray results.1–10 A correlation has also been established between chest CT and the RT-PCR (reverse transcription polymerase chain reaction) diagnostic test.10–12 Chest CT has high sensitivity for COVID-19, but false negative results have been reported.13–15 Although some authors have shown that chest X-ray clearly underestimates pulmonary involvement in the extension of the disease compared to CT, X-ray is the initial imaging technique for evaluating a respiratory tract infection.2,5,16–18 Under the recommendations of the Sociedad Española de Radiología Médica (SERAM) [Spanish Society of Medical Radiology],19 chest X-ray is indicated in acute respiratory symptoms in the pandemic context or in the event of worsening of previous pathologies or a situation of immunosuppression. On the other hand, the American College of Radiology (ACR) recommends that both chest X-ray and CT be used as weapons to support standard diagnostic tests, emphasising the usefulness of employing portable equipment in the outpatient setting and radiographic control in intensive care unit (ICU) patients.18,20 The Fleischner Society supports the usefulness of chest X-ray in the evaluation of hospitalised patients to assess complications and alternative diagnoses.21 At our centre, the COVID-19 Emergency Committee decided not to use CT as an initial diagnostic tool, but to use it pre-emptively in cases of clinical discordance, worsening or suspected pulmonary embolism. Routine management was therefore established with X-ray, both for the initial diagnostic evaluation and for follow-up.
The objective of this study is to evaluate whether the proposed radiological findings (presence of alveolar opacities and/or linear opacities) in the first pathological X-ray are related to the clinical evolution of patients with COVID-19 and to compare the three proposed quantification systems.
Material and methodsThis is a retrospective study conducted in a tertiary hospital. Initially, 300 adult patients admitted to our centre's emergency department with symptoms consistent with respiratory infection, and with a positive RT-PCR test and pathological chest X-ray performed between 15 March and 15 April 2020, were selected. The following exclusion criteria were applied: a single chest X-ray performed, previous interstitial disease or absence of clear infiltrates (total excluded patients: 35, final sample result: 265). From the selected patients, we obtained medical reports and collected data on the outcomes that we evaluated in this study: need for and length of hospitalisation, admission to the ICU, orotracheal intubation, or death. The time between the onset of symptoms and the first pathological radiological examination was also evaluated, as well as the length of hospitalisation and the presence of cardiovascular risk factors and previous respiratory disease. Other relevant clinical history was recorded (obesity when it was registered and history of oncological disease and organ transplantation). This study was approved by the hospital's ethics committee.
Chest X-rays were performed with emergency department and portable equipment (XR Definium 8000 GE Healthcare, Mobilett XP Siemens Healthcare) using posteroanterior, lateral and anteroposterior projections (seated or supine patients), reviewed by two chest radiologists (D.P.F. and I.R.C.) with 13 and 9 years of experience, respectively, in thoracic imaging (without knowledge of the radiological report, although they did have knowledge of the positive RT-PCR test). The severity of the radiological picture and the worsening in subsequent radiological examinations were evaluated. The borderline cases were evaluated by a third chest radiologist (V.C.R., 13 years of experience) to reach a consensus, in cases of disagreement both in the presence/absence of opacities and in their gradation. The data included in the study were those of the consensus reached.
To evaluate the extension of lung involvement in the chest X-ray, we used three different systems, classifying the extension in the parenchyma as mild, moderate or severe.
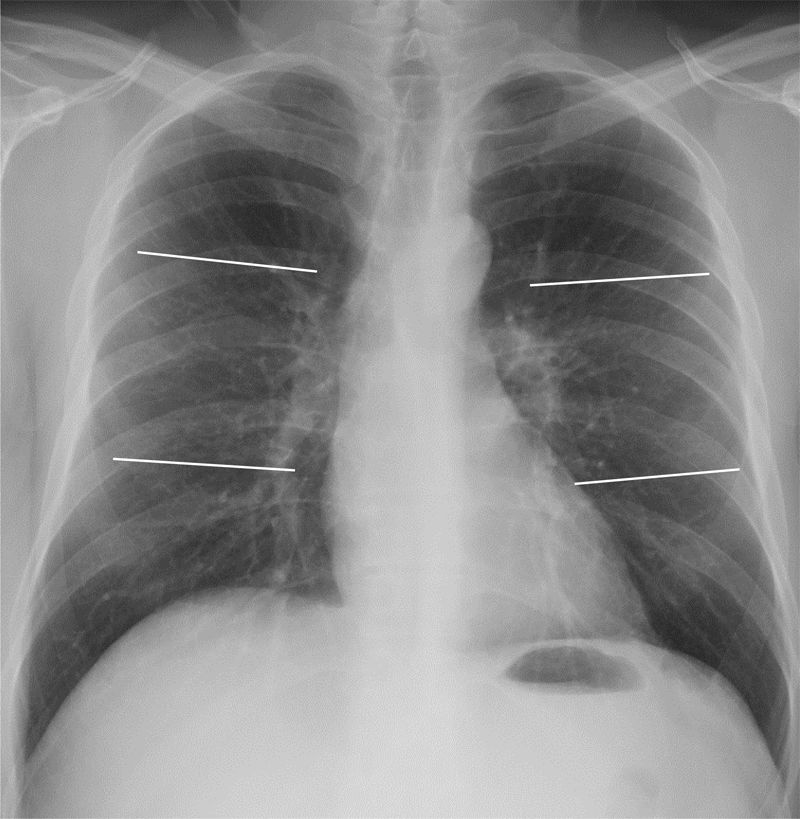
The first quantification system (6A) consisted of dividing each lung into three fields: upper, middle and lower (Fig. 1). According to this division, the extension of pulmonary opacities was classified as mild if only one field was affected, moderate if there were opacities in 2–3 lung fields, and severe if more than 3 fields were affected.
 by two horizontal lines: upper lung field (from vertices to lower margin of the aortic knob), middle (lower margin of aortic knob to the middle third of heart border) and lower (middle third of heart border to costophrenic sinuses).")
Posteroanterior chest X-ray demonstrating division into 6 lung fields (quantification systems 6A and 6B) by two horizontal lines: upper lung field (from vertices to lower margin of the aortic knob), middle (lower margin of aortic knob to the middle third of heart border) and lower (middle third of heart border to costophrenic sinuses).
The second quantification system (6B) divided both lungs into the same six lung fields as 6A. In this case, mild extension corresponded to 1 or 2 affected lung fields, moderate extension to 3–4 fields and severe extension to 5 or more fields.
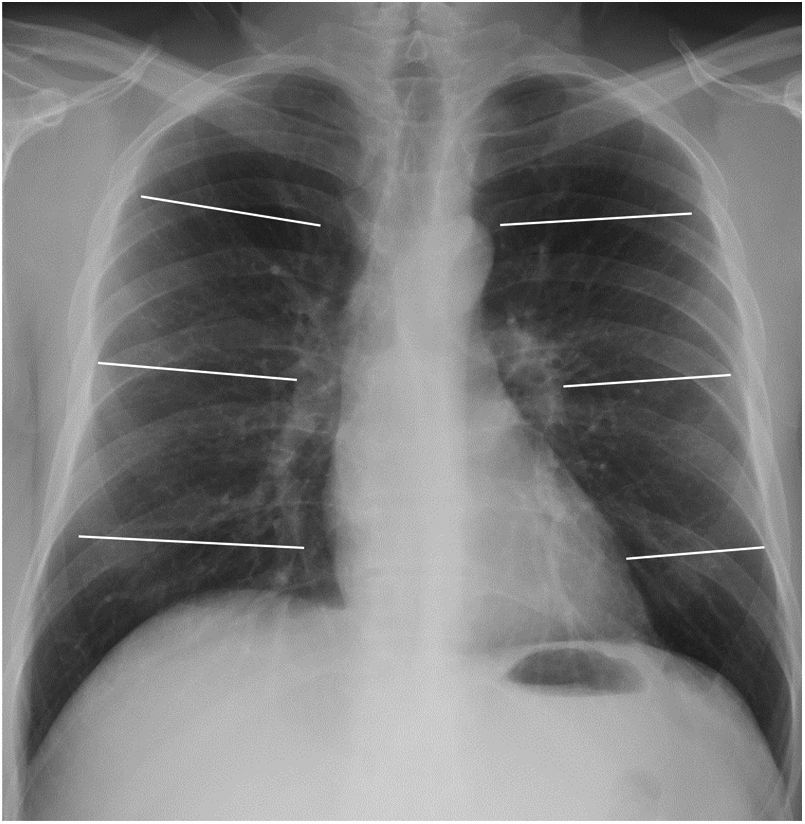
Finally, a third quantification system (8) divided both lungs into 8 lung fields, as reflected in Fig. 2. The involvement of 1–3 fields implied a mild degree; this was deemed moderate when 4–6 fields were involved, and severe if 7 or 8 fields were affected.
. Upper pulmonary field (from vertices to the upper border of the aortic knob), mid-hilar pulmonary field (from aortic knob to hila), mid-paracardiac pulmonary field (from hila to lower third of the cardiac silhouette), lower pulmonary field (from lower third of cardiac silhouette to costophrenic sinuses).")
Posteroanterior chest X-ray demonstrating division into 8 lung fields by three horizontal lines (quantification system 8). Upper pulmonary field (from vertices to the upper border of the aortic knob), mid-hilar pulmonary field (from aortic knob to hila), mid-paracardiac pulmonary field (from hila to lower third of the cardiac silhouette), lower pulmonary field (from lower third of cardiac silhouette to costophrenic sinuses).
The need for ICU admission/intubation was considered clinical worsening, including those patients who died. In the period studied, ICU patients coincided with intubation. Both an increase in the number of affected fields and a percentage increase in pre-existing opacity in the visual examination were considered radiological worsening.
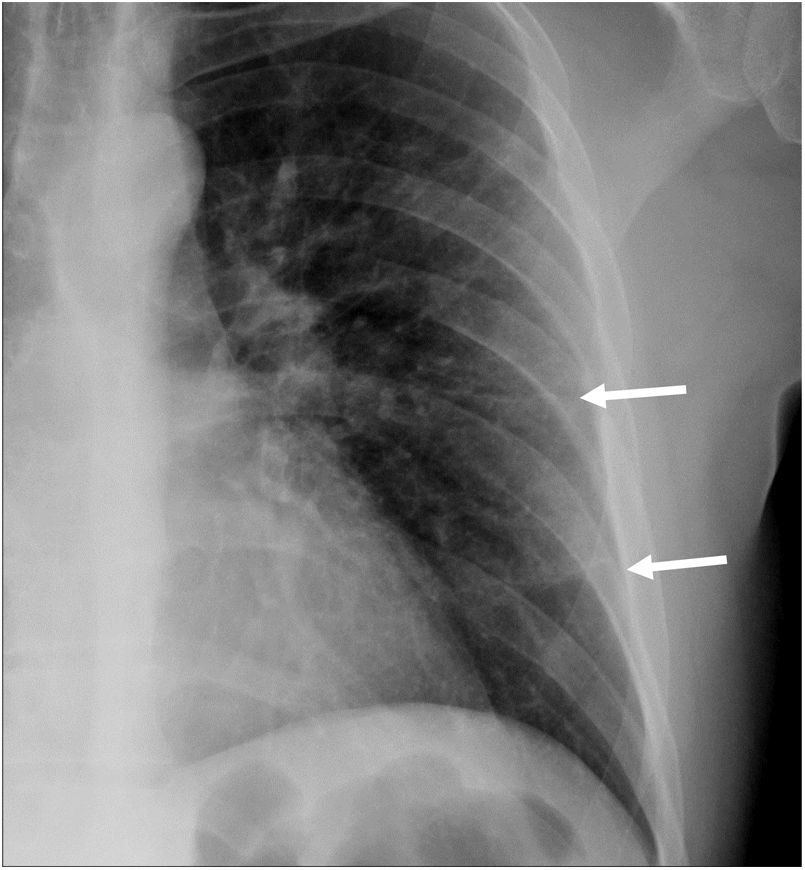
In addition to quantifying the extension of the radiological picture in the first pathological chest X-ray for each patient, different pathological findings were also assessed, such as the presence of alveolar involvement and linear opacities (especially the presence of lamellar atelectasis; Fig. 3).
.")
The program Stata v16 was used. StataCorp. 2019 (Stata Statistical Software: Release 16. College Station, TX: StataCorp LLC). The interobserver agreement was calculated with the percentage of correlation and Cohen's kappa coefficient for the detection of both the presence of radiological patterns (linear opacities and alveolar involvement) and for the association between clinical and radiological worsening.
The correlation between the clinical worsening parameters and the radiological data/severity classification was calculated according to Pearson's χ2 test and Fischer's exact test. The cut-off point in the three quantification systems included moderate and severe signs (≥2/6 fields in 6A, ≥3/6 in 6B and ≥4/8 in 8). The logistic regression analysis was obtained using Akaike Information Criterion (AIC), Bayesian Information Criterion (BIC) and AUC (area under the ROC curve) values, in order to obtain different associations. Along with these analyses, odds ratio values, p values, and 95% confidence interval (CI) were also obtained.
ResultsA total of 265 patients with infection by COVID-19 [184 men (69.4%); 81 women (30.5%)] were included. Average age, 62.6; median, 64; interquartile range (IQR), 19 (range 28–97 years).
Regarding risk factors, 35% of the patients had hypertension, 18% had dyslipidaemia, 5.5% had diabetes, 2.6% had a history of ischaemic heart disease, and 4.5% had a history of smoking. Pulmonary disease was also recorded, with 8% having history of asthma, 3.7% chronic obstructive pulmonary disease (COPD) and 3.7% obstructive sleep apnoea syndrome (OSAS).
Of the 265 patients studied, 244 (92%) corresponded to the number of hospital admissions. Thirty-four patients (12.8%) were admitted to the ICU, a figure that corresponds to 13.9% of the patients admitted (also coinciding with the number of intubations), and 17 patients (6.4%) died. The mean number of days in hospital was 11.8 (0–47).
The male patients in our group had a higher rate of hospitalisation (95% vs. 85%) and mortality (8.15% vs. 2.4%), with no significant differences in ICU admission (13% vs. 12%). Ischaemic heart disease was found in 42.8% of the patients admitted to the ICU and in 14.3% of those who died. The percentage of patients admitted to the ICU and/or deaths corresponded to a total of 47 patients (17.7%).
The mean number of days between the onset of symptoms and the first pathological chest X-ray was 7.2 (median 7) and between the first and second chest X-rays examined in each patient it was 4 days [median 3, (range 0–22)]. Fourteen patients (5.2%) had a previous normal chest X-ray (the mean number of days before the first pathological X-ray was 5 and the median was 4).
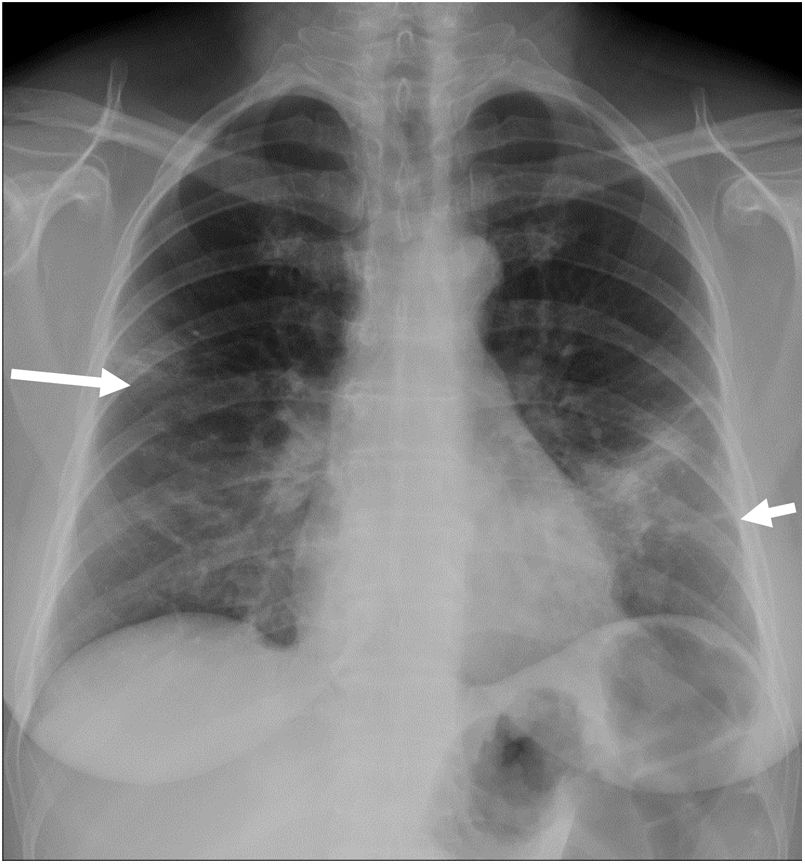
An alveolar pattern was found in 22.3% of the initial X-rays (Fig. 4), linear opacities (mainly lamellar atelectasis) in 47.2%, and both findings in 9.8% of the cases. The interobserver agreement regarding linear opacities corresponded to kappa = 0.798 and 90.3% correlation. Regarding alveolar involvement, it was found to be kappa = 0.943 and 98.86% correlation (Table 1).
, a focal consolidation in the midfield/left base, and a linear opacity in the left base (short arrow). Quantification: 4/6 fields and 5/8 fields, corresponding to severe involvement in system 6A, moderate in system 6B and moderate in system 8.")
55-year-old woman with COVID-19 infection. The posteroanterior chest X-ray shows a peripheral focal opacity in the right midfield (arrow), a focal consolidation in the midfield/left base, and a linear opacity in the left base (short arrow). Quantification: 4/6 fields and 5/8 fields, corresponding to severe involvement in system 6A, moderate in system 6B and moderate in system 8.
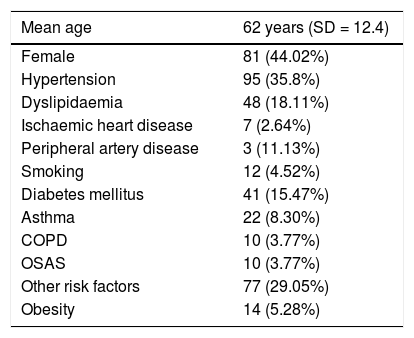
Distribution by age, sex and underlying disease (n = 265).
| Mean age | 62 years (SD = 12.4) |
|---|---|
| Female | 81 (44.02%) |
| Hypertension | 95 (35.8%) |
| Dyslipidaemia | 48 (18.11%) |
| Ischaemic heart disease | 7 (2.64%) |
| Peripheral artery disease | 3 (11.13%) |
| Smoking | 12 (4.52%) |
| Diabetes mellitus | 41 (15.47%) |
| Asthma | 22 (8.30%) |
| COPD | 10 (3.77%) |
| OSAS | 10 (3.77%) |
| Other risk factors | 77 (29.05%) |
| Obesity | 14 (5.28%) |
COPD: chronic obstructive pulmonary disease; OSAS: obstructive sleep apnoea syndrome.
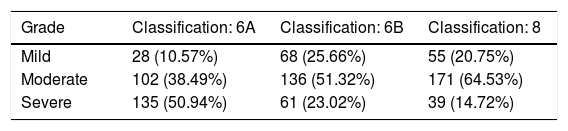
In X-ray quantification, moderate and severe involvement was present in 89.4% of the patients in classification 6A, 74.3% in classification 6B, and 79.2% in the 8-field classification (Table 2; Fig. 5).
Quantification of the radiological findings of the chest X-ray according to the different grading systems used (n = 265).
| Grade | Classification: 6A | Classification: 6B | Classification: 8 |
|---|---|---|---|
| Mild | 28 (10.57%) | 68 (25.66%) | 55 (20.75%) |
| Moderate | 102 (38.49%) | 136 (51.32%) | 171 (64.53%) |
| Severe | 135 (50.94%) | 61 (23.02%) | 39 (14.72%) |
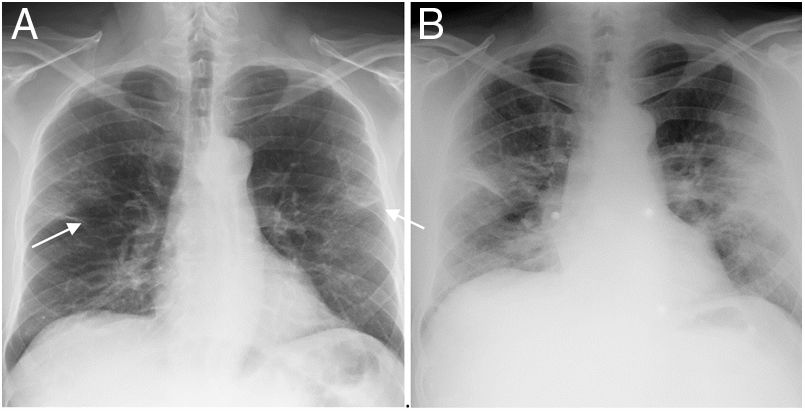
 Posteroanterior chest radiograph showing bilateral and linear alveolar opacities of peripheral distribution (arrows). The score is 3/6 fields and 4/8 fields, which correspond to moderate involvement in the three systems 6A, 6B and 8. B) The anteroposterior X-ray performed 72 h later shows a worsening of the radiological pattern with more extensive involvement and pulmonary consolidations. Quantification: 5/6 fields and 6/8 fields, corresponding to severe involvement in systems 6A and 6B, and moderate in system 8.")
48-year-old man with COVID-19-associated pneumonia. A) Posteroanterior chest radiograph showing bilateral and linear alveolar opacities of peripheral distribution (arrows). The score is 3/6 fields and 4/8 fields, which correspond to moderate involvement in the three systems 6A, 6B and 8. B) The anteroposterior X-ray performed 72 h later shows a worsening of the radiological pattern with more extensive involvement and pulmonary consolidations. Quantification: 5/6 fields and 6/8 fields, corresponding to severe involvement in systems 6A and 6B, and moderate in system 8.
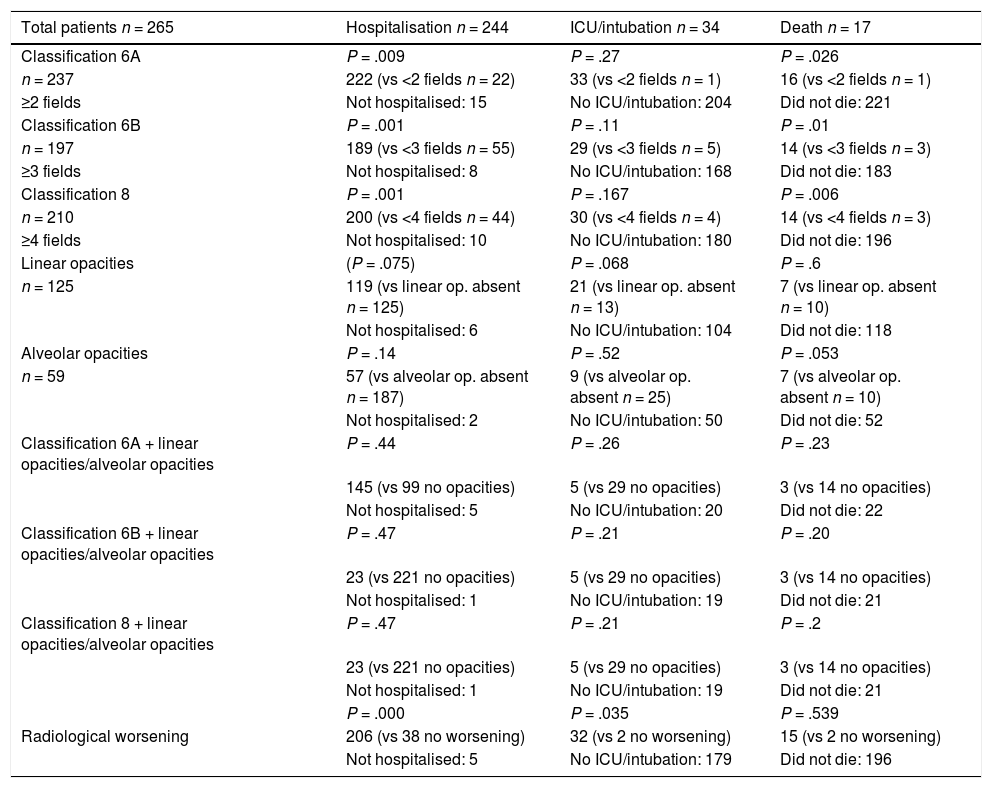
The univariate analysis with the Pearson test (Table 3) showed a better correlation between the picture of a moderate-severe chest X-ray and hospitalisation (P values of .009, .001 and .001 in classification 6A, 6B and 8, respectively) and the picture of a moderate-severe chest X-ray in 8-field classification in relation to death (P < .05). In the combination of radiological variables with the moderate-severe degree of quantification of the three systems, the P values were not significant.
Clinical course of patients according to extension and radiological findings.
| Total patients n = 265 | Hospitalisation n = 244 | ICU/intubation n = 34 | Death n = 17 |
|---|---|---|---|
| Classification 6A | P = .009 | P = .27 | P = .026 |
| n = 237 | 222 (vs <2 fields n = 22) | 33 (vs <2 fields n = 1) | 16 (vs <2 fields n = 1) |
| ≥2 fields | Not hospitalised: 15 | No ICU/intubation: 204 | Did not die: 221 |
| Classification 6B | P = .001 | P = .11 | P = .01 |
| n = 197 | 189 (vs <3 fields n = 55) | 29 (vs <3 fields n = 5) | 14 (vs <3 fields n = 3) |
| ≥3 fields | Not hospitalised: 8 | No ICU/intubation: 168 | Did not die: 183 |
| Classification 8 | P = .001 | P = .167 | P = .006 |
| n = 210 | 200 (vs <4 fields n = 44) | 30 (vs <4 fields n = 4) | 14 (vs <4 fields n = 3) |
| ≥4 fields | Not hospitalised: 10 | No ICU/intubation: 180 | Did not die: 196 |
| Linear opacities | (P = .075) | P = .068 | P = .6 |
| n = 125 | 119 (vs linear op. absent n = 125) | 21 (vs linear op. absent n = 13) | 7 (vs linear op. absent n = 10) |
| Not hospitalised: 6 | No ICU/intubation: 104 | Did not die: 118 | |
| Alveolar opacities | P = .14 | P = .52 | P = .053 |
| n = 59 | 57 (vs alveolar op. absent n = 187) | 9 (vs alveolar op. absent n = 25) | 7 (vs alveolar op. absent n = 10) |
| Not hospitalised: 2 | No ICU/intubation: 50 | Did not die: 52 | |
| Classification 6A + linear opacities/alveolar opacities | P = .44 | P = .26 | P = .23 |
| 145 (vs 99 no opacities) | 5 (vs 29 no opacities) | 3 (vs 14 no opacities) | |
| Not hospitalised: 5 | No ICU/intubation: 20 | Did not die: 22 | |
| Classification 6B + linear opacities/alveolar opacities | P = .47 | P = .21 | P = .20 |
| 23 (vs 221 no opacities) | 5 (vs 29 no opacities) | 3 (vs 14 no opacities) | |
| Not hospitalised: 1 | No ICU/intubation: 19 | Did not die: 21 | |
| Classification 8 + linear opacities/alveolar opacities | P = .47 | P = .21 | P = .2 |
| 23 (vs 221 no opacities) | 5 (vs 29 no opacities) | 3 (vs 14 no opacities) | |
| Not hospitalised: 1 | No ICU/intubation: 19 | Did not die: 21 | |
| P = .000 | P = .035 | P = .539 | |
| Radiological worsening | 206 (vs 38 no worsening) | 32 (vs 2 no worsening) | 15 (vs 2 no worsening) |
| Not hospitalised: 5 | No ICU/intubation: 179 | Did not die: 196 |
P values are shown in the χ2 test (Fisher's exact test for “radiological worsening”).
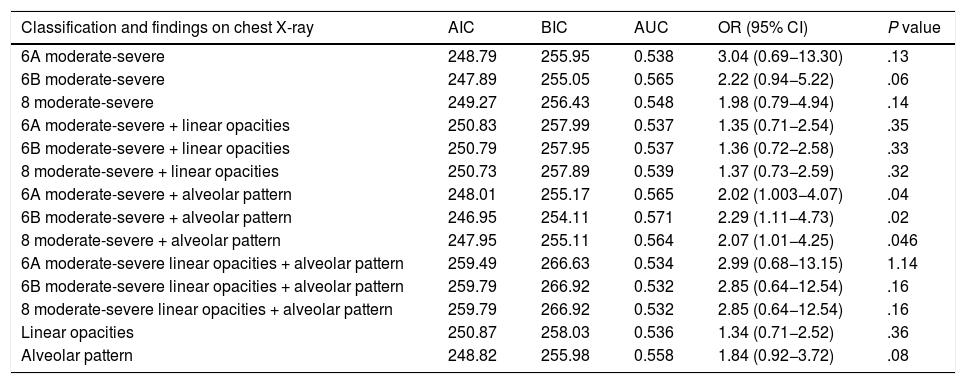
The evaluation by logistic regression of the three scoring systems (6A, 6B and 8 in their moderate and severe involvement) in each patient and the presence of alveolar pattern and linear opacities shows the combination of the 6B + alveolar pattern classification (OR 2.3, P = .025, 95% CI 1.1–4.7) and classification 8 + alveolar pattern (OR 2.07, P = .046, 95% CI 1.01−4.25) (Table 4) as the most significant values, always considering moderate-severe involvement in each scoring system. The presence of linear opacities on the first chest X-ray was common, but without a clear significance in the clinical worsening, alone or in combination with the 6B classification (OR 1.36; 95% CI 0.72−2.58; Table 4). The AUC (area under the ROC curve) values were low, less than 0.7.
Relationship between clinical worsening and graduation of radiological findings in the different quantification systems used.
| Classification and findings on chest X-ray | AIC | BIC | AUC | OR (95% CI) | P value |
|---|---|---|---|---|---|
| 6A moderate-severe | 248.79 | 255.95 | 0.538 | 3.04 (0.69−13.30) | .13 |
| 6B moderate-severe | 247.89 | 255.05 | 0.565 | 2.22 (0.94−5.22) | .06 |
| 8 moderate-severe | 249.27 | 256.43 | 0.548 | 1.98 (0.79−4.94) | .14 |
| 6A moderate-severe + linear opacities | 250.83 | 257.99 | 0.537 | 1.35 (0.71−2.54) | .35 |
| 6B moderate-severe + linear opacities | 250.79 | 257.95 | 0.537 | 1.36 (0.72−2.58) | .33 |
| 8 moderate-severe + linear opacities | 250.73 | 257.89 | 0.539 | 1.37 (0.73−2.59) | .32 |
| 6A moderate-severe + alveolar pattern | 248.01 | 255.17 | 0.565 | 2.02 (1.003−4.07) | .04 |
| 6B moderate-severe + alveolar pattern | 246.95 | 254.11 | 0.571 | 2.29 (1.11−4.73) | .02 |
| 8 moderate-severe + alveolar pattern | 247.95 | 255.11 | 0.564 | 2.07 (1.01−4.25) | .046 |
| 6A moderate-severe linear opacities + alveolar pattern | 259.49 | 266.63 | 0.534 | 2.99 (0.68−13.15) | 1.14 |
| 6B moderate-severe linear opacities + alveolar pattern | 259.79 | 266.92 | 0.532 | 2.85 (0.64−12.54) | .16 |
| 8 moderate-severe linear opacities + alveolar pattern | 259.79 | 266.92 | 0.532 | 2.85 (0.64−12.54) | .16 |
| Linear opacities | 250.87 | 258.03 | 0.536 | 1.34 (0.71−2.52) | .36 |
| Alveolar pattern | 248.82 | 255.98 | 0.558 | 1.84 (0.92−3.72) | .08 |
Logistic regression study.
AIC: Akaike's information criteria; AUC: area under the ROC curve; BIC: Bayesian information criterion; OR: odds ratio.
95% CI confidence interval and P value are included.
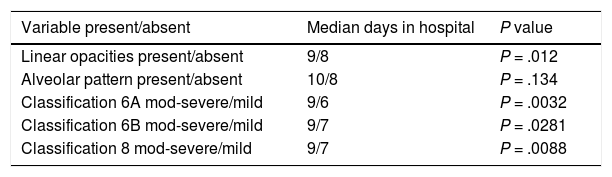
Radiological worsening was found in 80.53% of the patients, mainly in those with moderate involvement (84% in classification 6A, 85% in classification 6B and 85.4% in the 8-field classification) and patients with radiological deterioration in the subsequent X-ray had higher rates of hospitalisation (206 patients with radiological deterioration admitted to the ward). Patients with mild or severe involvement showed a lower percentage of worsening. Thirty-four patients were admitted to the ICU, corresponding to 3.9% of the patients without radiological deterioration and 15.1% of the patients with radiological deterioration. A correlation study was established between radiological and clinical worsening using Cohen's kappa, this correlation being low (k = 0.013, 95% CI 0.0122−0.1007). Regarding hospitalisation time, the Wilcoxon-Mann-Whitney test was performed. For the different values of median hospital stay, the results of the moderate-severe 6A classification (P = .0032), the moderate-severe + linear opacities 6B classification (P = .0019), and the moderate-severe + linear opacities 8 classification (P = .0015) stand out over those of the 6B classification alone (P = .028) or 6B/8 + linear opacities + alveolar opacities (P = .17) (Table 5).
Mean hospital stay (days of hospitalisation) in relation to each radiographic quantification system and the presence/absence of radiological characteristics.
| Variable present/absent | Median days in hospital | P value |
|---|---|---|
| Linear opacities present/absent | 9/8 | P = .012 |
| Alveolar pattern present/absent | 10/8 | P = .134 |
| Classification 6A mod-severe/mild | 9/6 | P = .0032 |
| Classification 6B mod-severe/mild | 9/7 | P = .0281 |
| Classification 8 mod-severe/mild | 9/7 | P = .0088 |
| Combination of variables | Median days in hospital | P value |
|---|---|---|
| 6A mod-severe + linear opacities/mild + linear op. absent | 10/8 | P = .0041 |
| 6A mod-severe + alveolar pattern/mild + alveolar p. absent | 10/8 | P = .0947 |
| 6B mod-severe + linear opacities/mild + linear op. absent | 10/8 | P = .0019 |
| 6B mod-severe + alveolar pattern/mild + alveolar p. absent | 10/8 | P = .1237 |
| 8 mod-severe + linear opacities/mild + absent finding | 10/8 | P = .0015 |
| 8 mod-severe + alveolar pattern/mild + alveolar p. absent | 10/8 | P = .0805 |
P value in the Wilcoxon text.
Chest X-ray is the main radiological test performed in patients with SARS-CoV-2 infection at our centre, both for the initial/emergency study and for follow-up. Some previous publications, mainly by performing CT, have examined the evolution of parenchymal lesions.3,13,15 Compared to CT, chest X-ray has a lower sensitivity for COVID-19 infection in cases of early or mild lung involvement and depends on such important issues as technical factors and the skill/experience of the chest/cardiothoracic radiologist and the radiology technician, so sensitivity and specificity will vary.2,5 Also the characteristics and condition of the patient contribute to the quality and interpretability of the image. At our centre, CT was used in cases of clinical discordance or unexpected worsening, the fundamental application being CT-angiography to rule out pulmonary thromboembolism as a complication of infection.
Age and sex appear to be predisposing factors for infection by COVID-19. In some studies, a greater correlation was found between clinical worsening and the extension of involvement on chest X-ray in older patients.22–24 The predominance of male patients and age over 55 years was the norm in hospital admission at our centre. The mean number of days between the onset of symptoms and the first pathological chest X-ray was 7 days and the mean number of days before the first pathological X-ray in the 14 patients with a normal initial chest X-ray was 5 days. These findings are consistent with what has been described in the specialised literature, which shows a greater number of pathological findings from the 6τη day after the onset of symptoms.22,25 Hui et al. demonstrated the validity of chest X-rays performed in that period to predict an increase in the need for oxygen and intubation.26
Regarding the analysis of the radiological image, the initial presence of alveolar opacities was infrequent (22.26%) and a relatively high frequency of linear opacities was observed (47.16%), which mainly represent lamellar atelectasis. Lamellar atelectasis is a common radiographic finding, classically described in hypoventilation situations, including pulmonary ischaemia.27 In this study, the intention was to relate the presence of linear opacities in the chest radiograph with clinical worsening, but no significant association was demonstrated in the statistical analysis (P = .06).
The three quantification systems that we present are quick to assess and only consider the extension of the involvement without quantifying degrees of opacification, or the type of interstitial, alveolar or mixed involvement. In the regression study for the degree of moderate/severe involvement (>1/6, >2/6 and >3/8 fields, respectively, in the 6A, 6B and 8 systems), the three systems presented a similar correlation with clinical worsening. This correlation slightly improved with the coexistence of alveolar involvement and/or linear opacities. We have preferred these extension quantification systems to some others, such as the RALE score proposed by Warren et al.20,28,29 or the modified RALE system.26 The RALE classification, applied to lung oedema, divides the chest X-ray into 4 quadrants and combines the extension of the involvement with density levels of pulmonary opacities. Both this classification and another that divides the X-ray into 12 lung fields30 seemed to us to be more complex to use for radiological evaluation at the initial moment of the pandemic. Several publications mention quantification with the Brixia system proposed by Borghesi et al.,23,24,31,32 based on the extension and type of radiological pattern. Comparisons between quantification systems have also been established.33 A recent study by Schalekamp et al. proposes a simple scoring system in 4 lung fields, quantifying pulmonary involvement as greater or less than 50%, obtaining a good correlation with mortality and ICU admission.34
In daily practice, the 6A classification tended to over-diagnose the disease from the clinical point of view, although it correlated better with the mean hospital stay (Table 3). The 6B scoring system was the preferred one in our radiological reports. A greater extension of lung involvement seems to predict a worse outcome in these patients, according to previous studies,2,24,35,36 and our study concurs with these results regarding mortality. Alveolar involvement as an isolated finding also showed a correlation with clinical worsening, also in terms of mortality in the group studied. This relationship between the severity of radiological findings and mortality had already been described by other authors.32,37
We have therefore obtained conclusions similar to those that have been reported with scoring systems such as the Brixia system, which combines the type of involvement with the degree of extension on the X-ray, with the difference being that the study we present assesses, on one hand, the extension in lung fields in the three systems compared and, on the other hand, the radiological findings.31,32 We have not studied the central, peripheral or diffuse distribution as a variable, as other authors have done, although we believe that the combination of various radiological variables may be interesting.34
Our study has a number of limitations. First, it is a retrospective study based on the first pathological chest X-ray of each patient. Many of these X-rays have subtle or questionable changes, and although each image was reviewed by two experienced chest radiologists, we are aware of the difficulties in interpretation, especially in the case of portable studies. Second, there is no evolutionary comparison with patients with COVID-19 and normal chest X-ray, since these patients were not included due to the study design. Third, the 265 patients included in this study constitute a limited population. It is desirable that other studies that consider chest X-ray can corroborate these findings and/or propose other predictive parameters. Fourth, we tried to optimise radiological semiology and did not include clinical prognostic markers for patients, an approach that may be the subject of other studies.
In conclusion, our study supports the use of quantification systems in 6/8 fields for chest X-ray reports in patients with co-morbidities with COVID-19. Moderate-severe involvement in the three quantification systems, as well as the presence of alveolar opacities, were related to mortality and may serve as an indicator of a worse clinical prognosis. The presence of linear opacities is very common in this entity and is weakly associated with clinical worsening.
Authorship- 1
Person responsible for the integrity of the study: DJPF.
- 2
Study conception: DJPF, JSME, YMR, JCFQ.
- 3
Study design: DJPF, JSME, YMR, JCFQ.
- 4
Data collection: DJPF, JSME, YMR, JCFQ.
- 5
Data analysis and interpretation: DJPF, JSME, YMR, JCFQ.
- 6
Statistical processing: DJPF, AR (Idiphim).
- 7
Literature search: DJPF, MIRC.
- 8
Drafting of the article: DJPF, MIRC, JSME, YMR, JCFQ, MVCR.
- 9
Critical review of the manuscript with intellectually significant contributions: DJPF, MIRC, JSME, YMR, JCFQ, MVCR.
- 10
Approval of the final version: DJPF, MIRC, MVCR.
This study received no specific grants from public agencies, the commercial sector or non-profit organisations.
Conflicts of interestThe authors declare that they have no conflicts of interest.
To the Internal Medicine, Anaesthesiology and Resuscitation, Intensive Care Unit and Pulmonology departments, for their collaboration and support. To the Emergency Department for their effort and dedication. Also to Ana Royuela, from Idiphim.
Please cite this article as: Petite Felipe DJ, Rivera Campos MI, San Miguel Espinosa J, Malo Rubio Y, Flores Quan JC, Cuartero Revilla MV. Hallazgos iniciales en la radiografía de tórax como predictores de empeoramiento en la infección pulmonar por SARS-CoV-2. Correlación en 265 pacientes. Radiología. 2021;63:324–333.

