


The pathological classification of hippocampal sclerosis is based on the loss of neurons in the substructures of the hippocampus. This study aimed to evaluate these substructures in patients with hippocampal sclerosis by magnetic resonance imaging and to compare the usefulness of this morphological analysis compared to that of volumetric analysis of the entire hippocampus.
Material and methodsWe included 25 controls and 25 patients with hippocampal sclerosis whose diagnosis was extracted from the institutional epilepsy board. We used FreeSurfer to process the studies and to obtain the volumetric data. We evaluated overall volume and volume by substructure: fimbria, subiculum, presubiculum, hippocampal sulcus, CA1, CA2–CA3, CA4, and dentate gyrus (DG). We considered p<0.05 statistically significant.
ResultsWe observed statistically significant decreases in the volume of the hippocampus ipsilateral to the epileptogenic focus in 19 (76.0%) of the 25 cases. With the exception of the hippocampal sulcus, we observed a decrease in all ipsilateral hippocampal substructures in patients with right hippocampal sclerosis (CA1, p=0.0223; CA2–CA3, p=0.0066; CA4–GD, p=0.0066; fimbria, p=0.0046; presubiculum, p=0.0087; subiculum, p=0.0017) and in those with left hippocampal sclerosis (CA1, p<0.0001; CA2–CA3, p<0.0001; CA4–GD, p<0.0001; fimbria, p=0.0183; presubiculum, p<0.0001; subiculum, p<0.0001). In four patients with left hippocampal sclerosis, none of the substructures had statistically significant alterations, although a trend toward atrophy was observed, mainly in CA2–CA3 and CA4–GD.
ConclusionThe findings suggest that it can be useful to assess the substructures of the hippocampus to improve the performance of diagnostic imaging in patients with hippocampal sclerosis.
Evaluar las subestructuras hipocampales utilizando resonancia magnética en pacientes con esclerosis hipocampal (EH), comparando los resultados con el análisis morfológico y la volumetría global del hipocampo.
MétodoSe incluyeron 25 controles y 25 pacientes con EH, cuyo diagnóstico fue extraído del informe de la junta institucional de epilepsia. Se utilizó FreeSurfer para el procesamiento de los estudios y la obtención de los datos volumétricos. El volumen fue valorado de manera global y por subestructura: fimbria, subiculum, presubiculum, fisura hipocampal, CA1, CA2-CA3, CA4 y giro dentado (GD). Se consideró p<0,05 como estadísticamente significativo.
ResultadosSe observó una disminución estadísticamente significativa en el hipocampo homolateral al foco epileptógeno en 19 de los 25 casos (76,0%). A excepción de la fisura hipocampal, se observó una disminución en todas las subestructuras hipocampales homolaterales en la EH derecha (CA1, p=0,0223; CA2–CA3, p=0,0066; CA4–GD, p=0,0066; fimbria, p=0,0046; presubiculum, p=0,0087; subiculum, p=0,0017) y la EH izquierda (CA1, p<0,0001; CA2–CA3, p<0,0001; CA4–GD, p<0,0001; fimbria, p=0,0183; presubiculum, p<0,0001; subiculum, p<0,0001). En cuatro casos de EH izquierda, ninguna de las subestructuras presentó alteración estadísticamente significativa; sin embargo, se observó una tendencia de atrofia, principalmente en CA2–CA3 y CA4–GD.
ConclusiónLos hallazgos sugieren la utilidad de la evaluación de las subestructuras hipocampales para mejorar el desempeño de la imagen en el diagnóstico de la EH.
Epilepsy is one of the most common neurological disorders and is characterized by involuntary movements, whether partial or generalized, that are sometimes accompanied by loss of consciousness and sphincter control. Back in 2013, the Pan-American Health Organization estimated that nearly 50 million people around the world suffer from epilepsy and that over 2 million new cases are diagnosed each year.1,2 Although the standard medical therapy for epilepsy is based on the administration of drugs to control the epileptic seizures, 30% of the cases are refractory to medical therapy, being surgery an alternative with healing results and minimal morbidity.3
Hippocampal sclerosis (HS) is the most common form of epilepsy of the temporal lobe and in the imaging diagnosis it is characterized by an alteration of signal intensity in the T2-weighted sequences and a reduced size of the affected hippocampi—findings that have been associated with neuronal loss, atrophy, and gliosis of such structures.4–9 Qualitative assessment through conventional magnetic resonance imaging (MRI) studies has shown low predictive values in the identification of hippocampal atrophy, being more critical in cases with head rotation, alteration of signal intensity, and mild or bilateral atrophy, and a high risk of false-negatives in qualitative assessments even for the most experienced professionals.10,11
Compared to qualitative analyses and other quantitative techniques such as spectroscopy and relaxometry, the quantitative assessments of the hippocampal volume have shown superior predictive values in the identification of unilateral and bilateral HS.6,9,10 Also, the reduced hippocampal volume in this condition has been associated with a reduced neuronal density, frequency, and duration of the seizures, with the postoperative prognosis, and with neuropsychological functions.12,13 However, outlining these structures manually requires time which is liable to inter- and intraobserver measurement error variability. It is for this reason that automatic methods for the assessment of brain volume were developed during the past decade, and their findings have been compared to manual techniques showing high rates of reliability, sensitivity, and reproducibility of information.14,15 For the last few years, complementary tools have been developed in order to conduct deeper segmentations of structures of great clinical and research interest such as hippocampal formation.
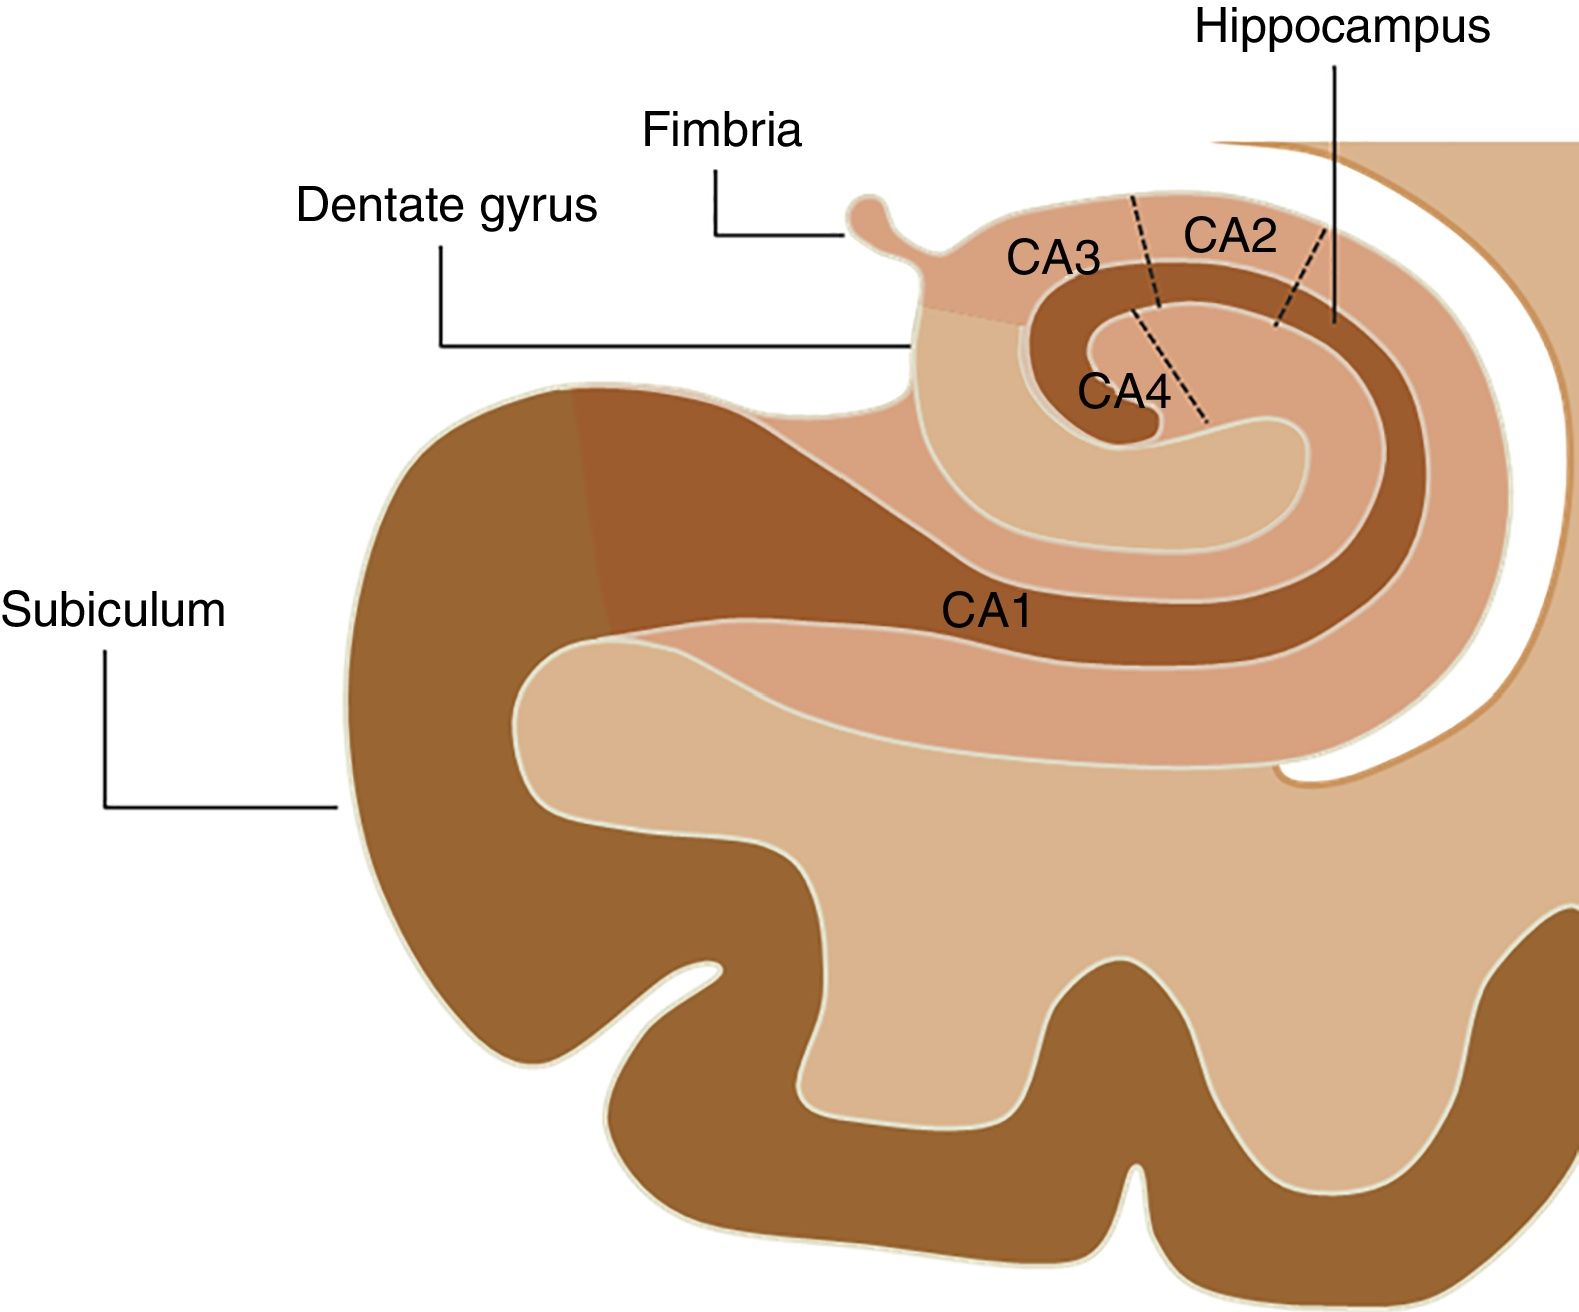
The hippocampal complex that is part of the so-called limbic system is made up of the temporal lobe allocortex and is found along the floor of the lateral ventricle forming an S. This complex is made up of the subiculum, the dentate gyrus (DG), the fimbria (origin of the fornix), and the hippocampus, which is, in turn, divided into four areas known as cornu ammonis (CA) (Fig. 1). The pathological classification of HS is based on the neuronal loss of such hippocampal structures, which in clinical–pathological studies has been associated with the duration of the disease and the patient's postoperative prognosis.16 On the other hand, numerous authors have studied changes in the hippocampal formation homolateral to the epileptogenic region using electroencephalograms, observing a progressive reduction both of the hippocampal volume and the focal concentration of N-acetylaspartate in patients diagnosed with HS,17–20 while Chan et al.21 showed that this atrophy does not occur uniformly, but originates at the DG and in the CA1, CA4 and, to a lesser extent, CA3 sections of the hippocampus. For this reason, the goal of this study is to conduct volumetric assessments of hippocampal structures in patients with HS using the FreeSurfer tool in MRIs and then compare the findings obtained with the morphological assessment and the overall volume of hippocampal formation.
Methods: CA1, CA2, CA3, and CA4.")
One retrospective analysis of the institutional database of patients diagnosed with refractory epilepsy studied using MRIs was conducted between the years 2014 and 2016. The analysis found 47 patients of which 25 were included with a diagnosis of HS (15 men and 10 women; average age: 36.16 years; age range: 18–59 years). The ultimate diagnosis was extracted from the final report agreed by the institutional epilepsy review board where patients are evaluated by one interdisciplinary team using neuroimaging studies, electroencephalographies or invasive monitoring, neuropsychological assessments, and where clinical symptomatology was studied. Both the studies and clinical data were obtained from the image transmission and storage system, and from the institution system of clinical history management. The control group (15 men and 10 women; average age: 35.59 years; age range: 19–59 years) was extracted from an institutional database on brain volumetry of healthy individuals using the propensity score matching technique so that there would not be any statistically significant differences on the sociodemographic level compared to the group of patients. This study was approved by the institutional ethics committee, and the informed consent from all subjects was collected prior to the study.
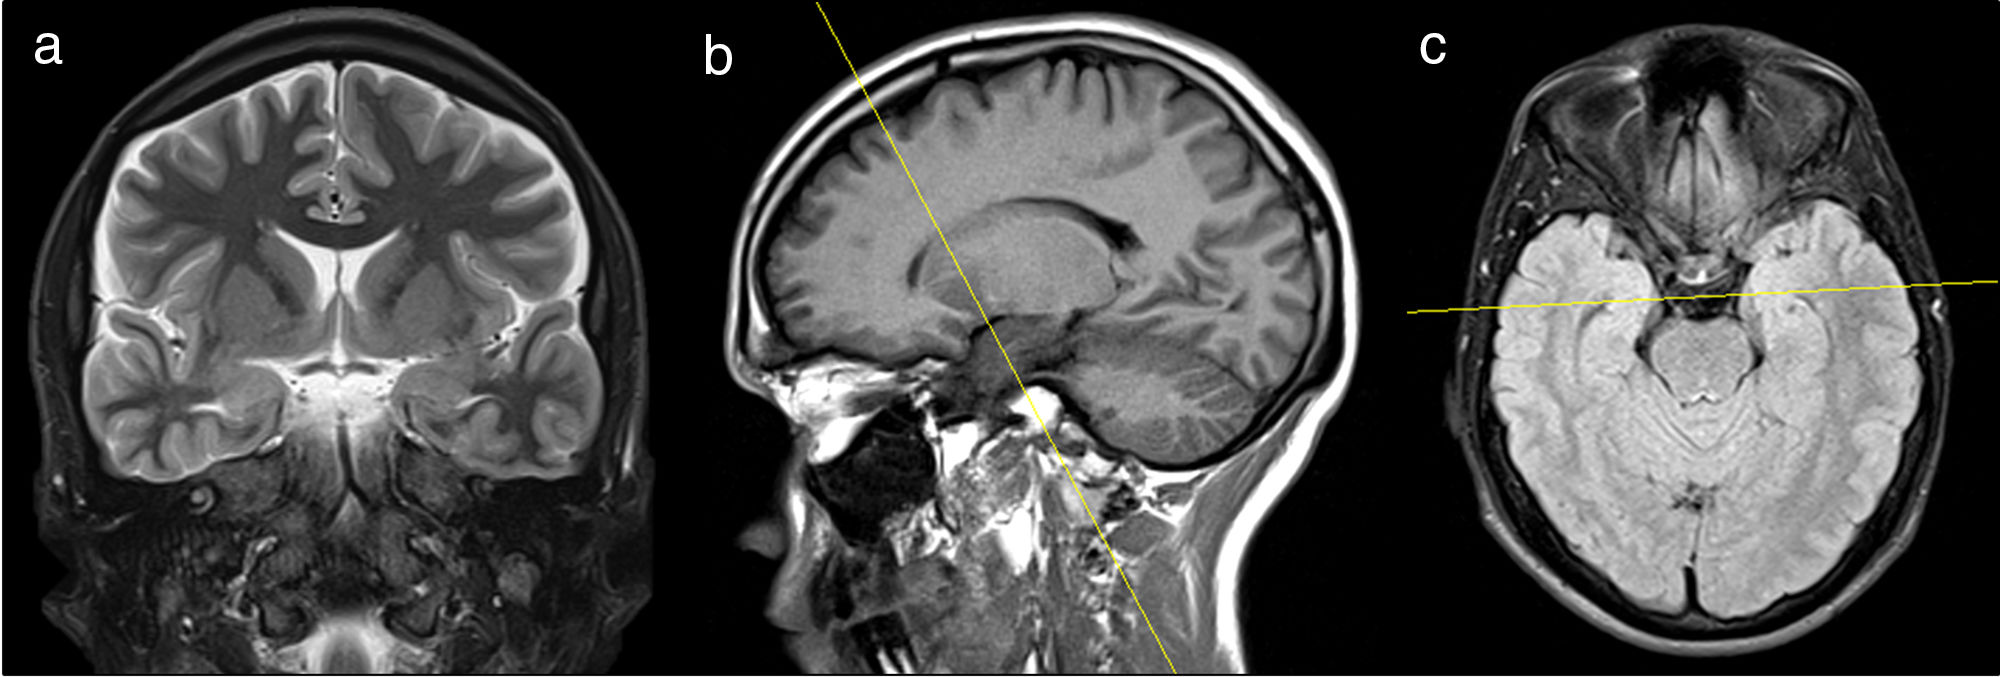
Acquisition protocolThe studies were conducted using one 1.5T MRI scanner (Siemens, Erlangen, Bavaria, Germany). Patients were placed in the supine position with immobilization of the patients’ heads in the antenna using pads. One T1-weighted volumetric acquisition was conducted from the vertex toward the posterior cranial fossa (FOV=256mm, TE=3.37ms, TR=1900ms, 15° angle, 1mm slice thickness, 1mm×1mm×1mm voxel size). T1-weighted sagittal slices using the inversion recovery technique (FOV=225mm, TE=7.10ms, TR=1290ms, 5mm slice thickness), plus T2-weighted axial slices using the inversion recovery technique (FOV=225mm, TE=8600ms, TR=7000ms, 5mm slice thickness) were performed and then used as reference images for the acquisition of the remaining institutional protocol for epilepsy (Fig. 2). Following this protocol, 24 coronal slices were acquired using T2-weighted turbo-spin-echo sequences (FOV=160mm, TE=92ms, TR=4250ms, 3.0mm slice thickness, 0.6×0.5×3.0mm3 voxel size) perpendicular to the hippocampus, from the knee toward the splenium of the corpus callosum, and 24 slices using T2-weighted sequences with fluid-attenuated inversion recovery (FOV=230mm, TE=86ms, TR=9000ms, 5mm slice thickness, 1.1×0.9×5.0mm3 voxel size) plus T2-weighted sequences with short tau inversion recovery (FOV=180mm, TE=71ms, TR=3070ms, 5mm slice thickness, 0.8×0.7×5.0mm3 voxel size), perpendicular to the temporal lobe from the anterior horn toward the posterior horn of lateral ventricles.
 acquired using, as a reference, sagittal images of T1-weighted sequences using the inversion recovery technique (b) and axial T2-weighted sequences using the inversion recovery technique in order to adjust the asymmetry of hippocampal structures (c).")
Coronal T2-weighted sequence with short tau inversion recovery (a) acquired using, as a reference, sagittal images of T1-weighted sequences using the inversion recovery technique (b) and axial T2-weighted sequences using the inversion recovery technique in order to adjust the asymmetry of hippocampal structures (c).
The cortical reconstruction and the volumetric segmentations were conducted using the imaging software package FreeSurfer v5.3.0 on an iMac computer with Intel Core i5 processor of up to 3.4GHz and 32GB of RAM memory and the OS X 10.9.5 operating system. FreeSurfer is a fully automatic tool that is well documented and freely available at http://surfer.nmr.mgh.harvard.edu/. The technical details of these procedures have already been described in several other studies already published.22–28 These processes include correcting the movement of the head, eliminating non-cerebral tissue, segmenting white matter, and the subcortical structures of gray matter—including hippocampi and amygdalae, normalizing the intensity, tessellation of the gray–white matter boundary, automatic topology correction, and surface deformation to determine the edges both between gray and white matter, and between gray matter and cerebrospinal fluid. Once the cortical models have been completed, a series of deformable procedures are performed for further analysis such as surface inflation, spherical atlas registration, parcellation of the cerebral cortex, and generation of different surface-based database including sulcal depth and curvature maps. The morphometric procedures used by the FreeSurfer tool have shown high reliability in different MRI machines and magnetic fields.29,30
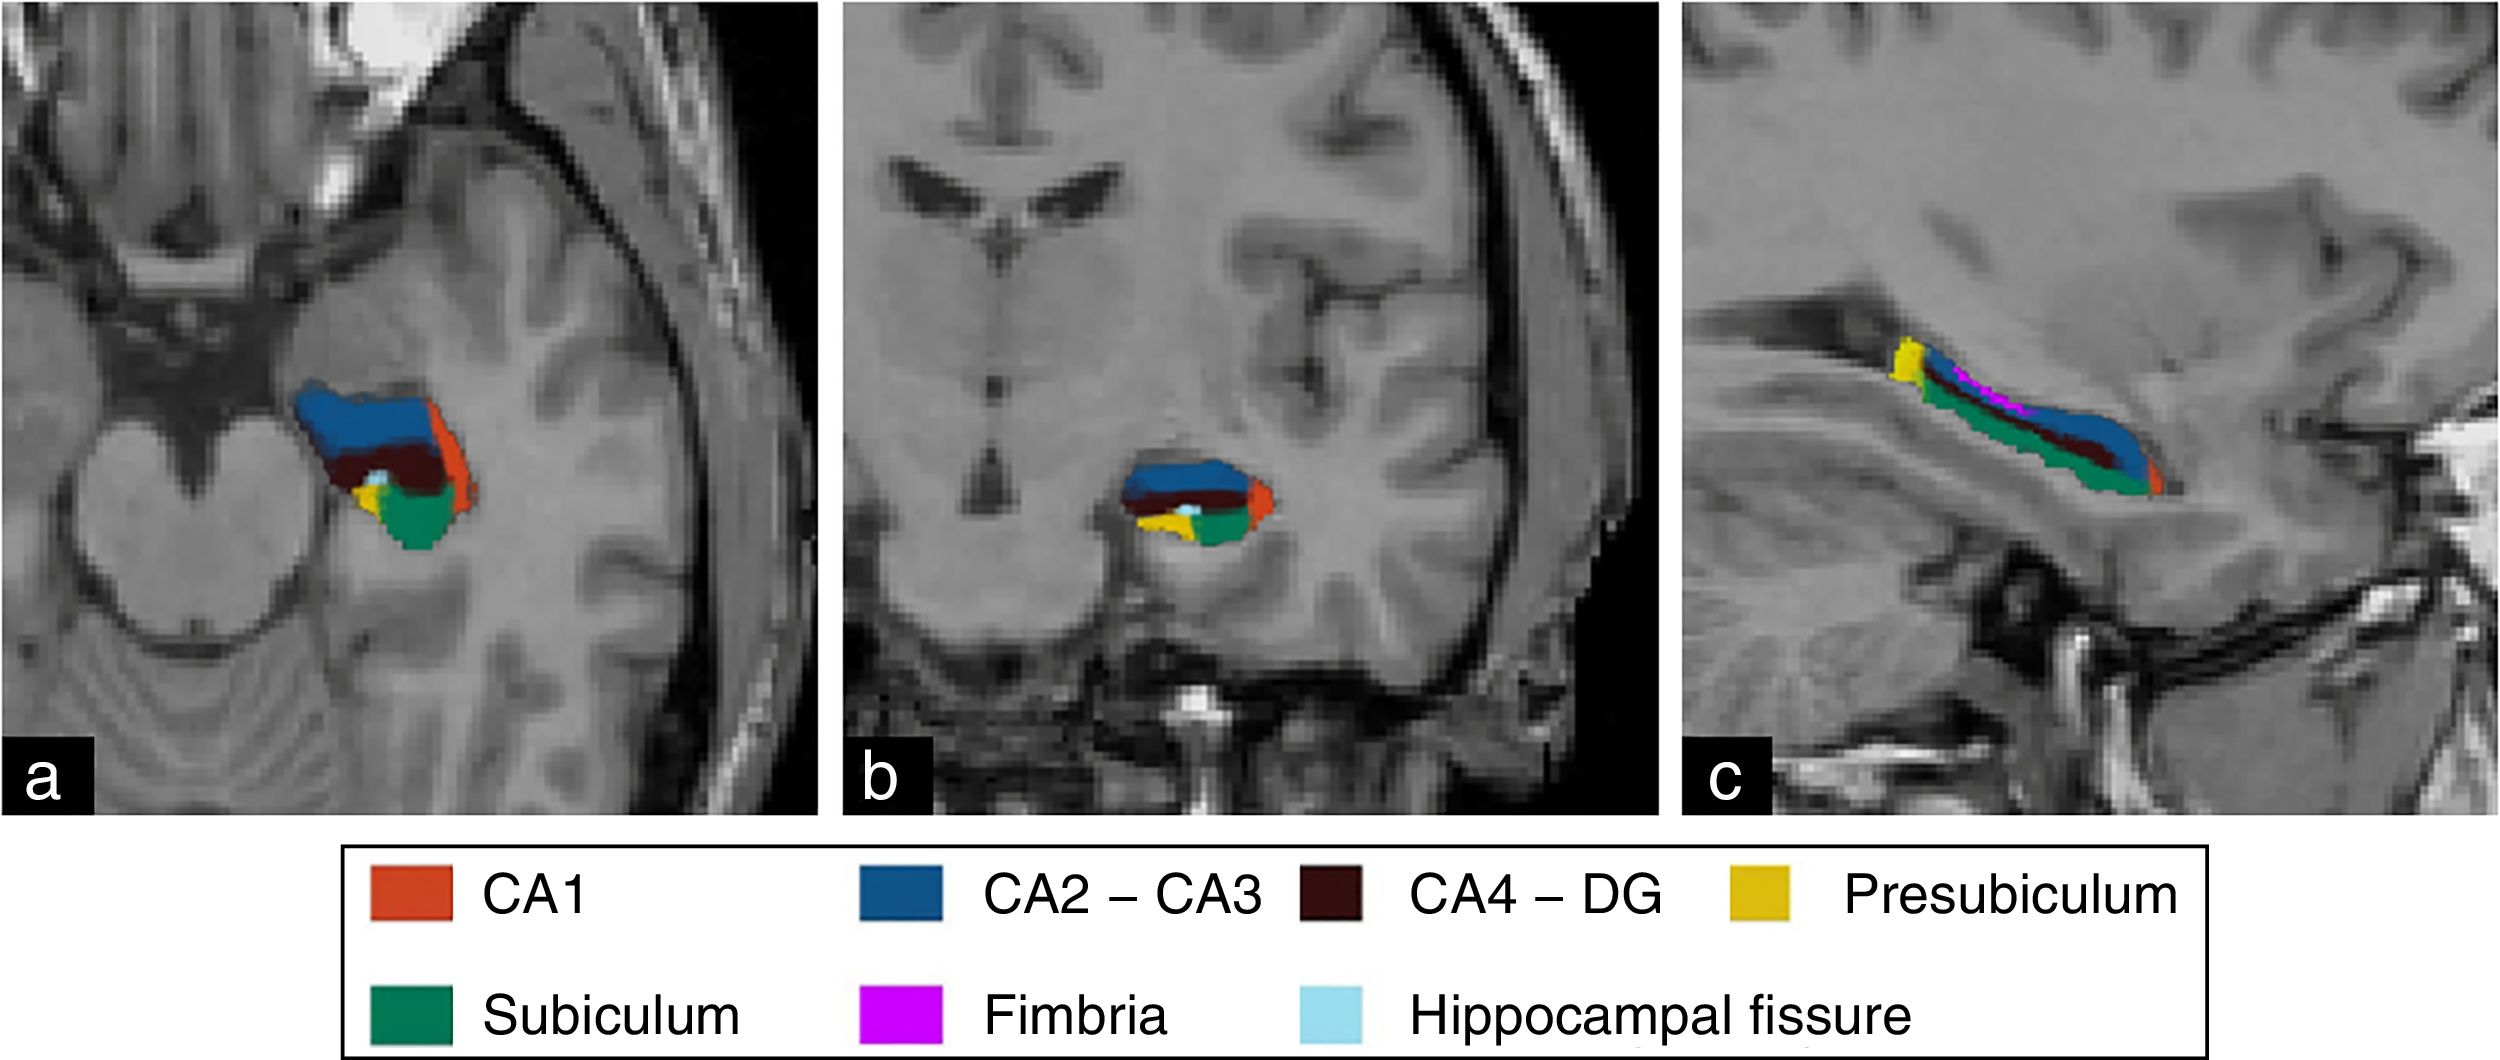
The segmentation of hippocampal substructures was performed automatically using the tool developed by Van Leemput et al.31 whose details and methods implemented have been described by these authors. This tool allows us to perform the individual segmentation of the CA1, fimbria, subiculum, presubiculum, and hippocampal fissure substructures, and the overall segmentation of the CA2–CA3 and CA4–GD substructures (Fig. 3). Numerous studies have shown promising results from the assessment of hippocampal substructures in patients with epilepsy of the temporal lobe.32,33
Qualitative analysis of MRI scans, coronal (b), and sagittal (c) images showing the segmentation of hippocampal structures using the FreeSurfer tool.")
One neuroradiologist (A.M.G.) with over 16 years of experience with MRIs studied the images in order to determine whether there was morphological damage to the hippocampal region or not. All subjects including controls and patients were evaluated. The anonymity of the information from the subjects and the clinical data was kept throughout the entire process of evaluation.
Quantitative analysis of MRI scansThe volumetric values were normalized using the volumetric index (VI) defined as the relation between the volume of the cerebral segment of interest and the total intracranial volume (TIV) multiplied by 100 (VI=volume structure/TIV×100). The analysis was conducted in both hemispheres both for the overall volumes of the hippocampus and for each and everyone of the hippocampal substructures.
Histological analysis and postoperative follow-upThe findings from the histopathological analyses and the control neuropsychological evaluations were obtained from the institution system of clinical history management.
Statistical analysisOne descriptive exploratory analysis was conducted where continuous variables were expressed as mean and standard deviations, or as mean and interquartile ranges, and the Student's t-test or the Mann–Whitney test were run depending on whether the assumption of normalcy was met. P values <0.05 were considered indicative of statistically significant differences. The analyses were conducted using the statistical software package Stata version 12.1. In order to compare the loss of volume among different substructures and establish patterns of atrophy, the normalized volumes were converted into z-score values (z-score=[volume structure patient−average volume in controls]/standard deviation of the volume in controls). For the purposes of the present study, the peak z-score≤−1.5 was considered atrophy.
ResultsWhen it comes to the sociodemographic variables, no statistically significant differences were seen between the group of control subjects and the group of patients diagnosed of HS in age (p=0.8799) or sex (p=1.0000).
The qualitative analysis conducted using coronal and volumetric sequences found morphological damage to the homolateral hippocampus in 11 of the 25 patients, without evidence of alteration in the contralateral structure. In the remaining patients, both hippocampi were described as normal.
In the group of control subjects, there were no statistically significant differences between the right hippocampal volumetric index (RHVI) and the left hippocampal volumetric index (LHVI) (RHVI=0.2750±0.0370; LHVI=0.2720±0.0390; p=0.7932). When it comes to sex, the values of RHVI and LHVI were lower in the male group compared to the female, yet these differences were only statistically significant for the LHVI (LHVI men=0.2610, range: 0.2540–0.2700; LHVI women=0.2970, range: 0.2710–0.3140; p=0.0354).
In the group analysis, the RHVI in patients with right HS (RHS) was significantly lower than the RHVI of the control group (RHVI RHS=0.2110±0.0360; control RHVI=0.2780±0.0270; p<0.0001), while the LHVI did not show any statistically significant differences (LHVI RHS=0.2730±0.0270; control LHVI=0.2750±0.0300; p=0.8894). In patients with left HS (LHS), there was a significant reduction in the LHVI (LHVI LHS=0.1888, range: 0.1707–0.1947; control LHVI=0.2765, range: 0.2697–0.3143; p=0.0152), while the RHVI showed no statistically significant difference (RHVI LHS=0.28; control RHVI=0.27; p=0.9648).
In the control group, no statistically significant differences were found in the interhemispheric comparison in any of the following substructures: CA1 (p=0.1195), CA2–CA3 (p=0.2819), CA4–GD (p=0.3242), hippocampal fissure (p=0.2414), presubiculum (p=0.2760), or subiculum (p=0.9906). However, the volume of the fimbria in the left hemisphere (0.0047±0.001) was larger than in the right hemisphere (0.0038±0.001) with a statistically significant difference (p<0.001).
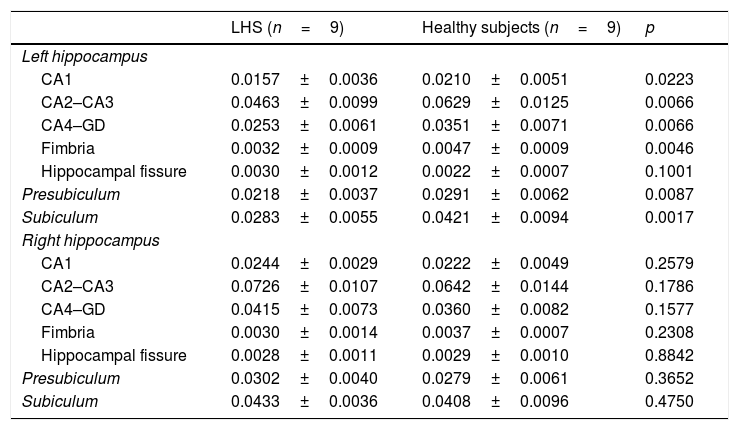
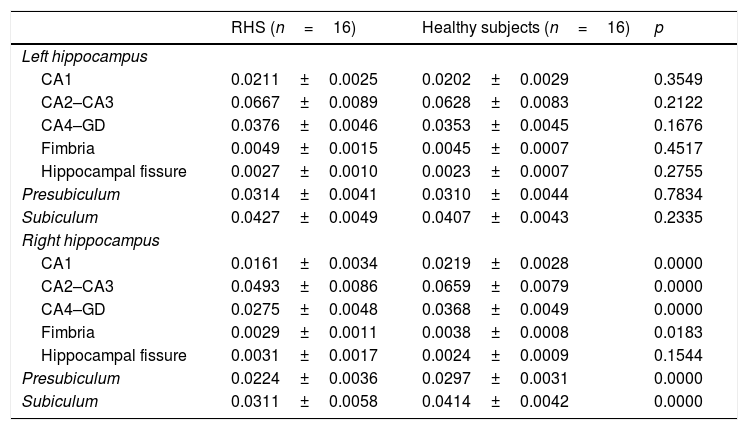
In the group of patients, there was a statistically significant decrease of all homolateral hippocampal substructures except for the hippocampal fissure, while the contralateral substructures did not show any differences compared to the control group (Tables 1 and 2).
Volumetric indexes of hippocampal structures in patients with left HS and control subjects.
| LHS (n=9) | Healthy subjects (n=9) | p | |
|---|---|---|---|
| Left hippocampus | |||
| CA1 | 0.0157±0.0036 | 0.0210±0.0051 | 0.0223 |
| CA2–CA3 | 0.0463±0.0099 | 0.0629±0.0125 | 0.0066 |
| CA4–GD | 0.0253±0.0061 | 0.0351±0.0071 | 0.0066 |
| Fimbria | 0.0032±0.0009 | 0.0047±0.0009 | 0.0046 |
| Hippocampal fissure | 0.0030±0.0012 | 0.0022±0.0007 | 0.1001 |
| Presubiculum | 0.0218±0.0037 | 0.0291±0.0062 | 0.0087 |
| Subiculum | 0.0283±0.0055 | 0.0421±0.0094 | 0.0017 |
| Right hippocampus | |||
| CA1 | 0.0244±0.0029 | 0.0222±0.0049 | 0.2579 |
| CA2–CA3 | 0.0726±0.0107 | 0.0642±0.0144 | 0.1786 |
| CA4–GD | 0.0415±0.0073 | 0.0360±0.0082 | 0.1577 |
| Fimbria | 0.0030±0.0014 | 0.0037±0.0007 | 0.2308 |
| Hippocampal fissure | 0.0028±0.0011 | 0.0029±0.0010 | 0.8842 |
| Presubiculum | 0.0302±0.0040 | 0.0279±0.0061 | 0.3652 |
| Subiculum | 0.0433±0.0036 | 0.0408±0.0096 | 0.4750 |
CA: cornu ammonis; DG: dentate gyrus; LHS: left hippocampal sclerosis.
Volumetric indexes of hippocampal substructures in patients with right hippocampal sclerosis and control subjects.
| RHS (n=16) | Healthy subjects (n=16) | p | |
|---|---|---|---|
| Left hippocampus | |||
| CA1 | 0.0211±0.0025 | 0.0202±0.0029 | 0.3549 |
| CA2–CA3 | 0.0667±0.0089 | 0.0628±0.0083 | 0.2122 |
| CA4–GD | 0.0376±0.0046 | 0.0353±0.0045 | 0.1676 |
| Fimbria | 0.0049±0.0015 | 0.0045±0.0007 | 0.4517 |
| Hippocampal fissure | 0.0027±0.0010 | 0.0023±0.0007 | 0.2755 |
| Presubiculum | 0.0314±0.0041 | 0.0310±0.0044 | 0.7834 |
| Subiculum | 0.0427±0.0049 | 0.0407±0.0043 | 0.2335 |
| Right hippocampus | |||
| CA1 | 0.0161±0.0034 | 0.0219±0.0028 | 0.0000 |
| CA2–CA3 | 0.0493±0.0086 | 0.0659±0.0079 | 0.0000 |
| CA4–GD | 0.0275±0.0048 | 0.0368±0.0049 | 0.0000 |
| Fimbria | 0.0029±0.0011 | 0.0038±0.0008 | 0.0183 |
| Hippocampal fissure | 0.0031±0.0017 | 0.0024±0.0009 | 0.1544 |
| Presubiculum | 0.0224±0.0036 | 0.0297±0.0031 | 0.0000 |
| Subiculum | 0.0311±0.0058 | 0.0414±0.0042 | 0.0000 |
CA: cornu ammonis; DG: dentate gyrus; RHS: right hippocampal sclerosis.
Taking into consideration the threshold defined for the z-score values in the individual analysis, in 19 out of the 25 patients (76.0%), there was a reduced overall volume of the homolateral hippocampus. In 21 patients (84.0%), the 16 cases with RHS (100.0%) and 5 of the 9 cases with LHS (55.5%) showed, at least, one substructure with a significant loss of volume. Of the four patients with LHS, the first case showed the z-score values of −1.27 and −1.14 for CA2–CA3 and CA4–GD, respectively; the second case, values of −1.03, −1.11, −1.22, and −1.34 for the substructures CA2–CA3, CA4–GD, fimbria, and presubiculum, respectively. The third patient showed the z-score values of −1.25 and −1.30 for CA2–CA3 and fimbria, respectively. Finally, in the fourth case, all substructures showed the z-score values close to zero.
In the individual analysis of the contralateral hemisphere, only the z-score values under −1.5 were seen in the fimbria in seven patients (LHS, n=5; RHS, n=2), while the remaining contralateral substructures showed no alterations.
Also, the following patterns of hippocampal substructure atrophy in patients with HS were seen: 14 patients (LHS, n=6; RHS, n=8) showed alteration of the CA1, CA2–CA3, CA4–GD, and subiculum; two patients (RHS, n=2) loss of volume in CA1, CA2–CA3, and fimbria; one patient (LHS, n=1) showed alteration of the CA4–GD and the subiculum, although CA2–CA3 showed a z-score value of −1.38; similar to other case (LHS, n=1) with a significant loss of volume in the subiculum only, but with the z-score values close to the threshold (CA2–CA3 z-score=−1.13; CA4–GD z-score=−1.28). One patient (RHS, n=1) showed significant atrophy of the CA1, fimbria, and subiculum, while other two cases (RHS, n=1; LHS, n=1) only showed a significant alteration of the fimbria.
Out of the 25 patients included, eight underwent surgical resection with further histopathological analysis. Five cases showed focal cortical dysplasia with HS; in three patients, the analysis of hippocampal substructures showed significant atrophy of CA1, CA2–CA3, and CA4–GD, and another patient showed atrophy of the subiculum and the presubiculum, while in the other case there was only a significant reduction in the volume of the fimbria. In two patients, the histopathological sample described HS; in both cases with atrophy of the CA1, CA2–CA3, and CA4–GD substructures. In the other patient with only a significant loss of volume in the fimbria, the histopathological sample showed no alterations of neuronal loss, gliosis, cortical migration, or dysplasia. During the postoperative follow-up conducted at 12 months, six patients were free from seizures with no associated deficits, and another two showed partial control of their seizures, one of them with involvement of his memory functions 4 months after the surgery. These were the two cases with only significant atrophy of the fimbria.
DiscussionThe present study confirmed the loss of volume in the hippocampal substructures CA1, CA2–CA3, CA4–GD, fimbria, presubiculum, and subiculum—homolateral to the epileptogenic focus, in patients with HS compared to healthy subjects, while the contralateral structures showed statistically unsignificant differences. Comparing both pathological groups, the difference was statistically more significant in the group of patients with RHS for all substructures than in the group of patients with LHS, except for the fimbria, that showed a more statistically significant reduction in patients with left damage.
In the individual analysis that used the z-score values, we saw the global brain atrophy of the homolateral hippocampus in 76.0% of the patients while in 84.0% of the cases we saw a significant volume reduction in, at least, one hippocampal substructure. In three of the four remaining cases, we found a lower-grade atrophy pattern in substructures CA2–CA3 and CA4–GD, yet the z-score values were still under the threshold defined in the study.
In terms of frequency, the subiculum was the most damaged substructure of all (n=18), followed by the CA1 (n=17), the fimbria (n=17), CA2–CA3 (n=16), CA4–GD (n=15), and the presubiculum (n=15). However, the substructure CA1 was the most commonly damaged substructure in the RHS with significant atrophy in 11 out of 16 patients. These findings have been correlated with histopathological studies and have already been reported by several authors who have said that neuronal loss is evident mainly in CA1, CA4, and CA3.34–37 Similarly, other studies have shown that the volumes of CA1 and subiculum keep a positive correlation with age at the beginning of the seizure, and a negative correlation with the duration of the disease, which is indicative of the important role played by these structures in the underlying pathogenesis of HS.34
According to the last classification made by the International League Against Epilepsy (ILAE),38 HS can be categorized into four different types based on the hippocampal regions more commonly damaged:
- •
Type 1: is the most common of all (60–80% of the cases) and the main region affected is the CA1 with significant alteration of CA2, CA3, and CA4.
- •
Type 2: is a less common pattern (5–10%) showing predominant affectation of CA1 too but less alteration of CA2, CA3, and CA4.
- •
Type 3: is characterized by a neuronal loss predominantly in CA4, and to a lesser extent, in CA3, CA2, and CA1 sections.
- •
Type 4: shows gliosis without significant neuronal loss.
In this study, we found frequencies similar to the ones reported in the medical literature—57.1% of the patients showed type 1 pattern, 19.0% type 2 pattern, and 9.52% showed type 3 pattern. In two cases, we only found damage to the fimbria and in another case a significant atrophy of the subiculum. Patterns with volumetric loss limited to these structures have not been described in the actual classification established by the ILAE. Although the early clinical information and the frequency of the seizures were not considered relevant for the goal of the study, the lack of atrophy in the main structures could be associated with the onset of the seizures at a later age and with a low frequency of these seizures in these patients.
Taking into consideration that a seizure-induced progressive reduction both of the concentration of N-acetylaspartate and in the volume of hippocampus in patients with HS has been reported and that atrophy does not occur uniformly, but affects specific substructures mainly, our findings show the capacity of the FreeSurfer tool in the morphologically assessment of the structures that make up hippocampal formation and in the identification of focal alterations before the global brain atrophy takes over. Further studies are needed to determine the contributions made by this tool in terms of its predictive diagnostic value before backing up these findings.
Although the sample of cases taken to surgery is small, there was a better postoperative state in patients who showed a significant reduction in the volume of CA1, CA2–CA3, CA4–GD, subiculum, or presubiculum being free from seizures and associated deficits. In two patients with only loss of volume in the fimbria, the partial control of the seizures was confirmed, and one of them showed involvement of his memory functions.
These are promising findings and will be at the foundation of future research, since the identification of hippocampal atrophy associated with the epileptogenic focus could be highly valuable in the patient's prognosis, since a better postoperative progression has been found on the imaging studies when lesions are unilateral and localized.39,40 Similarly, the histopathological studies confirm that there is a correlation between the patterns of neuronal loss and seizure control,12,13 which is why the classification based on the pattern of atrophy of hippocampal substructures based on MRIs could be a good predictor of the patient's postoperative state.
The present study has some limitations that should be taken into consideration here. First, the size of the sample was small, mainly in the group of patients with LHS (n=9) and in the group of patients with histopathological sample after surgical therapy (n=8). Secondly, in the hippocampal segmentation conducted using the FreeSurfer tool, some substructures were assessed together (CA2–CA3 and CA4–GD), which is why it was impossible to determine the degree of atrophy of each one them independently. This may have an implication in the findings and when it comes to determining the patterns of atrophy, since various histopathological studies have confirmed that the CA2 is the most resilient structure, since it is the one that shows the least neuronal loss of all, while the CA4 is one the main structures to sustain damage. Finally, it is important to bear in mind that images were acquired using one 1.5 T MRI machine, but 3.0 T MRI machines show superiority in the assessment of patients diagnosed of epilepsy.
In sum, using the fully automatic tool FreeSurfer, we were able to confirm the presence of significant atrophy in the substructures of hippocampal formation homolateral to the epileptogenic focus, mainly in CA1 and the subiculum, even in cases with no loss of overall volume in the hippocampus. This suggests that the method used may be superior to the conventional volumetry of the hippocampus for the detection of HS-induced conditions. The loss of regional volume specific to certain substructures following particular atrophy patterns observed in this study is in tune with the last classification established by the ILAE, which may have a high clinical impact not only in the diagnosis, but also in the postoperative prognosis of patients with HS.
Authors- 1.
Manager of the integrity of the study: A.M.G.
- 2.
Study idea: A.M.G. and J.F.O.
- 3.
Study design: A.M.G. and J.F.O.
- 4.
Data mining: J.F.O.
- 5.
Data analysis and interpretation: A.M.G. and J.F.O.
- 6.
Statistical analysis: A.M.G. and J.F.O.
- 7.
Reference search: A.M.G. and J.F.O.
- 8.
Writing: A.M.G. and J.F.O.
- 9.
Critical review of the manuscript with intellectually relevant remarks: A.M.G. and J.F.O.
- 10.
Approval of final version: A.M.G. and J.F.O.
The authors declare no conflicts of interests associated with this article whatsoever.
The authors wish to thank the Department of Diagnostic Imaging, and the Center of Clinical Research of the institution for their contribution and support while conducting this paper.
Please cite this article as: Granados Sánchez AM, Orejuela Zapata JF. Esclerosis hipocampal: evaluación volumétrica de las subestructuras del hipocampo utilizando resonancia magnética. Radiología. 2018;60:404–412.

