


Population ageing poses a challenge for countries in preventing and detecting neurodegenerative disorders. The Montreal Cognitive Assessment (MoCA), a short, simple, valid, and reliable screening test, assesses general cognitive status, and is useful in public health contexts. This study aims to normalise and standardise the MoCA test for the Chilean population.
MethodWe performed a descriptive, correlational validation study of the MoCA test, using a sample including 526 healthy individuals of both sexes, aged between 18 and 90 years, from the north, centre, and south of Chile. We analysed the effects of age, education level, and sex on MoCA performance.
ResultsAge and education level had a significant impact on general cognitive performance, as determined by MoCA score. Age, education, and sex account for 1%-7% of variance. The mean (standard deviation) score for the total sample was 24.04 (3.22), whereas the normal range originally defined for the instrument is 26-30 points. Older adults with less formal education presented poorer results and lower cognitive performance. We propose a protocol for evaluating results by percentiles and scores for different age ranges, and an individual normalised scalar score.
DiscussionWe present normative data for the MoCA test in the Chilean population, and propose cut-off points for different age ranges to discriminate normal cognitive performance from neurocognitive disorders; results are adjusted for education level. This proposal would assist in the use of the test and reduce the rate of false positives.
El envejecimiento poblacional implica un desafío para los países respecto a prevenir y detectar trastornos neurodegenerativos. El Montreal Cognitive Assessment (MoCA), test de cribado breve, de simple aplicación, válido y confiable, evalúa el estado cognitivo general, siendo útil en contextos de salud pública. El estudio busca normalizar y estandarizar el test MoCA para población chilena.
MétodoSe presenta estudio de validación para prueba diagnóstica de tipo descriptivo y correlacional, se evaluó a 526 sujetos, hombres y mujeres, de entre 18 y 90 años, sanos, del norte, centro y sur de Chile, analizando: el efecto de la edad, nivel educativo y sexo, para rendimiento de MoCA.
ResultadosSe demuestra un efecto significativo de la edad y el nivel educativo sobre el rendimiento cognitivo general según MoCA. La edad, educación y sexo explican 1-7% de la varianza. El rendimiento cognitivo medio del total de la muestra fue de 24,04 ± 3,22, para un rango definido originalmente por el instrumento de 26 puntos sobre 30. Los adultos mayores con menor educación formal presentaron bajos resultados y menor rendimiento cognitivo. Se propone protocolo de evaluación de resultados en percentiles y puntuaciones por rango de edad y puntuación escalar normalizada individual.
DiscusiónSe presentan datos normativos de MoCA según las características sociodemográficas chilenas y puntos de corte propuestos para discriminar el rendimiento cognitivo normal de trastornos neurocognitivos según rangos de edad, ajustando los resultados al nivel educacional, la propuesta permitiría facilitar el uso del instrumento y disminuir la aparición de falsos positivos.
The worldwide increases in life expectancy and population ageing entail new challenges in ensuring quality of life and individual well-being. Globally, approximately 36 million people were living with dementia as of 2010, with prevalence showing a tendency to double every 20 years; thus, 66 million people are expected to present the disease by 2030, and 115 million by 2050.1 As a result of population ageing, Western Europe is the region with the greatest number of individuals aged ≥ 60 years, with an estimated 7 million cases. This is associated with a considerable economic cost: 160 billion euros per year in the European Union.2
The United Nations defines a population as ageing when 7% or more individuals are aged 60 years or older. Chile has surpassed this level, with individuals aged over 60 years accounting for over 13.5% of the population; this rate is expected to increase to 20% by 2050.3
Chile is one of the most aged societies in Latin America; 1% of the country’s population present some type of age-related cognitive impairment, with 200 000 individuals estimated to present this clinical condition, which has a significant social and economic impact.4–6 The annual cost of dementia management is 10 980 dollars, of which 20% corresponds to direct costs, 5% to direct social costs, and 75% to indirect social costs.7
Pathological ageing involves processes that negatively impact neurocognitive function due to morphological, biochemical, metabolic, and circulatory changes, which affect the functioning of the brain.8
Neurocognitive disorders may also occur in adults of reproductive age presenting acquired neurological damage with a functional impact; clinical screening instruments enable physicians to evaluate these patients’ medical history in order to establish a diagnosis and treatment. This underscores the relevance of screening tests, whose role is to identify individuals who may present some disease for subsequent referral for specific physical, neurobiological, and psychometric evaluation.9,10
Clinically, the fifth edition of the Diagnostic and Statistical Manual of Mental Disorders (DSM-5)11 includes a section on neurocognitive disorders, characterised by a decline in previously attained function in higher cognitive domains, and indicates their relationship with brain regions, neural pathways, and cortico-subcortical networks.
The DSM-5 classification includes mild neurocognitive disorder, equivalent to mild cognitive impairment (MCI), included in the ICD-10 classification.12 Similarly, major neurocognitive disorders are classified according to the degree of impairment (mild, moderate, or severe); severe impairment corresponds to dementia.
According to the recent ICD-11 classification,13 MCI is characterised by the subjective experience of a reduction in the premorbid level of cognitive functioning, accompanied by objective evidence of impairment in one or more cognitive domains with regard to the performance expected for the individual’s age and general intellectual function, which is not sufficiently severe to interfere significantly with their daily life.10
Different forms of examining or categorising cognitive impairment according to the standard applied are not mutually exclusive; rather, these constructs enable the creation of comprehensive criteria for detecting early cognitive impairment in neurodegenerative diseases, or to identify a specific type of cognitive dysfunction. Improving standards for screening instruments will facilitate diagnosis and contribute to epidemiological research and analysis of the cost-effectiveness of therapeutic interventions.14,15
Research into normal and pathological ageing has informed public health policy and strategy, as shown by a series of studies conducted in Spain.16,17
The NEURONORMA study,18 a multicentre study for the normalisation and validation of neurocognitive and functional instruments, demonstrated the importance, in the context of ageing and dementia, of the ability to assess, detect, diagnose, and follow up cognitive impairment with instruments that are reliable, validated, and standardised according to the characteristics of the target region and population. It is also essential to establish longitudinal normative criteria.
Latin American researchers (Mexico, Colombia) have attempted to reproduce this model, although their results have not yet been published, reflecting the complexity of this type of study, mainly due to the difficulty of identifying eligible participants and the high associated costs. These limitations also apply to the Chilean setting, and force us to prioritise the use of specific, straightforward, and preferably inexpensive techniques and instruments, such as the Montreal Cognitive Assessment (MoCA).
This study evaluates the MoCA screening test19 and is intended as a step towards the standardisation of the instrument for cognitive screening in Chile. International20 and Chilean studies16 describe the MoCA as a reliable, valid test for neurocognitive evaluation, with good sensitivity and specificity,21,22 when compared to the Mini–Mental State Examination, with a cut-off point of 24.3 ± 3.0, and the Addenbrooke’s Cognitive Examination (ACE-III), with a cut-off point of 70.6 ± 12.7 (a cut-off point of 20.3 ± 4.1 was established for the MoCA).23,24
We review and describe the neurocognitive characteristics associated with functional performance in the healthy adult population and establish standardised characteristics for the MoCA as a screening test for cognitive impairment in the general population.
MethodsThis study was conducted within the framework of the Chilean National Fund for Research and Development in Health (FONIS 2016; project code SA16I0162)24 and seeks to normalise and standardise cognitive screening instruments for use in the Chilean adult population, through a descriptive, correlational validation study for diagnostic tests.
ParticipantsThe sample was recruited from healthcare centres corresponding to universities in northern, central, and southern Chile. The study was approved by the bioethics committee of the University of Valparaíso. All participants were informed of the purposes of the study and gave written consent to participate. Selection criteria were applied through a questionnaire that, for individuals aged 18-59 years, gathered data on level of education, neurological and psychiatric disorders, history of physical or psychiatric disorders that may affect cognitive performance, and sensory limitations preventing application of the instrument (previously assessed by an expert). Participants aged 60 years or older with no such diagnoses and considered healthy were administered the MoCA and the Activities of Daily Living Questionnaire (ADLQ).25
The initial sample included 653 individuals aged between 18 and 90 years. A total of 127 participants were excluded: 65 had been diagnosed with minor neurocognitive disorder and 48 with major neurocognitive disorder, and a further 12 had been diagnosed with and were under treatment for neuropsychiatric disorders; 2 participants were excluded due to atypical results that differed significantly from those of the remaining participants. Therefore, the final sample included 526 healthy individuals (Table 1).
Sociodemographic characteristics of the sample.
| Men (n = 225) | Women (n = 301) | Total (n = 526) | χ2 (P) | |||||
|---|---|---|---|---|---|---|---|---|
| n | % | n | % | n | % | |||
| Age range, years | 18-25 | 53 | 23.6 | 49 | 16.3 | 102 | 19 | 9.6 (.087) |
| 26-35 | 46 | 20.4 | 44 | 14.6 | 90 | 17 | ||
| 36-45 | 33 | 14.7 | 42 | 14.0 | 75 | 14 | ||
| 46-55 | 46 | 20.4 | 57 | 18.9 | 103 | 20 | ||
| 56-65 | 25 | 11.1 | 48 | 15.9 | 73 | 14 | ||
| 66-90 | 22 | 9.8 | 61 | 20.3 | 83 | 16 | ||
| Region | North | 206 | 91.6 | 239 | 79.4 | 445 | 85 | 623.2 (.00) |
| Centre | 9 | 4.0 | 22 | 7.3 | 31 | 6 | ||
| South | 10 | 4.4 | 40 | 13.3 | 50 | 10 | ||
| Education level | Primary (incomplete) | 6 | 2.7 | 16 | 5.3 | 22 | 4 | 327.3 (.00) |
| Primary (complete) | 9 | 4.0 | 8 | 2.7 | 17 | 3 | ||
| Secondary (incomplete) | 27 | 12.0 | 36 | 12.0 | 63 | 12 | ||
| Secondary (complete) | 47 | 20.9 | 78 | 25.9 | 125 | 24 | ||
| Further education (incomplete) | 66 | 29.3 | 65 | 21.6 | 131 | 25 | ||
| Further education (complete) | 68 | 30.2 | 95 | 31.6 | 163 | 31 | ||
| Postgraduate studies | 2 | 0.9 | 3 | 1.0 | 5 | 1 | ||
The study objective was to standardise the MoCA test in accordance with the criteria proposed in the Spanish Normacog España project,17 evaluating the influence of age, sex, and level of education on test performance, creating norms corresponding to the Chilean population aged between 18 and 90 years, and defining percentiles based on scaled scores, age range, and scaled scores adjusted for age and level of education.
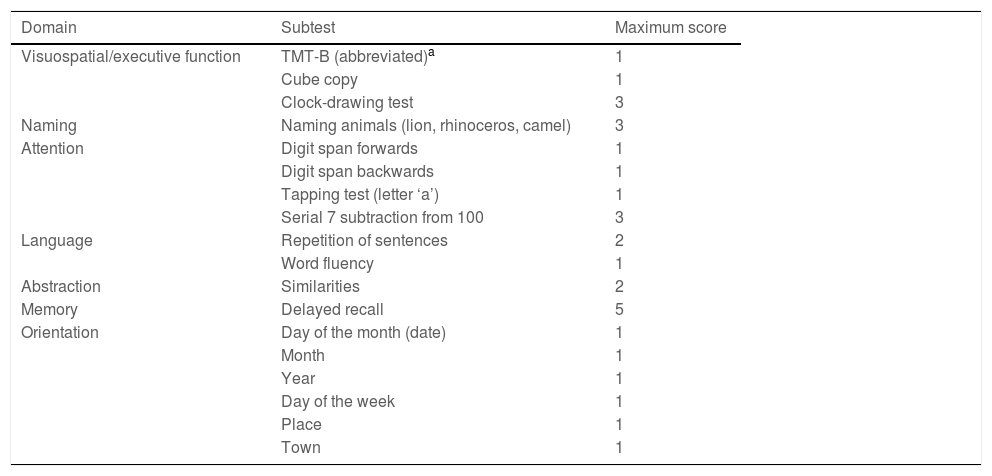
InstrumentThe MoCA test (www.mocatest.org) is available in various versions and languages, and is intended to be used as a measure of overall cognitive function based on the evaluation of different cognitive domains: visuospatial/executive function, naming, attention, language, memory, abstraction, and orientation. Its administration time is 10 minutes (Table 2).
Distribution of MoCA items and scores.
| Domain | Subtest | Maximum score |
|---|---|---|
| Visuospatial/executive function | TMT-B (abbreviated)a | 1 |
| Cube copy | 1 | |
| Clock-drawing test | 3 | |
| Naming | Naming animals (lion, rhinoceros, camel) | 3 |
| Attention | Digit span forwards | 1 |
| Digit span backwards | 1 | |
| Tapping test (letter ‘a’) | 1 | |
| Serial 7 subtraction from 100 | 3 | |
| Language | Repetition of sentences | 2 |
| Word fluency | 1 | |
| Abstraction | Similarities | 2 |
| Memory | Delayed recall | 5 |
| Orientation | Day of the month (date) | 1 |
| Month | 1 | |
| Year | 1 | |
| Day of the week | 1 | |
| Place | 1 | |
| Town | 1 |
The test’s creators originally established a cut-off point of ≥26 out of a maximum of 30 points to discriminate normal performance; scores were adjusted for level of education, with an extra point being added to the scores of individuals with fewer than 12 years of schooling.19
Since the test was published in 2005,19 results from its application indicate high levels of sensitivity and specificity, and it constitutes a reliable and valid instrument, according to the scores obtained.23,24,26 The test efficiently discriminates individuals with normal from those with pathological neurocognitive function.27,28
Statistical analysisOur data enabled us to analyse the mean cognitive performance of the entire sample, analysing sex differences in each of the domains evaluated. To analyse the association between sociodemographic variables (age, sex, level of education) and results for each domain, we used coefficients of correlation (r, rho, and the Kendall tau-b) and determination (R2). Sex differences were analysed with the t test and the Levene test.
For recoding of the variable age, we used the one-way ANOVA test, with stratification into 6 age ranges: 18-25, 26-35, 36-45, 46-55, 56-65, and 66-90 years.
We standardised the MoCA total score, assigning percentile ranks and raw scores by cumulative frequency, and were able to compare percentiles against scaled scores (SS) adjusted for age range (arSS); SS ranged from 2 to 18, achieving the corresponding standardisation (mean = 10, standard deviation [SD] = 3).
Finally, we conducted a multiple regression analysis to obtain education-adjusted normative data, using the following formula: nSS (normalised SS: adjusted for age and level of education) = arSS − (β).
ResultsTable 1 presents the sociodemographic characteristics (age range, geographical region, and level of education) of the 526 participants evaluated, classified by sex. The chi-square test was used to determine the strength of association between variables. We identified no significant differences in the distribution of participants by age range (P = .087). Regarding the geographical distribution of participants, the majority were from the north of the country (85%). Regarding level of education, 1% had completed post-graduate studies, and 7% had not studied beyond the primary level.
The mean (SD) overall MoCA score was 24.04 (3.22) points. We analysed the influence of sociodemographic variables (age, sex, level of education) on cognitive performance in all MoCA domains.
Sex had no significant effect on overall test performance (Levene test: F = 1.968 [P = .710]; t test: t = 0.372 [P = .710]).
Regarding subtest scores, men performed better in visuospatial (x¯ = 3.85), naming (x¯ = 2.91), attention (x¯ = 4.72), and language tasks (x¯ = 2.2), whereas women scored higher for delayed recall (x¯ = 2.82) and orientation (x¯ = 5.86). No difference was found in the abstraction task (x¯ = 1.72). Regarding these results, the sample did not present an equal sex distribution, which may have biased our findings (Table 3).
MoCA domain scores, by sex.
| Sex | MoCA VS/EF | MoCA naming | MoCA attention | MoCA language | MoCA abstraction | MoCA delayed recall | MoCA orientation | MoCA total score |
|---|---|---|---|---|---|---|---|---|
| Men (n = 225) | ||||||||
| Mean | 3.85a | 2.91a | 4.72a | 2.2a | 1.72 | 2.73 | 5.8 | 24.1 |
| Standard error | 0.07 | 0.02 | 0.07 | 0.05 | 0.03 | 0.10 | 0.04 | 0.20 |
| Median | 4 | 3 | 5 | 2 | 2 | 3 | 6 | 24 |
| Mode | 4 | 3 | 6 | 3 | 2 | 4 | 6 | 24 |
| Standard deviation | 1.08 | 0.32 | 1.15 | 0.79 | 0.53 | 1.63 | 0.61 | 3.13 |
| Variance | 1.17 | 0.10 | 1.32 | 0.63 | 0.28 | 2.66 | 0.37 | 9.85 |
| Range | 4 | 2 | 5 | 3 | 2 | 5 | 6 | 15 |
| Minimum | 1 | 1 | 1 | 0 | 0 | 0 | 0 | 15 |
| Maximum | 5 | 3 | 6 | 3 | 2 | 5 | 6 | 30 |
| Women (n = 301) | ||||||||
| Mean | 3.75 | 2.87 | 4.59 | 2.18 | 1.72 | 2.82b | 5.86b | 24 |
| Standard error | 0.06 | 0.02 | 0.07 | 0.04 | 0.03 | 0.09 | 0.02 | 0.18 |
| Median | 4 | 3 | 5 | 2 | 2 | 3 | 6 | 24 |
| Mode | 4 | 3 | 6 | 3 | 2 | 3 | 6 | 26 |
| Standard deviation | 1.14 | 0.4 | 1.25 | 0.83 | 0.53 | 1.55 | 0.48 | 3.28 |
| Variance | 1.30 | 0.16 | 1.56 | 0.70 | 0.28 | 2.41 | 0.23 | 10.76 |
| Range | 5 | 3 | 5 | 3 | 2 | 5 | 5 | 17 |
| Minimum | 0 | 0 | 1 | 0 | 0 | 0 | 1 | 13 |
| Maximum | 5 | 3 | 6 | 3 | 2 | 5 | 6 | 30 |
VS/EF: visuospatial/executive function.
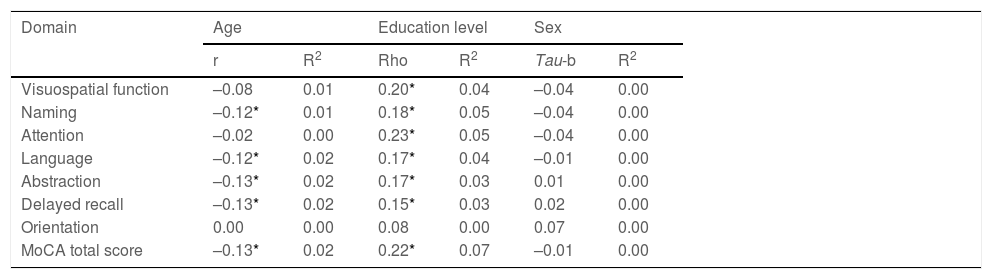
To analyse the influence of sociodemographic variables (age, sex, level of education) on cognitive performance in each domain, we calculated coefficients of correlation and determination. The analysis showed that the different domains of the MoCA test were significantly influenced by these variables, principally by level of education; overall, sociodemographic variables accounted for 0%-7% of variance (Table 4).
Analysis of correlation between MoCA test scores and demographic variables.
| Domain | Age | Education level | Sex | |||
|---|---|---|---|---|---|---|
| r | R2 | Rho | R2 | Tau-b | R2 | |
| Visuospatial function | –0.08 | 0.01 | 0.20* | 0.04 | –0.04 | 0.00 |
| Naming | –0.12* | 0.01 | 0.18* | 0.05 | –0.04 | 0.00 |
| Attention | –0.02 | 0.00 | 0.23* | 0.05 | –0.04 | 0.00 |
| Language | –0.12* | 0.02 | 0.17* | 0.04 | –0.01 | 0.00 |
| Abstraction | –0.13* | 0.02 | 0.17* | 0.03 | 0.01 | 0.00 |
| Delayed recall | –0.13* | 0.02 | 0.15* | 0.03 | 0.02 | 0.00 |
| Orientation | 0.00 | 0.00 | 0.08 | 0.00 | 0.07 | 0.00 |
| MoCA total score | –0.13* | 0.02 | 0.22* | 0.07 | –0.01 | 0.00 |
We observed a general pattern in which total scores remained stable at younger ages, with a clear decline from the age of 46 years (Fig. 1).
.")
The one-way ANOVA test was used to analyse the difference in mean scores between age ranges for each domain. The results showed high F values with statistically significant differences for language (F = 4.118; P = .001) and abstraction (F = 3.932; P = .002), whereas differences in performance for naming (F = 2.123; P = .061) and delayed recall (F = 1.986; P = .079) showed a trend towards significance. No significant differences were found for visuospatial/executive function (F = 1.269; P = .276); attention (F = 0.841; P = .521), or orientation (F = 0.452; P = .812). Global performance on the MoCA test showed an age-dependent decrease (F = 2.137; P = .060).
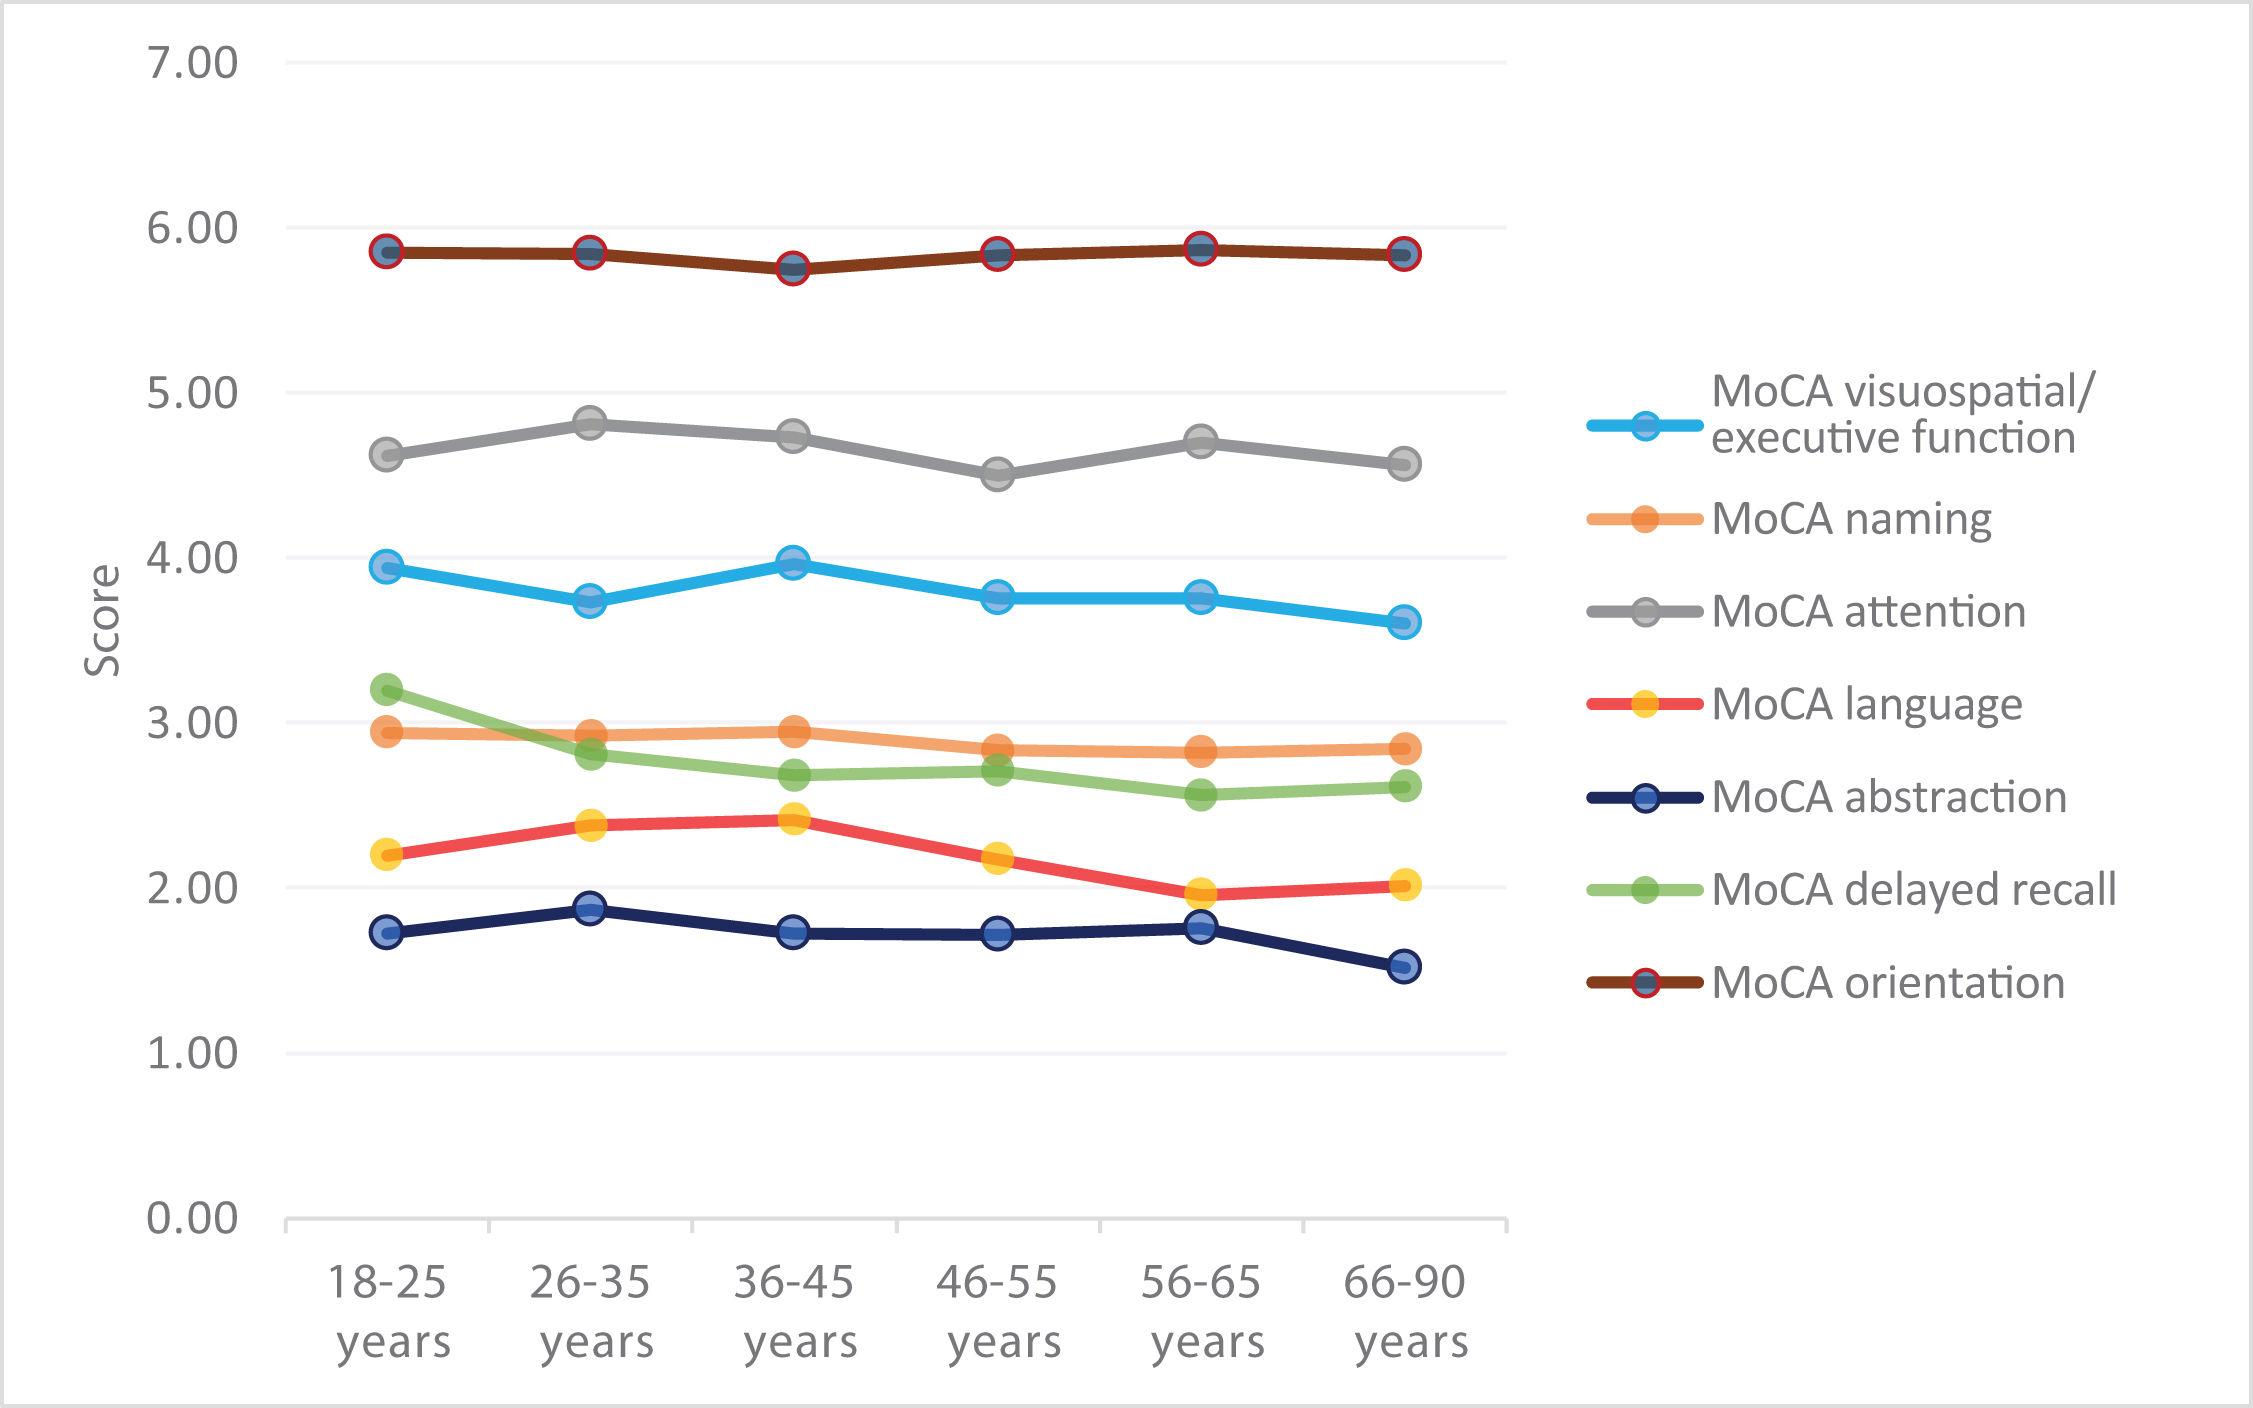
Of all domains, the largest difference was observed for delayed recall; scores for orientation and naming remained stable across all age ranges (Fig. 2).

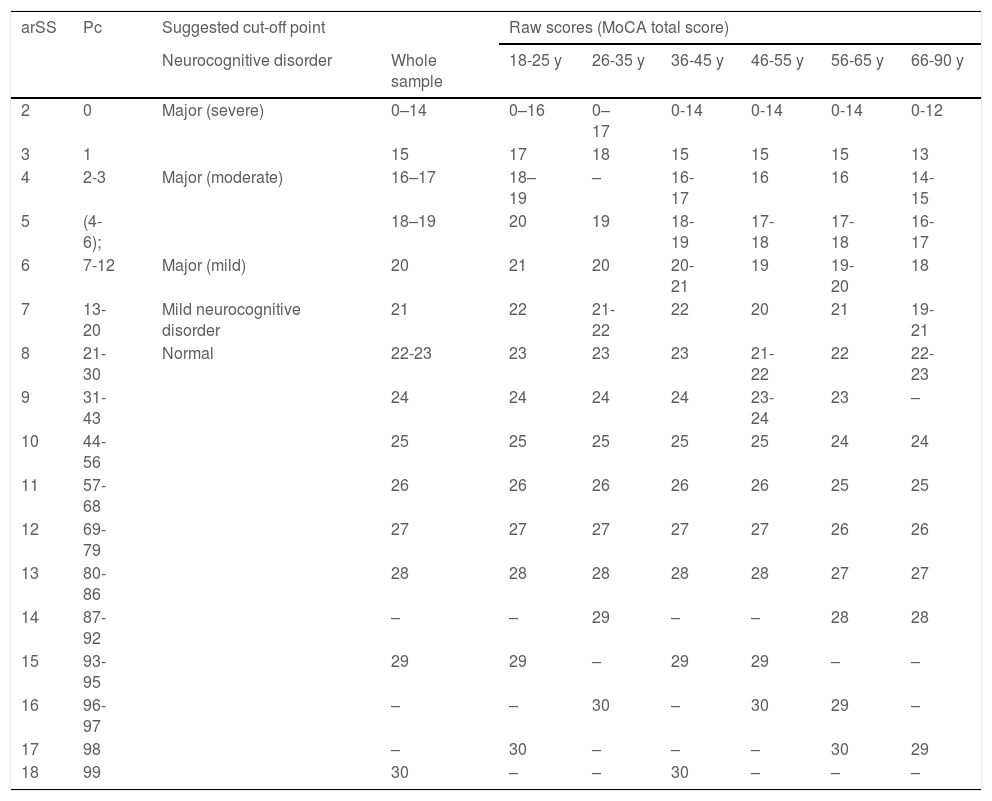
Our analysis enabled us to obtain normative data for MoCA total score, yielding percentile values, as proposed by Ojeda et al.,17 as well as raw scores for the total sample for the 6 age ranges proposed, arSS and percentile values for MoCA total score, and cut-off points for each diagnosis (Table 5).
Conversion of raw scores to scaled scores and percentiles, by age range (step 1).
| arSS | Pc | Suggested cut-off point | Raw scores (MoCA total score) | ||||||
|---|---|---|---|---|---|---|---|---|---|
| Neurocognitive disorder | Whole sample | 18-25 y | 26-35 y | 36-45 y | 46-55 y | 56-65 y | 66-90 y | ||
| 2 | 0 | Major (severe) | 0–14 | 0–16 | 0–17 | 0-14 | 0-14 | 0-14 | 0-12 |
| 3 | 1 | 15 | 17 | 18 | 15 | 15 | 15 | 13 | |
| 4 | 2-3 | Major (moderate) | 16–17 | 18–19 | – | 16-17 | 16 | 16 | 14-15 |
| 5 | (4-6); | 18–19 | 20 | 19 | 18-19 | 17-18 | 17-18 | 16-17 | |
| 6 | 7-12 | Major (mild) | 20 | 21 | 20 | 20-21 | 19 | 19-20 | 18 |
| 7 | 13-20 | Mild neurocognitive disorder | 21 | 22 | 21-22 | 22 | 20 | 21 | 19-21 |
| 8 | 21-30 | Normal | 22-23 | 23 | 23 | 23 | 21-22 | 22 | 22-23 |
| 9 | 31-43 | 24 | 24 | 24 | 24 | 23-24 | 23 | – | |
| 10 | 44-56 | 25 | 25 | 25 | 25 | 25 | 24 | 24 | |
| 11 | 57-68 | 26 | 26 | 26 | 26 | 26 | 25 | 25 | |
| 12 | 69-79 | 27 | 27 | 27 | 27 | 27 | 26 | 26 | |
| 13 | 80-86 | 28 | 28 | 28 | 28 | 28 | 27 | 27 | |
| 14 | 87-92 | – | – | 29 | – | – | 28 | 28 | |
| 15 | 93-95 | 29 | 29 | – | 29 | 29 | – | – | |
| 16 | 96-97 | – | – | 30 | – | 30 | 29 | – | |
| 17 | 98 | – | 30 | – | – | – | 30 | 29 | |
| 18 | 99 | 30 | – | – | 30 | – | – | – | |
arSS: Scaled score adjusted for age range; Pc: percentile; y: years.
Example interpretation: step 1: 78-year-old man with a raw score of 19, equivalent to an arSS of 7 and Pc of 13–20.
These results allow us to discriminate normal from pathological cognitive performance. Three different cut-off points were established for the 3 different levels of impairment: mild, moderate, and severe, taking into account scaled scores (mean [SD]: 8.55 [2.955]). The criteria for selecting these cut-off points were as follows:
- –
SS ≥ 8 and percentiles 21-99 were considered normal (no neurocognitive disorder).
- –
SS = 7 and percentiles 13-20 were considered to indicate probable mild neurocognitive disorder.
- –
SS = 6 (one SD below the mean) and percentiles 7-12 were considered to indicate mild major neurocognitive disorder.
- –
SS 4-5 (2 SD below the mean) and percentiles 2-6 were considered to indicate moderate major neurocognitive disorder.
- –
SS 2-3 (3 SD below the mean) and percentiles 0-1 were considered to indicate severe major neurocognitive disorder.
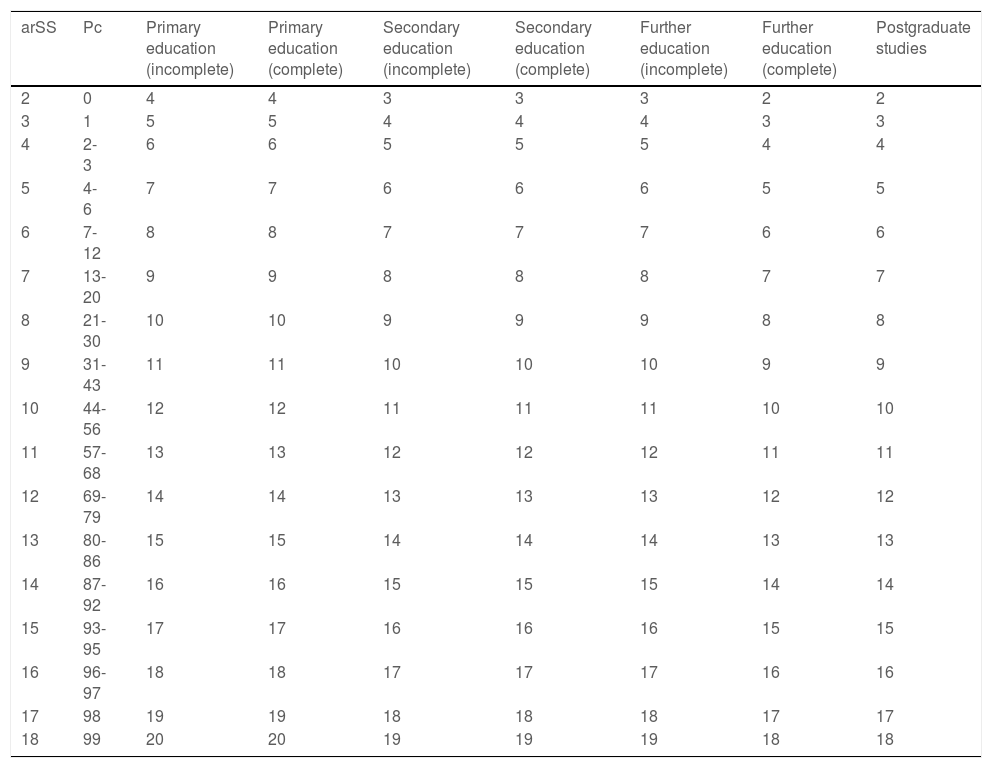
We subsequently obtained normalised scaled scores (nSS) adjusted for age and level of education and percentiles for each nSS (Table 6). To obtain this score, the arSS (obtained in Table 5) must be selected and translated to the left column of Table 6; the column on the right corresponding to the individual’s level of education shows the individual nSS adjusted for age and level of education.
Correction of age range–adjusted scaled scores for level of education (step 2).
| arSS | Pc | Primary education (incomplete) | Primary education (complete) | Secondary education (incomplete) | Secondary education (complete) | Further education (incomplete) | Further education (complete) | Postgraduate studies |
|---|---|---|---|---|---|---|---|---|
| 2 | 0 | 4 | 4 | 3 | 3 | 3 | 2 | 2 |
| 3 | 1 | 5 | 5 | 4 | 4 | 4 | 3 | 3 |
| 4 | 2-3 | 6 | 6 | 5 | 5 | 5 | 4 | 4 |
| 5 | 4-6 | 7 | 7 | 6 | 6 | 6 | 5 | 5 |
| 6 | 7-12 | 8 | 8 | 7 | 7 | 7 | 6 | 6 |
| 7 | 13-20 | 9 | 9 | 8 | 8 | 8 | 7 | 7 |
| 8 | 21-30 | 10 | 10 | 9 | 9 | 9 | 8 | 8 |
| 9 | 31-43 | 11 | 11 | 10 | 10 | 10 | 9 | 9 |
| 10 | 44-56 | 12 | 12 | 11 | 11 | 11 | 10 | 10 |
| 11 | 57-68 | 13 | 13 | 12 | 12 | 12 | 11 | 11 |
| 12 | 69-79 | 14 | 14 | 13 | 13 | 13 | 12 | 12 |
| 13 | 80-86 | 15 | 15 | 14 | 14 | 14 | 13 | 13 |
| 14 | 87-92 | 16 | 16 | 15 | 15 | 15 | 14 | 14 |
| 15 | 93-95 | 17 | 17 | 16 | 16 | 16 | 15 | 15 |
| 16 | 96-97 | 18 | 18 | 17 | 17 | 17 | 16 | 16 |
| 17 | 98 | 19 | 19 | 18 | 18 | 18 | 17 | 17 |
| 18 | 99 | 20 | 20 | 19 | 19 | 19 | 18 | 18 |
arSS: Scaled score adjusted for age range; Pc: percentile.
Data correspond to a scaled score adjusted for age and education.
Example interpretation: Step 1: see Table 5. Step 2: 78-year-old man with incomplete primary education, with a raw score of 19 points and an arSS of 7. Procedure: find arSS from step 1 (in this case, 7) in the left-hand column, then select the level of education (in this case, incomplete primary study) from the top row. This results in a normalised scaled score (adjusted for age and education) of 9, or percentile 31-43.
There has recently been exponential growth in research conducted in Latin America to standardise neuropsychological screening tests in the region25–31; in this study, we aimed to establish representative normative data for the healthy Chilean population to facilitate the detection of neurocognitive disorders in young and older adults. One limitation of the study was the difficulty of identifying healthy individuals older than 60 years who met none of the exclusion criteria. This affected the stratification of the subgroup of older individuals; however, compared to other studies conducted in Chile, our sample is large.16–33
The MoCA test is appropriate for general use, given its ease of application and interpretation. It was freely available (https://www.mocatest.org) from the time of its creation until 2019, when a requirement was introduced for training and certification of the examiner, which has a cost of 125 dollars (https://www.mocatest.org/training-certification), potentially limiting its accessibility.
Continuing research is needed to standardise and normalise this type of instrument according to the sociodemographic characteristics of different populations. In this study, we evaluated a population of healthy Chilean individuals aged 18-90 years, aiming to confirm the value of MoCA scores as a precise measure of age-related cognitive changes in longitudinal studies and in the clinical setting through test-retest procedures.34
We sought to establish cut-off points to facilitate clinical interpretation of the results, following the methodology applied in Spain by Ojeda et al.17 Unlike the Normacog proposal, our results and normative data refer to the new nomenclature of the DSM-5, establishing cut-off points for mild neurocognitive disorder and mild, moderate, and severe major neurocognitive disorder,11 standardising scores for each of the 6 age ranges analysed.
One limitation of the study is that the proposed categorisation by standardised cut-off points should not in itself be considered a diagnostic criterion: rather, the test is an easy-to-use instrument intended to assist in establishing a possible diagnosis, complementing the initial clinical information (biomarkers, impaired functional autonomy, previous functional status, neuropsychiatric disorders, etc.).
Our findings show that the variable level of education plays an important role in normalising MoCA scores in the healthy population. The results obtained are consistent with those of previous studies, suggesting that level of education is one of the variables with the greatest impact on cognitive performance in healthy adults as they age.22–35
According to MoCA scores, cognitive performance decreases significantly with age, and some studies consider education as a bias in the interpretation of test scores.26 These findings may enable longitudinal population studies of factors associated with neurodevelopment and cognitive function, with formal education playing a protective role in maintaining cognitive reserve.
Regarding sex, women performed better in delayed recall and orientation tasks, whereas men scored higher for visuospatial/executive function, naming, attention, and language. These sex-related differences between cognitive domains did not significantly affect total scores.
Our statistical analysis yielded normative data for the Chilean population, with MoCA total scores stratified by sex, age range, and level of education. We established cut-off points to facilitate the clinical interpretation of test scores for a large section of the population (ages 18-90 years).
The instrument represents a reliable, valid tool for screening for functional cognitive impairment in the public and private healthcare systems. The proposed criteria for classification by MoCA score and percentile may facilitate longitudinal population studies to analyse interventions for age-related neurocognitive disorders or other conditions affecting functional status.
ConclusionOur results are adjusted to the sociodemographic characteristics of the adult Chilean population (age range, 18-90 years). We present normative data and cut-off points for MoCA total scores in 6 age ranges and for different levels of education, with a view to assisting in the clinical interpretation of cognitive performance.
Regarding the cut-off points established, our findings are consistent with those of other Chilean and international normative studies,16–20,22 confirming that the cut-off point defined by the authors of the instrument (26 points)19 for normal cognitive performance may present limitations for diagnosis, with a higher rate of false positive results.16
MoCA scores do not define a specific diagnosis; rather, they act as a screening tool, enabling clinicians and healthcare systems to perform a more detailed evaluation of cognitive impairment.
The normative data obtained from our study yielded different cut-off points from those reported by the authors of the Normacog project17; future longitudinal studies should explore the role of education and neurodevelopmental processes, as well as ageing, in neurocognitive disorders, taking into account the particular characteristics of each population and region.
FundingThis study was financed by the Chilean Ministry of Education via the National Fund for Research and Development in Health (FONIS 2016; project code SA16I0162).
Conflicts of interestThe authors have no conflicts of interest to declare.
