


Pneumonia as a complication of stroke is associated with poor outcomes. The A2DS2 and ISAN scales were developed by German and English researchers, respectively, to predict in-hospital stroke-associated pneumonia. We conducted an external validation study of these scales in a series of consecutive patients admitted to our hospital due to ischaemic stroke.
MethodThese predictive models were applied to a sample of 340 consecutive patients admitted to hospital in 2015 due to stroke. Discrimination was assessed by calculating the area under the ROC curve for diagnostic efficacy. Calibration was assessed using the Hosmer–Lemeshow goodness-of-fit test and graphing the corresponding curve. Logistic regression analysis was performed to determine the independent predictors of respiratory infection secondary to stroke.
ResultsWe included 285 patients, of whom 45 (15.8%) had respiratory infection after stroke according to the study criteria. Mean age was 71.01±12.62 years; men accounted for 177 of the patients (62.1%). Seventy-two patients (25.3%) had signs or symptoms of dysphagia, 42 (14.7%) had atrial fibrillation, and 14 (4.9%) were functionally dependent before stroke; the median NIHSS score was 4 points. Mean scores on A2DS2 and ISAN were 3.25±2.54 and 6.49±3.64, respectively. Our analysis showed that higher A2DS2 scores were associated with an increased risk of infection (OR=1.576; 95% CI: 1.363-1.821); the same was true for ISAN scores (OR=1.350; 95% CI: 1.214-1.501).
ConclusionHigh scores on A2DS2 and ISAN were found to be a strong predictor of respiratory infection associated with acute stroke in a cohort of consecutive patients with stroke. These easy-to-use scales are promising tools for predicting this complication in routine clinical practice.
La neumonía asociada al ictus es una complicación relacionada con mal pronóstico. Las escalas A2DS2 e ISAN se han desarrollado recientemente por un grupo alemán e inglés, respectivamente, para predecir la neumonía intrahospitalaria tras un ictus agudo. Realizamos una validación externa de estas escalas en una serie consecutiva de pacientes ingresados por ictus isquémico en nuestro centro.
MétodoEl modelo pronóstico se realiza sobre una muestra de 340 sujetos consecutivos ingresados por ictus en 2015. La discriminación se evaluó mediante el cálculo del área bajo la curva de eficacia diagnóstica (curva ROC). La calibración se evaluó mediante la realización del test de bondad de ajuste de Hosmer-Lemeshow y la representación gráfica de la curva. Se realiza un análisis de regresión logística para determinar los predictores independientes de infección respiratoria después del ictus.
ResultadosLa muestra final evaluada fue de 285 sujetos, entre los cuales 45 pacientes (15,8%) tuvieron infección respiratoria tras el ictus según unos criterios preestablecidos. La edad media de los pacientes fue de 71,01 (DE 12,62) años. De ellos, 177 (62,1%) fueron varones. Setenta y dos pacientes (25,3%) tenían síntomas o signos de disfagia, 42 (14,7%) tenían fibrilación auricular, 14 (4,9%) tenían situación de dependencia previa al ictus y la mediana de la puntuación NIHSS fue de 4 puntos. La puntuación media de la escala A2DS2 fue 3,25 (DE 2,54) y la de ISAN fue 6,49 (DE 3,64). El análisis muestra que por cada punto en la escala A2DS2 se incrementa el riesgo de infección respiratoria (OR=1,576; IC 95%: 1,363-1,821), al igual que en la escala ISAN (OR=1,350; IC 95%: 1,214-1,501).
ConclusiónLa puntuación alta en las escalas A2DS2 e ISAN son un fuerte predictor de infección respiratoria asociada al ictus agudo en una cohorte consecutiva de pacientes con ictus. Estas escalas son simples de usar y realizar, siendo herramientas prometedoras para la predicción de esta complicación en la práctica habitual.
Between 5% and 40% of acute-phase stroke patients present infections.1–6 Infections, particularly pneumonia, are associated with poorer clinical prognosis and increased mortality.7–10
The risk of infection is fundamentally associated with patients’ clinical status and age11; infections usually occur on day 2-7 after stroke onset.12,13 Patients with more severe stroke and low level of consciousness are more susceptible to infection, and particularly pneumonia, and have a greater risk of aspiration due to loss of the swallowing reflex and their low level of consciousness.11,14–19 Many patients with pneumonia present dysphagia, which favours pulmonary aspiration of material from the oropharynx or stomach.2
Infection affects stroke prognosis in several ways, leading to prolonged immobilisation and greater fragility, and delaying rehabilitation due to extended hospital stays. It also leads to significantly higher healthcare expenses; this is especially true in cases of respiratory infection.3,5,6 An American study found that stroke in patients with pneumonia was associated with an incremental cost of $14836; patients with pneumonia were also significantly more likely to require extended care (odds ratio [OR], 1.73; 95% confidence interval [CI], 1.32-2.26).20
Current guidelines recommend treating infections early, although prophylactic administration of antibiotics is not indicated.21 Clinical trials into whether preventive treatment with antibiotics improves infection rates have not been of sufficient statistical power to demonstrate this assertion.22 Identifying patients at greater risk of acute respiratory infection (ARI) at the time of admission for stroke may be helpful in managing the condition.17,19
Predictive models should be based on relevant, easy-to-access parameters observable in the first 24hours after stroke onset.17 Numerous predictive models have been published in recent years, including the pneumonia score,11 Chumbler score,14 AIS-APS score,16 PANTHERIS score,17 ISAN score,19 and the A2DS2 score.15 The latter 2 scales are particularly simple to use as the necessary data can be gathered systematically upon patients’ admission to the stroke unit. The present study aims to validate the power of the ISAN and A2DS2 scores for predicting ARIs in a cohort of consecutive patients with ischaemic stroke.
MethodsThe study included consecutive patients admitted in 2015 with acute ischaemic stroke confirmed by brain MRI. We excluded patients with transient ischaemic attacks or minor stroke, patients admitted more than 72hours after symptom onset, and patients with signs or symptoms of infection at the time of admission.
Data were gathered on the following variables: (1) demographic variables (age and sex) and vascular risk factors (hypertension, diabetes mellitus, dyslipidaemia, atrial fibrillation, ischaemic heart disease, history of stroke or transient ischaemic attack, history of smoking or alcohol abuse, dementia, and baseline modified Rankin Scale score); (2) stroke severity at admission according to the National Institute of Health Stroke Scale (NIHSS) and presence of dysphagia (determined via screening test or clinical assessment); and (3) prognostic variables (ARI, length of hospital stay, functional status at discharge, and in-hospital mortality).
We used the PANTHERIS study's definition of ARI23; patients were diagnosed with ARI if they presented at least one criteria from lists A and B, as follows: (A) abnormal respiratory examination or pulmonary infiltrates in chest X-rays; (B) productive cough with purulent sputum, microbiological cultures from lower respiratory tract or blood cultures, leucocytosis, or increase in C-reactive protein. We also added the need for antibiotic treatment to this definition. According to our hospital's protocol, antibiotics are not administered as a prophylactic measure against respiratory infection.
The A2DS2 score was calculated as follows: age ≥75 years=1, atrial fibrillation=1, dysphagia=2, male sex=1, NIHSS score of 0-4=0, NIHSS score of 5-15=3, and NIHSS ≥16=5.15 To aid analysis, A2DS2 results were classified as low risk for scores of 0-4 and high risk for scores of 5-10; this classification has been used in other validation studies.18,19
The ISAN score was calculated as follows: age <60 years=0, 60-69=3, 70-79=4, 80-89=6, and ≥90=8; male sex=1; baseline NIHSS score of 0-4=0, NIHSS 5-15=4, NIHSS 16-20=8, and NIHSS ≥21=10; and dependence prior to stroke=2.19 This scale was classified into 4 risk groups: low (0-5), medium (6-10), high (11-14), and very high risk (>14).19
Statistical analysisData are expressed as means±standard deviations (SD), medians with interquartile ranges (IQR), and absolute frequencies with percentages. Continuous variables were analysed with the t test or the Kruskal–Wallis test, and categorical variables were analysed with the chi-square test. A2DS2 score was analysed both as a continuous and as a binary variable. A logistic regression analysis with the prognostic variable “pneumonia” as the binary outcome was used to estimate the raw and adjusted strength of association of the items in the A2DS2 and ISAN scales. The probabilities calculated with the regression model were used to generate the ROC curve; a C-statistic of 0.5 indicates a very poor model, whereas a value of 1 indicates that the model is perfectly able to predict pneumonia during hospitalisation. The Cox and Snell and the Nagelkerke R2 tests were used to assess goodness of fit. All tests were 2-tailed; statistical significance was set at P<.05. Statistical analysis was conducted using SPSS version 19.0.
Ethical approvalThe study was evaluated and approved by our hospital's ethics committee. Patients’ consent was not obtained, but data were completely anonymised and entered into a specific database for the study.
ResultsWe analysed 340 patients; 55 presented at least one of the exclusion criteria. Therefore, the final sample included 285 subjects, of whom 45 (15.8%) had respiratory infections after stroke, according to the established criteria. The mean age of patients in the sample was 71.01±12.26 years. One hundred and seventy-seven patients (62.1%) were male. Seventy-two patients (25.3%) had signs or symptoms of dysphagia, 42 (14.7%) had atrial fibrillation, 14 (4.9%) were in a situation of dependence before the stroke occurred, and median NIHSS score was 4. Stroke aetiology was cardioembolic in 104 cases (36.1%), undetermined in 67 (23.5%), atherosclerotic in 64 (22.5%), lacunar in 43 (15.1%), and of other determined aetiology in 8 (2.8%). Mean A2DS2 and ISAN scores were 3.25±2.54 and 6.49±3.64, respectively. On the A2DS2 scale, 195 patients (74.7%) were classified as low-risk and 72 (25.3%) were classified as high-risk. Table 1 summarises the demographic and clinical characteristics of the study population.
Characteristics of the study population.
| Total | No ARI | With ARI | P | |
|---|---|---|---|---|
| 240 (84.2%) | 45 (15.8%) | |||
| Age | ||||
| Mean (SD) | 71.0 (12.6) | 69.8 (12.9) | 77.6 (8.6) | <.0001 |
| Sex | ||||
| Men | 177 (62.1%) | 147 (61.3%) | 30 (66.7%) | .492 |
| Risk factors | ||||
| Hypertension | 211 (74.0%) | 178 (74.2%) | 33 (73.3%) | .907 |
| Diabetes | 89 (31.2%) | 69 (28.7%) | 20 (44.4%) | .037 |
| Dyslipidaemia | 123 (43.2%) | 100 (41.7%) | 23 (51.1%) | .240 |
| Atrial fibrillation | 42 (14.7%) | 35 (14.6%) | 7 (15.6%) | .866 |
| Ischaemic heart disease | 32 (11.2%) | 27 (11.2%) | 5 (11.1%) | .978 |
| Tobacco use | 65 (22.8%) | 63 (26.2%) | 2 (4.4%) | .006 |
| Alcohol abuse | 22 (7.7%) | 20 (8.3%) | 2 (4.4%) | .605 |
| Previous situation of dependence | ||||
| Modified Rankin Scale score 3-5 | 14 (4.9%) | 12 (5%) | 2 (4.4%) | .874 |
| Severity at admission | ||||
| NIHSS, mean (SD) | 6.13 (5.1) | 5.4 (4.7) | 10.2 (5.5) | <.0001 |
| Swallowing | ||||
| Dysphagia | 72 (25.3%) | 38 (15.8%) | 34 (75.6%) | <.0001 |
| Enteral nutrition | 68 (23.9%) | 35 (14.6%) | 33 (73.3%) | <.001 |
| A2DS2 score | ||||
| Median (IQR) | 2 (1-5) | 2 (1-4) | 6 (5-7) | <.0001 |
| ISAN score | ||||
| Median (IQR) | 7 (4-9) | 5 (4-8) | 9 (8-11) | <.001 |
A2DS2: Age, Atrial fibrillation, Dysphagia, Sex, Stroke Severity; ARI: acute respiratory infection; CI: confidence interval; IQR: interquartile range; ISAN: Independence, Sex, Age, NIHSS; NIHSS: National Institute of Health Stroke Scale; SD: standard deviation.
The incidence rate for ARIs during hospitalisation was 5.1% in the low-risk group and 38.9% in the high-risk group (P<.0001). ARI frequency in the different ISAN risk groups (low, medium, high, and very high) was 4.7%, 22.2%, 28.1%, and 57.1%, respectively (Fig. 1A and B).
 Prognostic probability of respiratory infection during hospitalisation according to the A2DS2 scale. (B) Prognostic probability of respiratory infection during hospitalisation according to the ISAN scale.")
The in-hospital mortality rate was 0.5% among patients with low-risk A2DS2 scores and 7.8% among patients with high-risk scores (P<.002). Mean hospital stay was 6.4 days longer in the high-risk group (95% CI, 4.6-8.1; P<.0001).
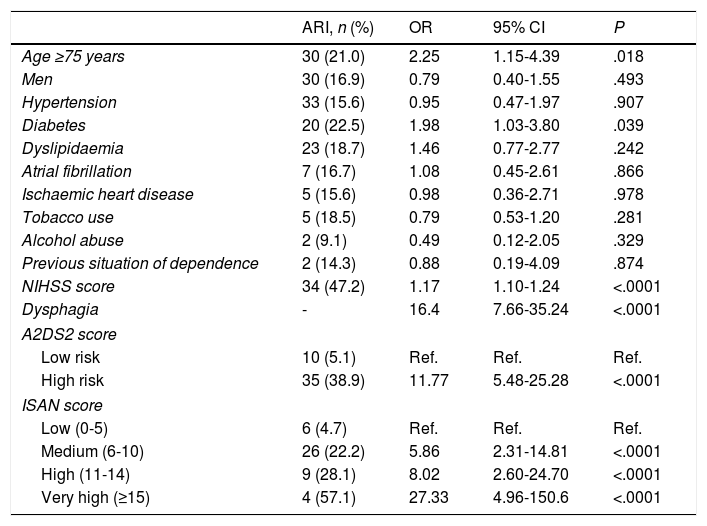
The univariate analysis showed that older age, dysphagia, higher NIHSS score at admission, diabetes mellitus, and higher A2DS2 and ISAN scale scores were risk factors for ARI (Table 2). ARI risk increased with every one-point increase in A2DS2 score (OR, 1.576; 95% CI, 1.363-1.821) and ISAN score (OR, 1.350; 95% CI, 1.214-1.501). Patients in the high-risk A2DS2 group had a significantly greater risk of developing an ARI than those in the low-risk group (OR, 11.773; 95% CI, 5.481-25.288). The ISAN scale showed a significant gradient indicating greater risk of ARI in higher-risk groups compared to the low-risk group, with odds ratios of 5.86 (95% CI, 2.31-14.81), 8.02 (95% CI, 2.60-24.70), and 27.33 (95% CI, 4.96-150.60) for the medium, high, and very high risk groups, respectively.
Univariate analysis of factors associated with stroke-associated respiratory infection.
| ARI, n (%) | OR | 95% CI | P | |
|---|---|---|---|---|
| Age ≥75 years | 30 (21.0) | 2.25 | 1.15-4.39 | .018 |
| Men | 30 (16.9) | 0.79 | 0.40-1.55 | .493 |
| Hypertension | 33 (15.6) | 0.95 | 0.47-1.97 | .907 |
| Diabetes | 20 (22.5) | 1.98 | 1.03-3.80 | .039 |
| Dyslipidaemia | 23 (18.7) | 1.46 | 0.77-2.77 | .242 |
| Atrial fibrillation | 7 (16.7) | 1.08 | 0.45-2.61 | .866 |
| Ischaemic heart disease | 5 (15.6) | 0.98 | 0.36-2.71 | .978 |
| Tobacco use | 5 (18.5) | 0.79 | 0.53-1.20 | .281 |
| Alcohol abuse | 2 (9.1) | 0.49 | 0.12-2.05 | .329 |
| Previous situation of dependence | 2 (14.3) | 0.88 | 0.19-4.09 | .874 |
| NIHSS score | 34 (47.2) | 1.17 | 1.10-1.24 | <.0001 |
| Dysphagia | - | 16.4 | 7.66-35.24 | <.0001 |
| A2DS2 score | ||||
| Low risk | 10 (5.1) | Ref. | Ref. | Ref. |
| High risk | 35 (38.9) | 11.77 | 5.48-25.28 | <.0001 |
| ISAN score | ||||
| Low (0-5) | 6 (4.7) | Ref. | Ref. | Ref. |
| Medium (6-10) | 26 (22.2) | 5.86 | 2.31-14.81 | <.0001 |
| High (11-14) | 9 (28.1) | 8.02 | 2.60-24.70 | <.0001 |
| Very high (≥15) | 4 (57.1) | 27.33 | 4.96-150.6 | <.0001 |
A2DS2: Age, Atrial fibrillation, Dysphagia, Sex, Stroke Severity; ARI: acute respiratory infection; CI: confidence interval; ISAN: Independence, Sex, Age, NIHSS; NIHSS: National Institutes of Health Stroke Scale; OR: odds ratio; Ref.: reference category.
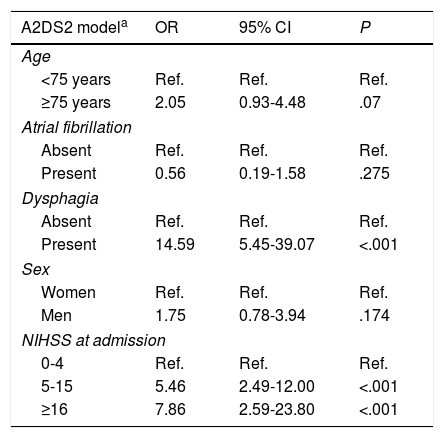
Not all individual predictors of ARI included in the A2DS2 and ISAN scales showed a significant association in the multivariate analysis (Table 3).
Multivariate analysis of models comprising the A2DS2 and ISAN scales.
| A2DS2 modela | OR | 95% CI | P |
|---|---|---|---|
| Age | |||
| <75 years | Ref. | Ref. | Ref. |
| ≥75 years | 2.05 | 0.93-4.48 | .07 |
| Atrial fibrillation | |||
| Absent | Ref. | Ref. | Ref. |
| Present | 0.56 | 0.19-1.58 | .275 |
| Dysphagia | |||
| Absent | Ref. | Ref. | Ref. |
| Present | 14.59 | 5.45-39.07 | <.001 |
| Sex | |||
| Women | Ref. | Ref. | Ref. |
| Men | 1.75 | 0.78-3.94 | .174 |
| NIHSS at admission | |||
| 0-4 | Ref. | Ref. | Ref. |
| 5-15 | 5.46 | 2.49-12.00 | <.001 |
| ≥16 | 7.86 | 2.59-23.80 | <.001 |
| ISAN modelb | OR | 95% CI | P |
|---|---|---|---|
| Age | |||
| >60 | Ref. | Ref. | Ref. |
| 60-69 | 3.12 | 0.52-18.81 | .213 |
| 70-79 | 7.30 | 1.15-34.54 | .012 |
| 80-89 | 9.43 | 1.99-44.58 | .005 |
| >90 | 79.6 | 8.44-751.8 | <.001 |
| Sex | |||
| Women | Ref. | Ref. | Ref. |
| Men | 2.12 | 0.95-4.75 | .065 |
| NIHSS at admission | |||
| 0-4 | Ref. | Ref. | Ref. |
| 5-15 | 6.69 | 2.90-15.46 | <.001 |
| 16-20 | 9.77 | 2.81-33.98 | <.001 |
| ≥21 | 4.13 | 0.21-78.21 | .344 |
| Pre-stroke situation | |||
| Independent | Ref. | Ref. | Ref. |
| Dependent | 1.75 | 0.14-4.07 | .742 |
A2DS2: Age, Atrial fibrillation, Dysphagia, Sex, Stroke Severity; CI: confidence interval; ISAN: Independence, Sex, Age, NIHSS; NIHSS: National Institutes of Health Stroke Scale; OR: odds ratio; Ref.: reference category.
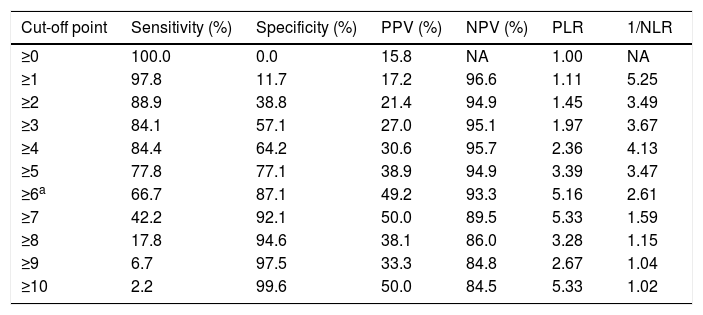
The sensitivity and specificity cut-off points for A2DS2 score in our cohort are shown in Table 4. Given an ARI prevalence of approximately 15%, the optimal cut-off point is 6 points, with a sensitivity of 66.67% (95% CI, 52.07-78.64), specificity of 87.08% (95% CI, 82.25-90.75), a positive predictive value of 49.18% (95% CI, 29.80-68.81), and a negative predictive value of 93.30% (95% CI, 85.52-97.05). The scale has excellent discrimination (area under the ROC curve, 0.803 [95% CI, 0.728-0.878]; P<.0001) and adequate calibration (Cox and Snell R2: 0.153; Nagelkerke R2: 0.263) (Fig. 2).
Discrimination of each score on the A2DS2 scale.
| Cut-off point | Sensitivity (%) | Specificity (%) | PPV (%) | NPV (%) | PLR | 1/NLR |
|---|---|---|---|---|---|---|
| ≥0 | 100.0 | 0.0 | 15.8 | NA | 1.00 | NA |
| ≥1 | 97.8 | 11.7 | 17.2 | 96.6 | 1.11 | 5.25 |
| ≥2 | 88.9 | 38.8 | 21.4 | 94.9 | 1.45 | 3.49 |
| ≥3 | 84.1 | 57.1 | 27.0 | 95.1 | 1.97 | 3.67 |
| ≥4 | 84.4 | 64.2 | 30.6 | 95.7 | 2.36 | 4.13 |
| ≥5 | 77.8 | 77.1 | 38.9 | 94.9 | 3.39 | 3.47 |
| ≥6a | 66.7 | 87.1 | 49.2 | 93.3 | 5.16 | 2.61 |
| ≥7 | 42.2 | 92.1 | 50.0 | 89.5 | 5.33 | 1.59 |
| ≥8 | 17.8 | 94.6 | 38.1 | 86.0 | 3.28 | 1.15 |
| ≥9 | 6.7 | 97.5 | 33.3 | 84.8 | 2.67 | 1.04 |
| ≥10 | 2.2 | 99.6 | 50.0 | 84.5 | 5.33 | 1.02 |
A2DS2: Age, Atrial fibrillation, Dysphagia, Sex, Stroke Severity; NA: not applicable; NLR: negative likelihood ratio; NPV: negative predictive value; PLR: positive likelihood ratio; PPV: positive predictive value.
![ROC curves for the A2DS2 and ISAN scales in the study population. Both scales show excellent discrimination (A2DS2: 0.803 [95% CI, 0.728-0.878]; ISAN: 0.783 [95% CI, 0.731-0.829]).](https://static.elsevier.es/multimedia/21735808/0000003400000001/v1_201901090606/S2173580818301482/v1_201901090606/en/main.assets/gr2.jpeg?xkr=ue/ImdikoIMrsJoerZ+w997EogCnBdOOD93cPFbanNcnxJVYM2BEAEuZ5XZLhi9iOagBjl/fU8SQ2svVlwwuRGxdxLihi91b2G+2lZgkqfwHpySFGqJtLBpq5xJ/B/umOxZWYDYL/0DyFXI39cSVnPYzUuLY+r1Y6K1GJYaaGKTWoAx8A4bn6fbIUFiC6DsLPSt3FwWdAsKiTq2BNOsNnN2K8pMsforOZdBKcEbA2uTNw3IS1UBg+WbV3Yrm2NQIAlVw64PbvPNb/nFvzf3goES6HVfD2iXZQ/0vnxtjx0g= "ROC curves for the A2DS2 and ISAN scales in the study population. Both scales show excellent discrimination (A2DS2: 0.803 [95% CI, 0.728-0.878]; ISAN: 0.783 [95% CI, 0.731-0.829]).")
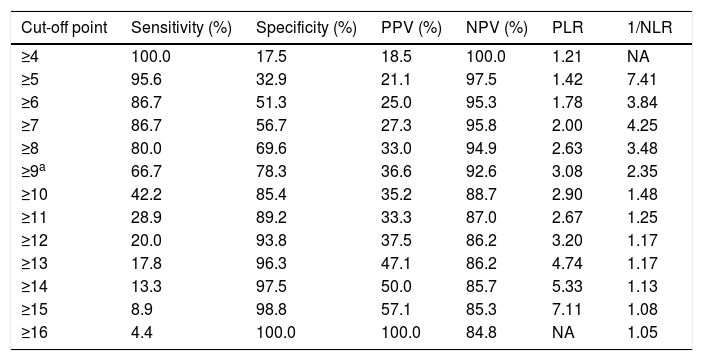
The sensitivity and specificity cut-off points for ISAN score in this cohort are shown in Table 5. Given an ARI prevalence of approximately 15%, the optimal cut-off point is 9 points, with a sensitivity of 66.67% (95% CI, 52.07-78.64), specificity of 78.33% (95% CI, 72.70-83.08), a positive predictive value of 36.59% (95% CI, 21.56-54.77), and a negative predictive value of 92.61% (95% CI, 84.12-96.74). The scale has good discrimination (area under the ROC curve, 0.783 [95% CI, 0.731-0.829]; P<.0001) and adequate calibration (Cox and Snell R2: 0.125; Nagelkerke R2: 0.215) (Fig. 2).
Discrimination of each score on the A2DS2 scale.
| Cut-off point | Sensitivity (%) | Specificity (%) | PPV (%) | NPV (%) | PLR | 1/NLR |
|---|---|---|---|---|---|---|
| ≥4 | 100.0 | 17.5 | 18.5 | 100.0 | 1.21 | NA |
| ≥5 | 95.6 | 32.9 | 21.1 | 97.5 | 1.42 | 7.41 |
| ≥6 | 86.7 | 51.3 | 25.0 | 95.3 | 1.78 | 3.84 |
| ≥7 | 86.7 | 56.7 | 27.3 | 95.8 | 2.00 | 4.25 |
| ≥8 | 80.0 | 69.6 | 33.0 | 94.9 | 2.63 | 3.48 |
| ≥9a | 66.7 | 78.3 | 36.6 | 92.6 | 3.08 | 2.35 |
| ≥10 | 42.2 | 85.4 | 35.2 | 88.7 | 2.90 | 1.48 |
| ≥11 | 28.9 | 89.2 | 33.3 | 87.0 | 2.67 | 1.25 |
| ≥12 | 20.0 | 93.8 | 37.5 | 86.2 | 3.20 | 1.17 |
| ≥13 | 17.8 | 96.3 | 47.1 | 86.2 | 4.74 | 1.17 |
| ≥14 | 13.3 | 97.5 | 50.0 | 85.7 | 5.33 | 1.13 |
| ≥15 | 8.9 | 98.8 | 57.1 | 85.3 | 7.11 | 1.08 |
| ≥16 | 4.4 | 100.0 | 100.0 | 84.8 | NA | 1.05 |
ISAN: Independence, Sex, Age, NIHSS; NA: not applicable; NLR: negative likelihood ratio; NPV: negative predictive value; PLR: positive likelihood ratio; PPV: positive predictive value.
The numerous developments in stroke care in recent years have resulted in clear improvements in disease progression. Despite this, there has been little change in the impact of infection on prognosis, mortality, and healthcare expenses.2,9,20,24 Predicting which patients are at greatest risk is important if we are to provide individualised care; it is also valuable for stratifying patients in trials on preventive treatments.19,21 Several predictive models have been designed to derive and externally validate a scale to predict the clinical risk of pneumonia.11,14–17,19 The A2DS2 and ISAN scales have shown excellent discrimination and calibration in national derivation and validation samples.15,19 The present study aims to externally validate these findings.
We opted to validate these 2 scales due to their predictive usefulness in everyday clinical practice. ARIs are known to develop more frequently in the early days following stroke1; for this reason, prevention strategies should be implemented as soon as possible after hospital admission. These 2 scales have the advantage that the parameters involved are valid, reliable, easily available, and quick to administer in the first 24-48hours after stroke.15,18,19
The A2DS2 scale includes 5 variables: age, atrial fibrillation, dysphagia, male sex, and NIHSS score.15 Only dysphagia varies in terms of measurement and diagnosis. The observed frequency of dysphagia depending upon the diagnostic method used: instrumental assessments (videofluoroscopy or fibre-optic nasolaryngoscopy) detect it at higher rates than screening tests or clinical assessments.25 The protocols used at most stroke units include screening tests that enable reliable measurement of this parameter. Stroke units systematically test for atrial fibrillation; despite the fact that detection rates could be influenced by how frequently each unit performs electrocardiographies, the duration of monitoring, and whether Holter monitoring is used, major variability is not expected.26 The A2DS2 scale showed excellent discrimination and very good calibration for predicting pulmonary infection in our cohort. The ISAN scale is simpler, including only 4 clinical items that are available upon the patient's admission to the emergency department: age, male sex, level of dependence (modified Rankin Scale score) prior to stoke, and NIHSS score.19 The ISAN scale also showed excellent discrimination and good calibration for detecting pulmonary infection in our cohort. Both scales are easily administered and have a low likelihood of inter-observer variation.
Previous studies have identified several factors independently associated with pneumonia during the acute phase of stroke. The strength of association is consistent for age, stroke severity, presence of dysphagia, and altered level of consciousness. In recent years, these and other factors have been incorporated into various scales for stratifying the risk of pneumonia after stroke. In a retrospective cohort study, Chumbler et al.14 propose a scale for predicting stroke-associated pneumonia, taking into account previous history of pneumonia, dysphagia symptoms, NIHSS score, whether the patient was “found down,” and age over 70; although the C-statistic was acceptable, the scale was not externally validated. Kwon et al.11 published a scale including NIHSS score, age, sex, mechanical ventilation, and dysphagia; the scale was derived from a small cohort and has not been validated. The inclusion of intubation as an item would appear not to be helpful in the clinical context in the majority of our patients, as ventilator-associated pneumonia is a discrete entity caused by mechanical ventilation and other risk factors which are substantially different from those associated with infection after stroke.12 Another study showed that the key criteria identifying high risk of infection after stroke are advanced age, presence of dysarthria or aphasia, modified Rankin scale score ≥4, abnormal water swallowing test findings, and low scores in brief cognitive tests.1 This scale requires administration of the Mini-Mental State Examination, which is not a standard or routine practice during admission for stroke.
Respiratory infection is difficult to diagnose as presentation can be somewhat non-specific, patients frequently display non-productive cough, fever may appear without focus of infection, microbiology studies of sputum often yield negative results, and normal chest X-ray findings do not rule out the diagnosis at early stages.27 The use of standardised diagnostic criteria may help ensure a more rigorous approach in the diagnosis of ARIs. We measured lower respiratory tract infection (according to the criteria of the PANTHERIS study23) rather than infection with pulmonary consolidation (pneumonia) only, as we consider this parameter to better fit clinical practice. The inclusion of these criteria probably resulted in higher rates of infection than the pneumonia rates reported in other derivation studies for the validated scales (7.2% for the A2DS2 scale and 6.7% for the ISAN scale15,19). The infection rate observed in our study was also higher than those reported for large Spanish hospital registries, which report pneumonia rates of around 8%.28 However, we believe that our approach prevents subjectivity in the diagnosis of pulmonary infection and underestimation of the prevalence of this complication.
Certain limitations of the study should be mentioned. Firstly, our sample was relatively small for the validation study we performed, meaning that prognostic index values are not available for all possible cases; this does not affect our statistical calculations, however. Secondly, as this study was based on derivation studies, certain baseline variables that may influence the risk of pneumonia were not recorded or included in the models. These include the use of stroke prevention drugs with potential to increase the risk of infection, vital signs, clinical symptoms, laboratory data, stroke location (anterior or posterior circulation), and aetiological subtype. Finally, dysphagia was not assessed using instrumental techniques, and was not defined according to a single criterion; dysphagia is not assessed in the first 24hours after stroke, as patients are kept on an absolute diet during this period.
In conclusion, high A2DS2 and ISAN score is a strong predictor of acute stroke-associated respiratory infection in a cohort of consecutive patients with stroke. These scales are quick and easy to administer and are promising for the prediction of this complication in everyday practice.
FundingThis study was made possible by a research grant awarded by the Health Service of Extremadura.
Conflicts of interestThe authors have no conflicts of interest to declare.
Please cite this article as: Ramírez-Moreno JM, Martínez-Acevedo M, Cordova R, Roa AM, Constantino AB, Ceberino D, et al. Validación externa de las escalas A2DS2 e ISAN para predecir la infección respiratoria asociada al ictus isquémico. Neurología. 2019;34:14–21.
