


High-growth businesses are a relevant phenomenon for economies as they represent an important driver for economic growth and an efficient allocation of resources that can be inductive of wealth creation. Despite the importance that has been given to this phenomenon, inequalities regarding the ability to trigger and manage the entrepreneurial activity remain. In light of previous research, where perceptions of specialists from different countries through the Global Entrepreneurship Monitor (GEM) were analyzed, this research aims to describe and account for the entrepreneurship levels, particularly those influencing the high growth of the businesses. In order to compare, real data contrasts the experts’ perceptions confirming the conclusions found through the analysis of the firms across different countries.
In order to achieve this goal, our database combines country data from three databases, namely: OECD database; EUROSTAT database and HOFSTEDE database; in which observations from more than 35 countries was subjected to several multivariate analysis techniques, in particular the multiple linear regression analysis.
In general, our results show that the high growth of business is positively related to the size of firms, the power distance index and negatively related to masculinity.
For a long time, academic, policy makers and business practitioners have sought for growth both on a macroeconomic and a microeconomic level. As such, growth is not only sought as a constant and sustainable growth, but rather high growth rates have been sought. Therefore, understanding the conditions necessary to achieve high growth rates or the mechanisms that allow business to grow more are of significant importance and deserve the attention of the academy.
Mason and Brown (2010), Amat, Renart, and Garcia (2013) or Marchese (2016) are just examples of the importance of the high-growth business phenomenon in the literature and where their importance for the formulation of policies is addressed. Georgallis and Durand (2017: p. 487) refer the importance of public policies for supporting the high-growth business to the extent that “producers’ growth is positively linked to policy generosity, and negatively linked to policy discontinuity […] corporate-backed ventures are less affected by policy generosity compared to entrepreneurial startups, and less impacted by policy discontinuity as well”. Other papers were able to demonstrate the importance of high-growth business through the channel of public efforts for its promotion, demonstrating that exploring the growth rates of business is pertinent and relevant. In addition, it is not clear that there is a single pattern of high-growth business across different countries and this justifies the study of cross-countries differences on the high growth business and on how they are perceived by the economic agents. The economic effect of the proliferation of the high-growth businesses justifies its relevance for the economic decision making practice and, therefore, it justifies the academic and scientific relevance in an attempt to provide evidence that may further support public policy.
In line with such arguments, the aim of this paper is to explore the determinants of high growth firms, in particular the dimensions previously surveyed by Braga, Queirós, Correia, and Braga (2017), carrying out a statistical study, using multivariate analyses, in particular, multiple linear regression for a database based on three databases: OECD database; EUROSTAT database and HOFSTEDE database.
An analysis to the literature on the topic returns that there is a significant heterogeneity of measurement instruments, variables and databases. While, in many cases, the literature on high-growth business contribute with insights on public policy measures to promote such forms of entrepreneurship, others use perceptions as measurement. Our contribution reflects on real data for observed measures, including less orthodox approaches, such as the cultural dimension.
After a brief literature review and the description of the methodology employed in this research, the study is divided into two linear regression analyses that include two dependent variables that are measured differently. Our paper concludes with a summary of the findings and suggestions for further research in this area.
Literature reviewThis section presents several scientific contributions, which study high-growth firms, in particular, presenting approaches concerning the variables and characteristics influencing their performance. In previous work, Braga et al. (2017) described and accounted for entrepreneurship levels, particularly in order to understand what leads certain countries’ individuals to display higher levels of initiative to manage or create a high-growth business. In order to achieve this goal, a research program that includes annual assessments of entrepreneurial activity levels in several countries has been used – The Global Entrepreneurship Monitor (GEM), which is, currently, one of the main international research databases aiming to describe, analyze and compare the entrepreneurial process in a wide range of countries. Their research used the 2011 NES (National Expert Survey) database. Their study identified perceptions concerning competencies, size, culture, resources and government policies as associated with the entrepreneur's perception of “In my country, many people know how to start and manage a high-growth business”.
Our goal is to study if, with real data for firms (instead of perceptions of entrepreneurs), the same conclusions are achieved.
Size and ageAccording to Alex Coad and Werner Holzl Gibrat's stochastic model of firms growth led to what is known as Gibrat's Law, which holds that firm growth rates are independent of firm size (Holzl & Werner, 2010). Gibrat's law is often observed to fail, under closer examination, because of a negative dependence of growth rates on size: smaller and younger firms have expected higher growth rates than older and larger firms (Mansfield, 1962; Oulton, 1996). Given the close relationship between firm size and firm age, researchers have also considered the effect of firm age on expected growth rate. A firm's age has also been observed to have an influence on its growth, with the majority of studies reporting that older firms experience slower growth (Evans, 1987; Hughes, 1994). Lotti, Santarelli, and Vivarelli (2010) show that Gibrat's law cannot be rejected once they account for learning and selection processes of younger and/or smaller firms (Vivarelli, 2007).
There are a significant number of empirical studies showing a significant negative relationship between growth and firm size and between the variability in growth and the firm size (Calvo, 2006; Mansfield, 1962; Mengistae, 1999). Previously, it has been verified that there is a close relationship between the size and age of the firm leading to the first and second research hypotheses arise: In microeconomic terms it makes sense to consider the age of firms but as our approach is macroeconomic and, therefore, it does not make sense to consider age. Taking into account the previous arguments, our first research hypothesis is:H1 Size firms influence their growth rates.
According Holzl (2009), a number of theoretical models have stated a positive relationship between innovation and firm growth. Empirical work on the firm-level innovation has investigated these processes, usually measuring innovation in terms of R&D expenditure, number of patents, or in terms of responses to innovation questionnaires such as the CIS surveys. Empirical work on the matter has shown difficulties confirming the theoretical findings. On average, innovation does not impact much on firm growth, and some studies fail to find a significant effect of innovation on subsequent growth of sales (Bottazzi, Dosi, Lippi, & Riccaboni, 2001; Geroski & Walters, 1997).
One possible explanation for this lack of empirical confirmation can be the growth rate distributions. It has been observed that the average firm does not show high levels of growth and so it might not be useful to search for the determinants of growth of the average firm. Instead our approach goes beyond the average, looking into the determinants of growth for the fastest growing firms. Empirical results from quantile regressions have shown that, while innovation has a limited impact on the sales growth rates of average firms, it is more important for the fastest-growing firms (Coad, 2008; Goedhuys, 2009; Holzl, 2009; Stam, 2009). This characterization of the relationship between innovation and firm growth is consistent with the characterization of innovation as a highly uncertain activity, with the returns to innovation being remarkably unequal (some firms benefit greatly from innovation while many others are less fortunate). Another aspect of the relationship between innovation and firm growth concerns the phenomenon of technological unemployment – innovative firms display a lower demand for labor because they apply new technologies (such as robots) to reduce their labor requirements. The aggregate analysis of the impact of technical change on employment is, however, risky. There may well be many indirect feedback effects operating through numerous ‘substitution channels’ – for instance, new technologies may lead to changes in employment elsewhere in the economy (upstream sectors), and they may affect demand by lowering prices, or increasing wages and investment (Holzl & Werner, 2010).
Investigations at the firm-level have, generally, found a positive influence of innovation on employment growth (Holzl & Werner, 2010). Many authors have found useful to distinguish between product innovation, which is usually associated with employment creation via increased demand, and process innovation, which is often characterized as labor saving. While process innovation is usually found to be associated with employment growth at the firm-level, the effect of process innovation is less clear, being associated with job destruction in some cases (Hall, Lotti, & Mairesse, 2008; Harrison, Jaumandreu, Mairesse, & Peters, 2005).
Several authors emphasize the role of innovation as a driver of superior performance of firms (e.g. Cobbenhagen, 2000; Tidd, 2001). Chaney, Devinney, and Winer (1991) add that innovation is responsible for corporate success, while Cobbenhagen (2000) shows that there is little disagreement amongst economists about the importance of innovation on economic growth (Chaney et al., 1991).
Aiming to explore, through real data, how innovative firms influence their growth, our second research hypothesis is:H2 Innovation firms influence their growth rates.
A large number of theoretical models assume that the more profitable firms will grow while less profitable firms will decline. In this view, selection pressures operate to redistribute market share to the more profitable firms. In fact, one would expect that profitable firms have not only the means to finance expansion, but also the motivation to grow, since they can obtain a larger amount of profits from a larger sales base (Holzl & Werner, 2010). In addition, it has been observed that, while profit rates are heterogeneous across firms, they display a high degree of persistence (Dosi, 2007; Mueller, 1977), while firm growth rates do not display much persistence. This leads to question the expected relationship between profits and growth (Geroski & Mazzucato, 2002). Further investigation, based on regression analysis, has generally shown that firm growth rates cannot be explained in terms of financial performance, whether the latter is measured in terms of profit rates (Bottazzi, Secchi, & Tamagni, 2008; Coad, 2007) or growth rates of the amount of profits (Coad & Rao, 2010). While there may be a statistically significant relationship between the two, the magnitude of the effect is so low that it would be a valid approximation to view the two variables as independent. Furthermore, advanced econometric techniques also show that profits have a negligible causal effect on firm growth rates (Coad, 2007). Instead, it appears that growth has more of a positive effect on profits, than does profits on growth (Coad, 2007, 2010).
National cultureGeert Hofstede conducted one of the most comprehensive studies of how values in the workplace are influenced by culture. He defines culture as “the collective programming of the mind distinguishing the members of one group or category of people from others” (Hofstede, 1991). During 1978–83, he conducted detailed interviews with hundreds of IBM employees in 53 countries. Through standard statistical analysis of large data sets, he determined patterns of similarities and differences among the replies. From this data analysis, he developed five dimensions of culture (Hofstede, 1991). In the 1990s, Hofstede published results of his research, initially he developed four dimensions in culture, but added a fifth dimension in 1991.
In the 2000s, research by Minkov (2007) using data from the World Values Survey allowed a new calculation of the fifth, and the addition of a sixth dimension (Hofstede, Hofstede, & Minkov, 2010). The six dimensions are: Power Distance, related to the different solutions to the basic problem of human inequality; Uncertainty Avoidance, related to the level of stress in a society in the face of an unknown future; Individualism versus Collectivism, related to the integration of individuals into primary groups; Masculinity versus Femininity, related to the division of emotional roles between women and men; Long Term versus Short Term Orientation, related to the choice of focus for people's efforts: the future or the present and past; Indulgence versus Restraint, related to the gratification versus control of basic human desires related to enjoying life (Hofstede, 2011).
As found in the Hofstede study, each country has been positioned relative to other countries through a score on each dimension. The dimensions are statistically distinct and do occur in all possible combinations, although some combinations are more frequent than others. After the initial confirmation of the country differences in IBM in data from management trainees elsewhere, the Hofstede dimensions and country scores were validated through replications, using the same or similar questions with other cross-national populations. Between 1990 and 2002 six major replications (14 or more countries) used populations of country elites, employees and managers of other corporations and organizations, airline pilots, consumers and civil servants (Hofstede, 2011).
Power Distance has been defined as the extent to which the less powerful members of organizations and institutions (like the family) accept and expect that power is distributed unequally. It suggests that a society's level of inequality is endorsed by the followers as much as by the leaders. Power and inequality, of course, are extremely fundamental facts of any society. All societies are unequal, but some are more unequal than others (Hofstede, 2011).
Uncertainty Avoidance is not the same as risk avoidance; it deals with a society's tolerance for ambiguity. It indicates to what extent a culture programs its members to feel either uncomfortable or comfortable in unstructured situations. Unstructured situations are novel, unknown, surprising, and different from usual. Uncertainty avoiding cultures try to minimize the possibility of such situations by strict behavioral codes, laws and rules, disapproval of deviant opinions, and a belief in absolute truth (Hofstede, 2011).
Individualism on the one side versus its opposite, Collectivism, as a societal, not an individual characteristic, is the degree to which people in a society are integrated into groups. On the individualist side we find cultures in which the ties between individuals are loose: everyone is expected to look after him/herself and his/her immediate family. On the collectivist side we find cultures in which people from birth onwards are integrated into strong, cohesive in-groups, often extended families (with uncles, aunts and grandparents) that continue protecting them in exchange for unquestioning loyalty, and oppose other ingroups.
Masculinity versus its opposite, Femininity, again as a societal, not as an individual characteristic, refers to the distribution of values between the genders which is another fundamental issue for any society, to which a range of solutions can be found. The IBM studies revealed that women's values differ less among societies than men's values; men's values from one country to another contain a dimension from very assertive and competitive and maximally different from women's values on the one side, to modest and caring and similar to women's values on the other. The assertive pole has been called ‘masculine’ and the modest, caring pole ‘feminine’ (Hofstede et al., 2010).
The dimension Long-Term versus Short-Term Orientation turned out to be strongly correlated with recent economic growth. As none of the four IBM dimensions was linked to economic growth, obtain Bond's permission to add his dimension as a fifth to four (Hofstede & Bond, 1998).
Lastly, the sixth and new dimension, it was also based on recent World Values Survey items and is more or less complementary to Long-versus Short-Term Orientation; in fact, it is weakly negatively correlated with it. It focuses on aspects not covered by the other five dimensions, but known from literature on “happiness research”. Indulgence stands for a society that allows relatively free gratification of basic and natural human desires related to enjoying life and having fun. Restraint stands for a society that controls gratification of needs and regulates it by means of strict social norms (Hofstede, 2011).
Some societies are unequal, but the degree of inequality varies considerably. Power can also be distributed unevenly and thus influence the high growth of business. In line with this argument, our third hypothesis has tried to explore the impact of Power Distance on the firm growth rates:H3 Power Distance influences businesses’ growth rates.
As referred Hofstede (2011) uncertainty avoiding cultures try to minimize the possibility of uncomfortable situations. We aim to explore how uncertainty avoiding culture influence the growth of firms, thus, the fourth research hypothesis is:H4 Uncertainty avoiding culture influences businesses’ growth rates.
In Hofstede's (1991) study, one of the influential cultural values in the workplace was individualism. Our aim is to verify the impact of individualism on the growth rates of firms. The fifth research hypothesis is, thus:H5 Individualism influence businesses’ growth rates.
A crucial question in any society is the distribution of values between genders, in this sense, Hofstede (2010) suggests masculinity as a social characteristic. Therefore, our aim is to understand to what extent such characteristic influences the growth rates of firms.H6 Masculinity influence businesses’ growth rates.
Hofstede (1998) presented the dimension Long-Term Orientation as an aspect correlated to economic growth. Thus, it is aimed to verify the impact of this variable on the growth rates of firms through the following investigation hypothesis:H7 Long-Term Orientation influence businesses’ growth rates.
Finally, based on Hofstede's (2011) study, it was aimed to verify if the dimension Indulgence, suggested by the author, influences the growth rates of the firms.
Therefore, the last research hypothesis is as follows:H8 Indulgence influence businesses’ growth rates.
In order to reach the proposed objective, a set of research hypotheses was formulated that relate the firm growth rates, with several variables (independent). Our goal is to study if these variables (size and age; innovation and growth; profits and growth; and national culture) increase or refrain the creation of new high-growth businesses.
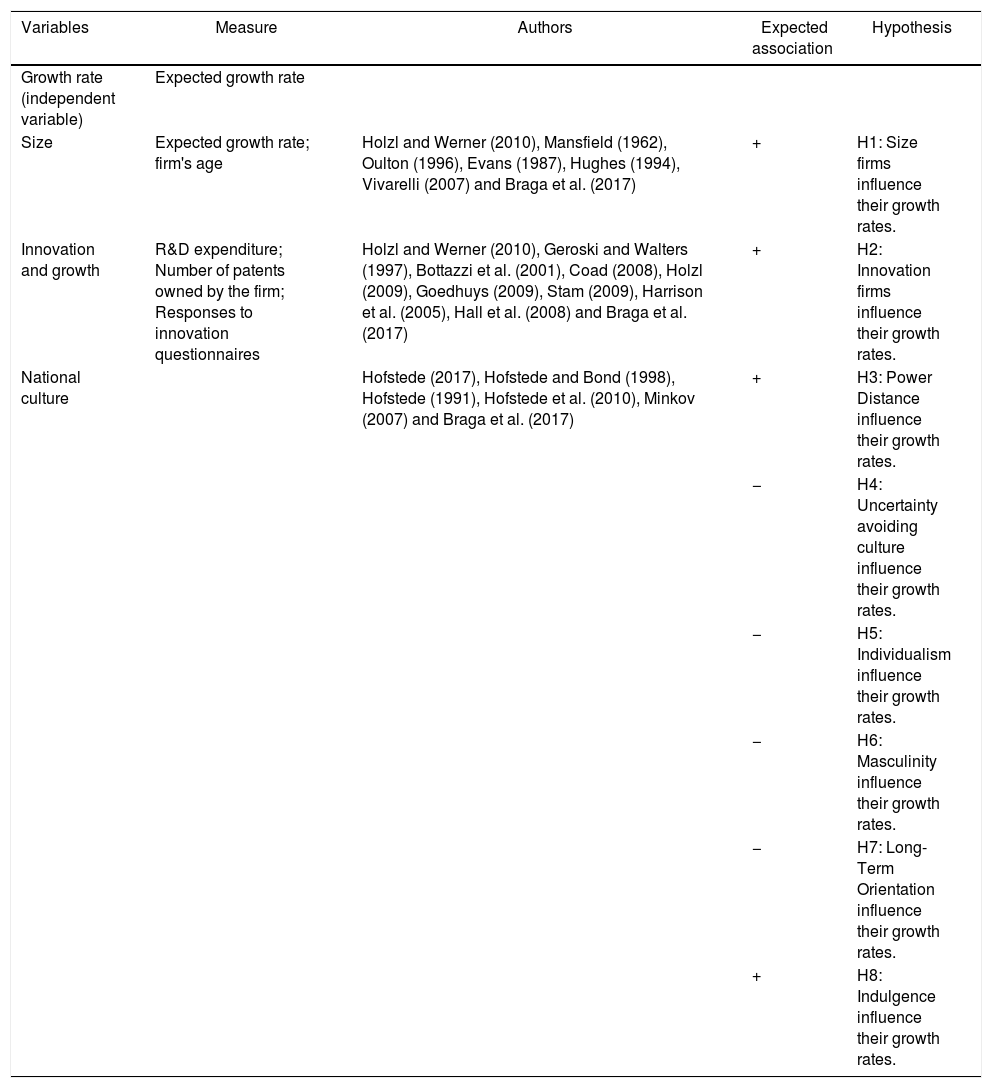
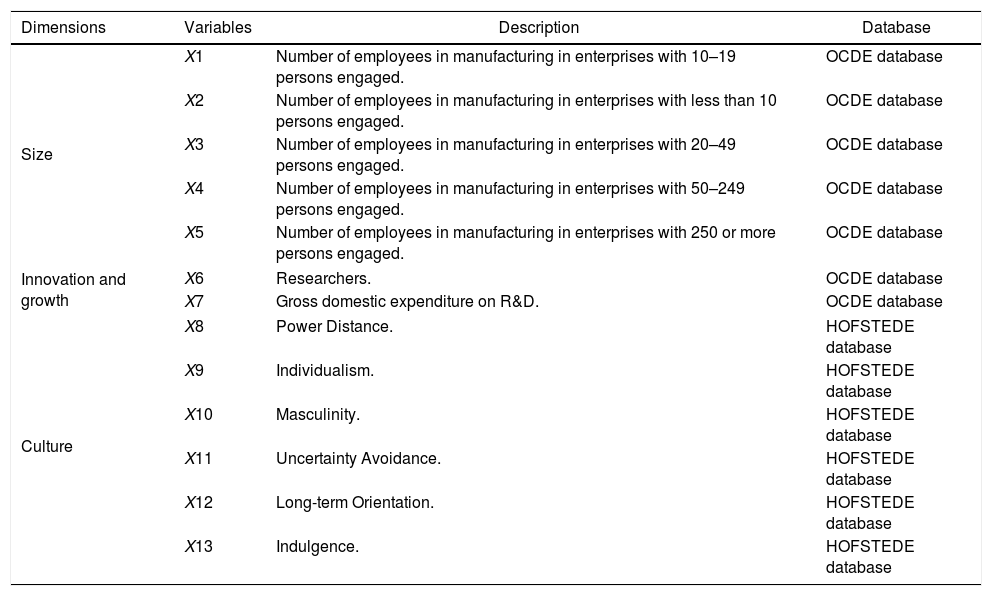
Table 1 presents a summary of the literature as well as the measurement used by the various authors in their studies. Table 2 provides an overview of the databases used to perform the statistical analysis displayed in the subsequent chapter.
Independent variables and expected association.
| Variables | Measure | Authors | Expected association | Hypothesis |
|---|---|---|---|---|
| Growth rate (independent variable) | Expected growth rate | |||
| Size | Expected growth rate; firm's age | Holzl and Werner (2010), Mansfield (1962), Oulton (1996), Evans (1987), Hughes (1994), Vivarelli (2007) and Braga et al. (2017) | + | H1: Size firms influence their growth rates. |
| Innovation and growth | R&D expenditure; Number of patents owned by the firm; Responses to innovation questionnaires | Holzl and Werner (2010), Geroski and Walters (1997), Bottazzi et al. (2001), Coad (2008), Holzl (2009), Goedhuys (2009), Stam (2009), Harrison et al. (2005), Hall et al. (2008) and Braga et al. (2017) | + | H2: Innovation firms influence their growth rates. |
| National culture | Hofstede (2017), Hofstede and Bond (1998), Hofstede (1991), Hofstede et al. (2010), Minkov (2007) and Braga et al. (2017) | + | H3: Power Distance influence their growth rates. | |
| − | H4: Uncertainty avoiding culture influence their growth rates. | |||
| − | H5: Individualism influence their growth rates. | |||
| − | H6: Masculinity influence their growth rates. | |||
| − | H7: Long-Term Orientation influence their growth rates. | |||
| + | H8: Indulgence influence their growth rates. |
Summary.
| Dimensions | Variables | Description | Database |
|---|---|---|---|
| Size | X1 | Number of employees in manufacturing in enterprises with 10–19 persons engaged. | OCDE database |
| X2 | Number of employees in manufacturing in enterprises with less than 10 persons engaged. | OCDE database | |
| X3 | Number of employees in manufacturing in enterprises with 20–49 persons engaged. | OCDE database | |
| X4 | Number of employees in manufacturing in enterprises with 50–249 persons engaged. | OCDE database | |
| X5 | Number of employees in manufacturing in enterprises with 250 or more persons engaged. | OCDE database | |
| Innovation and growth | X6 | Researchers. | OCDE database |
| X7 | Gross domestic expenditure on R&D. | OCDE database | |
| Culture | X8 | Power Distance. | HOFSTEDE database |
| X9 | Individualism. | HOFSTEDE database | |
| X10 | Masculinity. | HOFSTEDE database | |
| X11 | Uncertainty Avoidance. | HOFSTEDE database | |
| X12 | Long-term Orientation. | HOFSTEDE database | |
| X13 | Indulgence. | HOFSTEDE database | |
This research strategy has allowed to construct a composite database, where the variables collected from the three databases were combined.
MethodologyIn this study, we applied the multivariate statistical analysis tools to study the Organisation for Economic Co-operation and Development that OECD Countries covered include Australia, Austria, Belgium, Canada, Chile, Czech Republic, Denmark, Estonia, Finland, France, Germany, Greece, Hungary, Iceland, Ireland, Israel, Italy, Japan, Korea, Luxembourg, Mexico, Netherlands, New Zealand, Norway, Poland, Portugal, Slovak Republic, Slovenia, Spain, Sweden, Switzerland, Turkey, the United Kingdom, and the United States. Non-OECD countries include Brazil, China, India, Indonesia, Russia, and South Africa.
The OECD database includes information on a range of issues to assist governments to foster prosperity and fight poverty through economic growth and financial stability. It aims to help ensure the environmental implications of economic and social development are taken into account (OECD.Stat, 2017).
The OECD Factbook provides indicators selected from more than 40 OECD statistical databases for all OECD member countries and, when available and considered internationally comparable, for Brazil, India, Indonesia, the People's Republic of China, the Russian Federation and South Africa. The country statistical profiles provide a broad selection of indicators, illustrating the demographic, economic, environmental and social developments, for each of the 35 OECD members, and the Russian Federation. The dataset also covers the five key partner economies with which the OECD has developed an enhanced engagement program (Brazil, China, India, Indonesia and South Africa) (OECD.Stat, 2017). Topics covered include population and migration; production; household income, wealth and debt; globalization, trade and foreign direct investment (FDI); prices, interest rates and exchange rates; energy and transportation; labor, employment and unemployment; science and technology including research and development (R&D); environment including natural resources, water, air and climate; education resources and outcomes; government expenditures, debt, revenues, taxes, foreign aid; and, health status, risk and resources (OECD.Stat, 2017). In total, it presents 447 subject that complement the aforementioned topics covered and it includes population and migration; production; household income, wealth and debt; globalisation, trade and foreign direct investment (FDI); prices, interest rates and exchange rates; energy and transportation; labor, employment and unemployment; science and technology including research and development (R&D); environment including natural resources, water, air and climate; education resources and outcomes; government expenditures, debt, revenues, taxes, foreign aid; and, health status, risk and resources (OECD.Stat, 2017).
The data provided by Geert Hofstede was also used. It was developed between 1967 and 1973, and has performed a large survey of the national subsidiaries of a multinational corporation: compared to the answers of 117,000 IBM matched employees on the same attitude survey in different countries. Initially, it focused his on the 40 largest countries, and then extended it to 50 countries and 3 regions.
Finally, the Eurostat database was used, with over 4600 datasets containing more than 1.2 billion statistical data values, and covers all areas of European society (Eurostat, 2017). This database covers about 32 countries including the 28 EU member states as well as 4 EFTA Countries (Switzerland, Iceland, Liechtenstein and Norway).
With the multivariate linear regression, it is aimed to study which variables influence the high growth rates of firms. To meet this goal, one can use a linear regression model considering growth rate as the dependent variable. Given the limited number of countries in each database, the combination of two databases allowed using a larger number of observations, but it required using two linear multivariate models (given differences in the measurement of the two databases) for which the dependent variables were defined as follows:
Dependent variable: OCDEHighGrowth – which will be named as “variable y1” refers to rate of high growth enterprises (20% or higher growth based on employment): number of high growth enterprises as a percentage of the population of active enterprises with at least 10 employees of firms in countries, available in the OCDE site (OECD.Stat, 2017).
Dependent variable: EUROSTATHighGrowth – which will be named as “variable y2” refers to the share of high-growth enterprises measured in employment: number of high-growth enterprises divided by the number of active enterprises with at least 10 employees, i.e. high growth enterprises (growth by 10% or more) and related employment of firms in countries, available in the EUROSTAT site.
The choice of dependent variables to be considered in the analysis was based on the hypothesis formulated. Thus, all variables are related to the dimensions under analysis: size and age, Innovation and growth and National Culture, as summarized in Table 2.
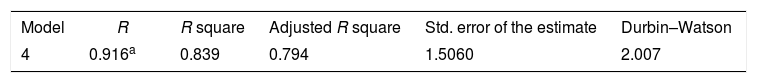
Results and discussionHigh Growth firms in OCDE data countriesInitially, a linear regression was performed with the dependent variable y1 (OCDEHighGrowth) in which the coefficients of the final model are presented in Table 4. This model, obtained using the stepwise method with all the variables in Table 3, displays an adjusted R square of, approximately, 79% representing the expected percentage of the total variability in the level of high growth firms explained by the significant independent variables.
Model summary OCDE.
| Model | R | R square | Adjusted R square | Std. error of the estimate | Durbin–Watson |
|---|---|---|---|---|---|
| 4 | 0.916a | 0.839 | 0.794 | 1.5060 | 2.007 |
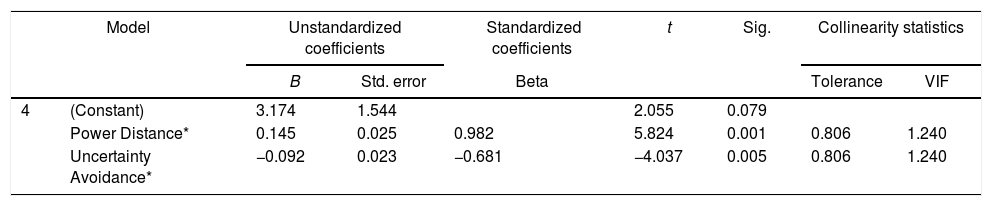
It can be observed, in Table 4, that only Power Distance and Uncertainty Avoidance, are related with National Culture, and significant to explain the variation of the dependent variable – high growth level of firms in countries – available in the OCDE website. According to Table 4, the model can be written as below:

Coefficients OECD.
| Model | Unstandardized coefficients | Standardized coefficients | t | Sig. | Collinearity statistics | |||
|---|---|---|---|---|---|---|---|---|
| B | Std. error | Beta | Tolerance | VIF | ||||
| 4 | (Constant) | 3.174 | 1.544 | 2.055 | 0.079 | |||
| Power Distance* | 0.145 | 0.025 | 0.982 | 5.824 | 0.001 | 0.806 | 1.240 | |
| Uncertainty Avoidance* | −0.092 | 0.023 | −0.681 | −4.037 | 0.005 | 0.806 | 1.240 | |
The analysis of standardized regression coefficients, in Table 4, shows that the variable X8 – Power Distance is the one with the higher relative contribution to explain the dependent variable, i.e., the variable that most influences the growth rates of countries, and the influence is positive, therefore the greater the Power Distance the greater is the growth rate of firms in the country. This leads us to conclude that a power distance in the society implies a high growth in firms.
On the other hand X11 – Uncertainty Avoidance negatively influences the growth rates of firms in the countries. Thus H3 and H4 could be verified.
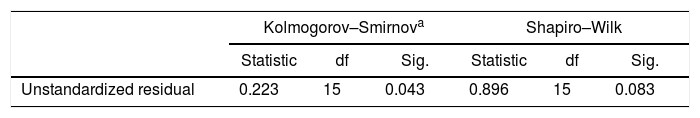
Validation of assumptions of the linear regression modelLinear regression application assumes that errors follow a normal distribution with zero mean and constant variance and that they are independent. Our analysis included normal probability plot, a scatterplot and leverage graphic, and, in order to validate the assumption of normality, the one-sample Kolmogorov–Smirnov and Shapiro–Wilk tests were used (Table 5).
Tests of normality OCDE.
| Kolmogorov–Smirnova | Shapiro–Wilk | |||||
|---|---|---|---|---|---|---|
| Statistic | df | Sig. | Statistic | df | Sig. | |
| Unstandardized residual | 0.223 | 15 | 0.043 | 0.896 | 15 | 0.083 |
The Kolmogorov–Smirnov results shows that there is statistical evidence for rejecting the hypothesis that the residual variable follows a normal distribution, for a significance level of 5% as the p-value=0.043. Furthermore the Shapiro–Wilk test shows a different result, with a p-value=0.083>0.05, then one can assume the normality hypothesis.
A residual analysis is included in summary of the model, Table 3, where Durbin–Watson's statistics displays the value 2.007 and therefore is expected that the residuals are uncorrelated.
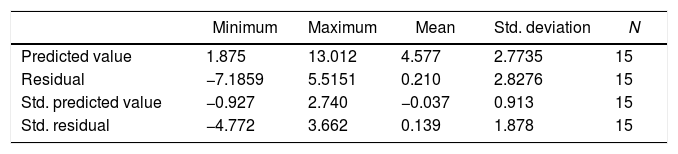
Table 6 shows the maximum and minimum values of residual and the values of the standard predicted values, suggesting the inexistence of outliers
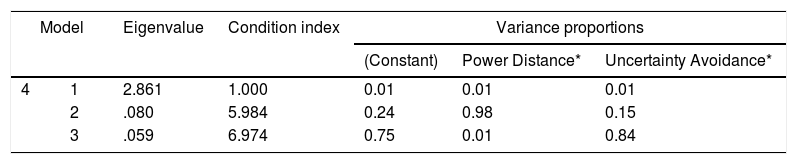
When the independent variables are highly correlated to each other (multicollinearity), the analysis of the adjusted regression model can be confusing. The values for tolerance and for Variance Inflation Factor (VIF), for each independent variable show that there is statistical evidence to support the absence of multicollinearity, because tolerance values are not around zero and the VIF values are smaller than 5.
Table 7 shows the variance proportions, the eigenvalues and the condition indexes. It is possible to observe that there is no indications of multicolinearity, since there is no null eigenvalues, neither condition indexes greater than 15. The variance proportions can indicate some problems, and this may be a limitation of the model.
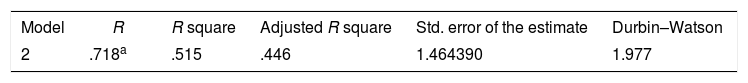
High Growth firms in countries considering Eurostat dataThe second linear regression was performed with the dependent variable y2 (EUROSTATHighGrowth).
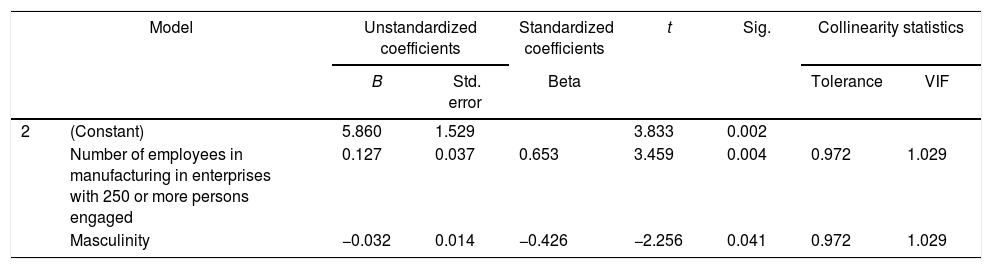
The coefficients of the final model were presented in Table 8. This model displays an adjusted R square of, approximately, 45%, representing the expected percentage of the total variability of the level of high growth firms explained by the significant independent variables. It can be observed, in Table 9, that only Number of employees in manufacturing in enterprises with 250 or more persons engaged and Masculinity are significant to explain the variation of the dependent variable high growth level of firms in countries, available in the Eurostat site. According to Table 9, the model can be written as below:

Coefficients Eurostat.
| Model | Unstandardized coefficients | Standardized coefficients | t | Sig. | Collinearity statistics | |||
|---|---|---|---|---|---|---|---|---|
| B | Std. error | Beta | Tolerance | VIF | ||||
| 2 | (Constant) | 5.860 | 1.529 | 3.833 | 0.002 | |||
| Number of employees in manufacturing in enterprises with 250 or more persons engaged | 0.127 | 0.037 | 0.653 | 3.459 | 0.004 | 0.972 | 1.029 | |
| Masculinity | −0.032 | 0.014 | −0.426 | −2.256 | 0.041 | 0.972 | 1.029 | |
The analysis of standardized regression coefficients, in Table 9, shows that the X5 – Number of employees in manufacturing in enterprises with 250 or more persons engaged variable is that which shows a higher relative contribution to explain the dependent variable. Thus, there are statistical evidences to validate hypothesis H1: Size firms influence their growth rates. On the other hand, Masculinity negatively influences the growth rates of firms. Thus H1 and H5 are verified.
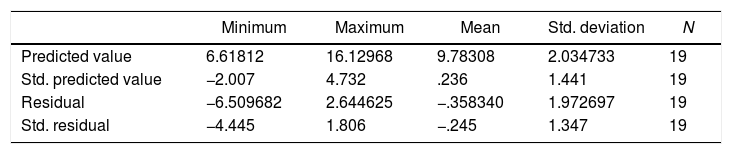
Validation of assumptions of the linear regression modelKolmogorov–Smirnov and Shapiro–Wilk tests allow validating the assumption of normality, for a significance level of 5% because for the Kolmogorov–Smirnov test the p-value equals 0.200. In the summary, in Table 8, Durbin–Watson's test displays the value 1.997 and therefore one can expect that the residuals are uncorrelated. Table 10 shows the maximum and minimum values of residuals and the values of the standard predicted values, which suggest the inexistence of outliers.
The values of tolerance and VIF, Table 8, for each independent variable show that there is statistical evidence to support the absence of multicollinearity, because tolerance values are not around zero and the VIF values are less than 5.
Similar to the previous model, the eigenvalues and the condition indexes do not indicate existence of multicolinearity, since there is no null eigenvalues, neither condition indexes greater than 15. The variance proportions can indicate some problems, and this may be a limitation of the model.
In general, the results were as follows:
- -
Only the variables Power Distance and Uncertainty Avoidance can be related with National Culture, as others are not statistically significant to explain the variation of the dependent variable high growth level of firms, available in the OCDE site.
- -
Power Distance shows a higher relative contribution to explain the dependent variable, i.e., it is the variable that mostly influences the growth rates of countries (positively).
- -
Uncertainty Avoidance negatively influences the growth rates of firms in the countries. This has allowed to verify H3 and H4.
- -
The Eurostata data shows that only the Number of employees in manufacturing in enterprises with 250 or more persons engaged and Masculinity are significant to explain the variation of the dependent variable, but the Number of employees in manufacturing in enterprises with 250 or more persons engaged is the one that most contributes to the explanation of the high growth of businesses. Thus, there are statistical evidence to validate the hypothesis H1: Size firms influence their growth rates.
- -
H5 is also verified, as Masculinity negatively influences the growth rates of firms.
These results allow to verify H1, H3, H4, and H5. This confirms the literature that suggests that the growth of firms is influenced by their size. In addition, high growth firms prevail in countries is influenced by power distance; uncertainty avoidance; and individualism. Such findings suggest that there is a certain cultural environment that is conducive to growth, and in cultures where these conditions are met it seems to exist a higher prevalence for high-growth business. Therefore, our results suggest that high-growth firms seem to find their conditions in countries where there are low levels of masculinity; small levels of uncertainty avoidance and higher power distance. These results are, to some extent, coincident with the literature on entrepreneurship and support that taking risks and power distance provide the conditions for the growth of businesses. The remaining hypothesis could not be confirmed.
Conclusions and future researchThe main objective of this paper was to explore the contribution of certain dimensions studied in previous research. In particular, we have analyzed the literature the size and age of the companies, as well as the contribution of innovation and growth and the well-known study of Geert Hofstede to explain the high growth businesses.
One important contribution of this paper is to relate power distance in the society with high growth in firms, showing a statistically significant relationship. On the other hand, Uncertainty Avoidance influences negatively the growth rates of firms in the countries, as well, there is a negative relation with Masculinity because it negatively influences the high growth of the business.
This paper sheds light on an important aspect of economic growth, and it is expected that it raises interests in the academy, in the governmental policy and amongst entrepreneurs, because it exploits real data of three databases with great impact in the measures adopted by the different countries associated, includes information on the range of issues to help governments foster prosperity and fight poverty through economic growth and financial stability.
One of the main limitations of this study is the heterogeneity in the measurement of the variables found in the databases and used in the statistical analyses. Such limitation did not allow basing the empirical results on one single database with a larger number of observations, but rather it had to be based into two smaller databases. This limitation may have impacted on the significance of the different variables, and, as a consequence, other variables could have shown statistical significance for a higher number of observations.
In addition to our contribution, further research may explore the same relationships on an individual country basis, in order to test if different relationships may emerge from the data (in this case a higher number of observations may be found). This is based on the fact that the national economic environment may be conducive to further growth, while in others limitations may be found. It is important to note that the institutional and legal framework may help explaining such differences, but mostly the expectations of the economic agents may contribute with significant insights.