


Research in behavioral finance has shown that holidays affect investor sentiment, which in turn affects stock market returns and stock prices. These studies have focused on the relationship between holidays and stock prices and stock market returns, but little attention has been paid to how investor sentiment actually changes during holidays. This paper investigates the dispositional effects of holidays on investor sentiment using social media messages from stock market investors and natural language processing techniques. We analyze the changes in investor sentiment that occur during holidays by using trading hours as a control sample and holidays as a treatment sample. The results of the study indicate that the stock market moves from the trading session into any form of holiday period, leading to an elevation in investor sentiment, demonstrating the therapeutic effect of holidays on investor sentiment. However, the therapeutic effect of holidays on investor sentiment diminishes as the holiday proceeds and manifests a hygienic effect. The hygienic effect of holidays on investor sentiment is evidenced by the fact that they do not significantly boost investor sentiment, but they can maintain a certain level of investor sentiment. This study has important implications for people's understanding of holidays in the stock market as well as for stock market policy making.
Investor sentiment is known to affect stock prices and stock market returns (Baker & Wurgler, 2006; Neal & Wheatley, 1998). Many studies show that investor sentiment is closely associated with holidays (Bialkowski et al., 2012; Yang, 2016). These studies correlate holidays, investor sentiment, and returns (Al-Khazali, 2014; Pantzalis & Ucar, 2014). Scholars usually assume that holidays, special events resulting from holidays, or holidays resulting from special events affect investor sentiment. However, few have focused on how investor sentiment changes during an ordinary or even a short holiday caused by a normal trading day's lunchtime closure. Therefore, in this study, we examine the dispositional effect of holidays on investor sentiment using trading hours as the control sample and treating non-trading hours as holidays with the idea of causal inference. This study has significant consequences for the public's understanding of holidays in the stock market and the formulation of stock market policy.
Teng and Liu (2013) found that the mean pre-holiday returns of major stock market indices in Taiwan are statistically significantly higher than the mean non-holiday returns. Many other studies have also documented trading anomalies during weekdays, months, the beginning of the year, and holidays (Andrade et al., 2013; Bampinas et al., 2016; Yang, 2016). Changes in investor sentiment have been found to be a potential explanation for these anomalies (Chiah & Zhong, 2019, 2021). However, people seem willing to correlate only with investor sentiment, holidays, and returns. Little attention has been paid to what happens to investor sentiment during holidays. This is the focus of the present study. We capture the true sentiment of individual investors to understand how this sentiment changes during holidays.
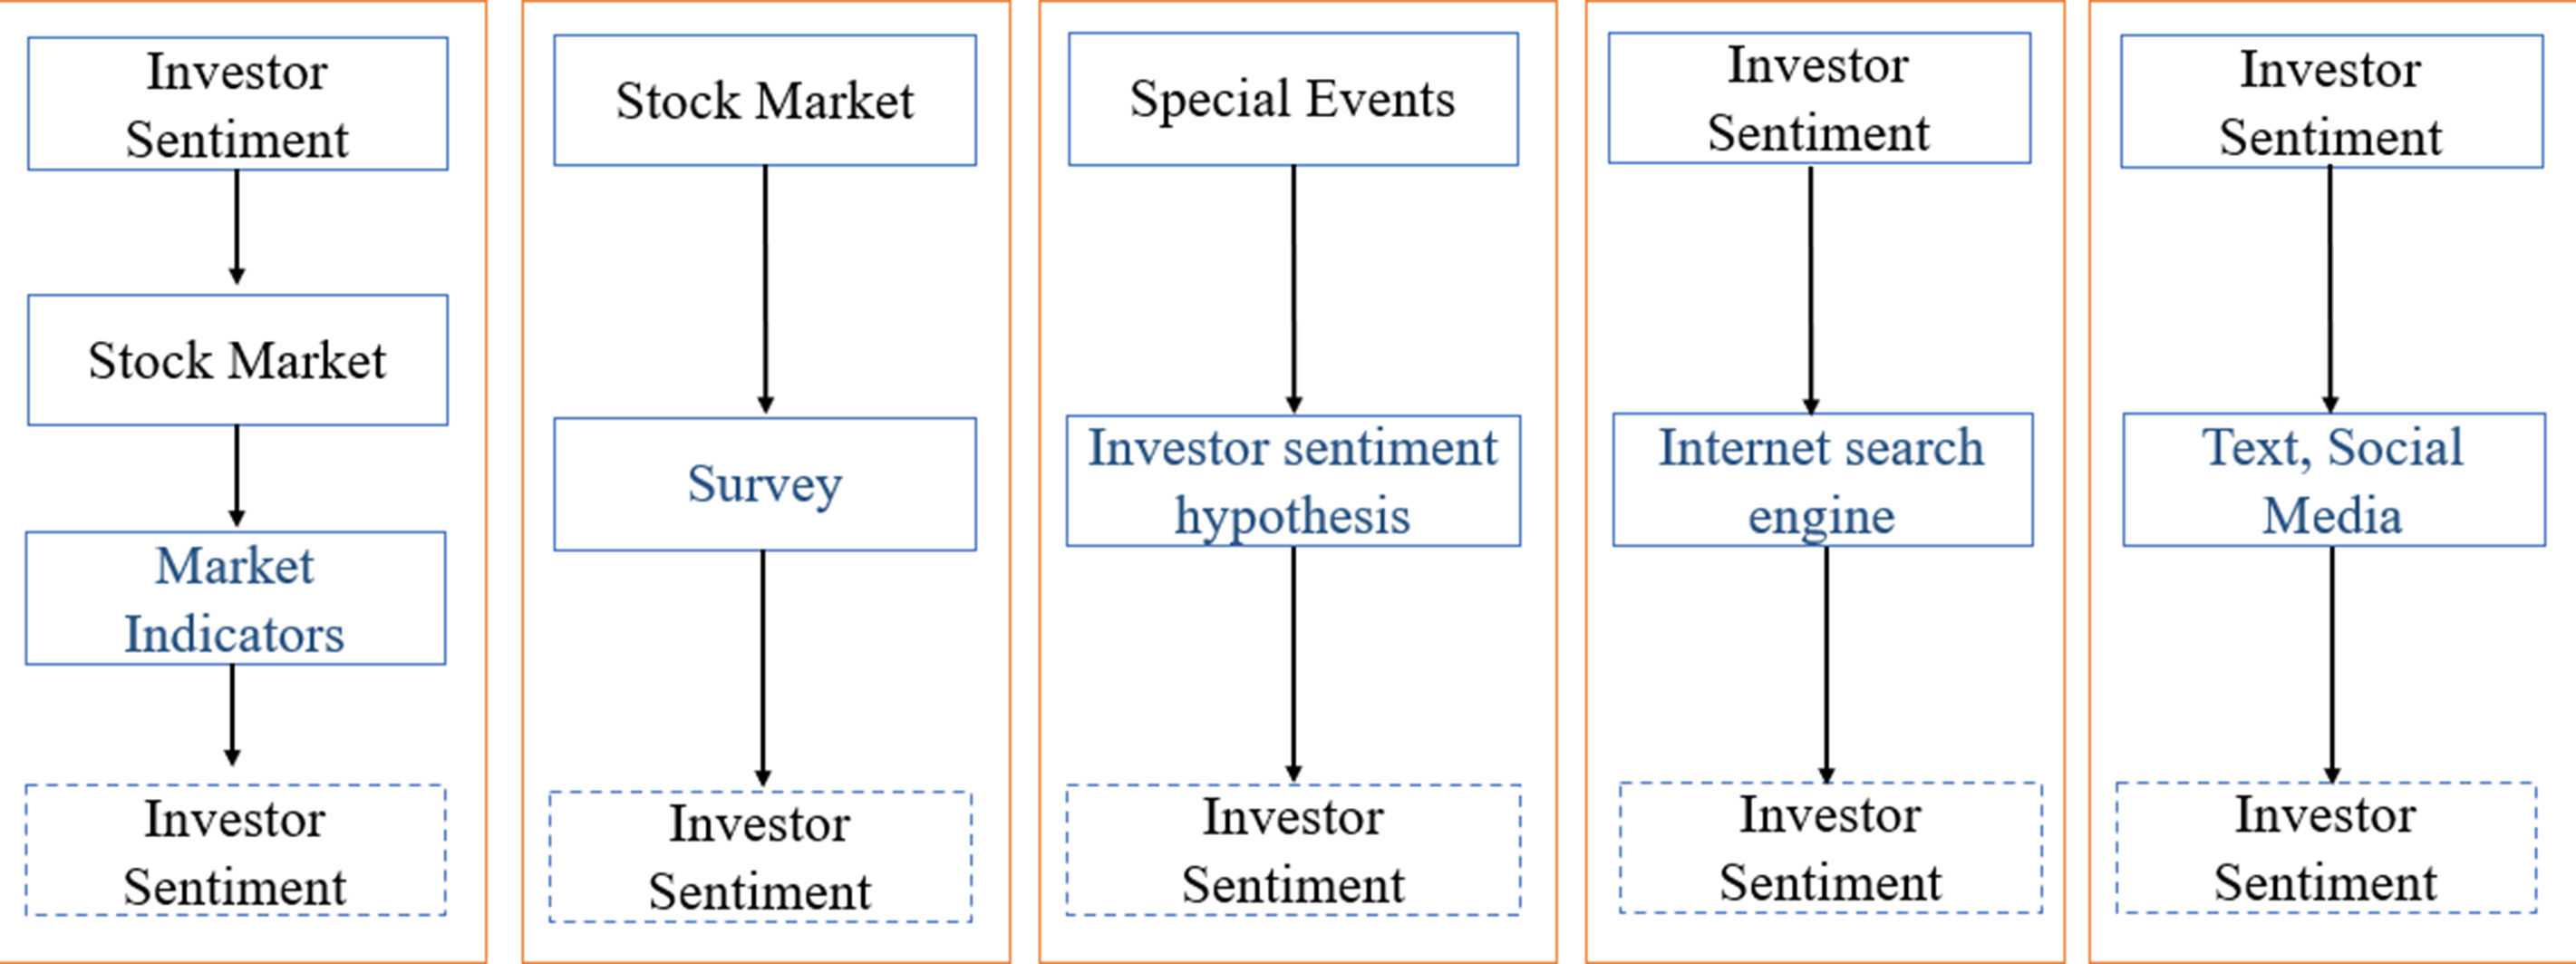
A sentiment is complex and difficult to measure. Baker and Wurgler (2007) argued, "The question is no longer whether investor sentiment affects stock prices, but how to measure investor sentiment and quantify its effects." Researchers do not have direct access to investor sentiment but often require a certain medium. As shown in Fig. 1, scholars typically use market indicators (Baker & Wurgler, 2007), event background sentiment hypotheses (Naseem et al., 2021), search engine indicators (Trichilli et al., 2018), text (McGurk et al., 2020), and social media data (Wang et al., 2022) as mediators to uncover investor sentiment. When different sentiment proxy approaches are used to determine investors’ feelings, the results are not always the same.

Based on market indicators, the sentiment proxy approach assumes that investor sentiment is mirrored in the market. This means that market sentiment is taken as investor sentiment. This approach directly uses market indicators as proxies for sentiment, such as trading volume (Duong et al., 2022), closed-end fund discounts (Lee et al., 1991), and first-day returns (Aissia, 2014). Alternatively, market sentiment is obtained through targeted surveys of market indicators such as the Consumer Confidence Index (Brown & Cliff, 2005), the UBS/GALLUP Investor Optimism Index (Lemmon & Portniaguina, 2006), and the Investment Newsletter (Qiu & Welch, 2004).
The survey-based sentiment proxy approach quantifies investor sentiment by collecting investors' optimistic or pessimistic expectations of the stock market through a survey. However, this sentiment proxy approach suffers from two intractable problems. First, survey-based sentiment indices are resource-intensive, and survey costs are high. Second, data are provided infrequently, usually at monthly and annual frequencies (Mao et al., 2011). Based on the hypothesis of the event background, the sentiment agency method usually takes the general sentiment caused by special events as the basic hypothesis of investor emotion. Coronavirus disease 2019 (COVID-19) is perhaps the most recent example (Sun et al., 2021). Compared to other methods, the sentiment proxy method based on search engines can be used more often and has a stronger link to investor sentiment.
However, investor sentiment obtained using either proxy is only a statistical representation of the data indicators. Perhaps this is why scholars use "investor sentiment" but rarely use "investor emotions." These complex proxies of investor sentiment are not expressions of individual investors' emotions but only statistical indicators. Thus, there is an "information asymmetry" between the market and investors (Ali, 2018). Text-based social media proxies for investor sentiment can address these problems. Stock market fundamentals affect investor sentiment, which spreads on social media (Paris et al., 2015; Stieglitz & Dang-Xuan, 2013). These investor sentiments dispersed on social media can be quantified using natural-language-processing (NLP) techniques to obtain more direct and effective investor sentiments (Arbieu et al., 2021; Hirschberg & Manning, 2015). Investor sentiment, obtained from social media, is not fundamentally different from natural human sentiment.
Golder and Macy (2011) used data from millions of public Twitter messages to determine individual-level emotional rhythms in global culture. They found that after waking up, people's emotions worsen as the day progresses. This finding is consistent with the effects of sleep and circadian rhythms. People are happier on weekends, but the morning peak of a positive mood is delayed by two hours, suggesting that people sleep later on weekends. Hong and Wang (2000) showed that closed markets produce rich patterns of temporal variation in trading and returns. Notably, the works of Golder and Macy (2011) and Hong and Wang (2000) inspired our study. Does investor sentiment deteriorate as a result of trading hours? Does investor sentiment also improve as a result of entering the holiday season? Does investor sentiment generate rich patterns of change during the holiday season? In this study, we address these questions.
This study uses the crawling technique to obtain investor messages on social media between January 1, 2019, and December 31, 2021. We use a convolutional neural network model to classify investor messages into three categories: "positive," "neutral," and "negative" according to the strength of their confidence in the stock market. The Investor Confidence Index (ICI) is a visual representation of investor sentiment on social media. It is almost indistinguishable from Twitter-based personal sentiment in Golder and Macy's (2011) analysis. We use reliable NLP techniques and a sample size of more than 2.66 million to examine how investor sentiment changes during the holiday season from a causal inference point of view.
This study comprehensively examines the impact of short-term trading closures, holiday weekends, and atypical holidays on investor sentiment. It also discusses two aspects—data statistics and causal inference—to ensure that credible analytical results are obtained. The main findings are as follows:
- (1)
Investor sentiment quickly worsens when trading hours start and improves during any kind of holiday (when trading is not going on).
- (2)
When the length of holidays exceeds a certain point, they no longer have the same impact on investor sentiment. Instead, random swings in sentiment due to other external factors become the main factor that influences investor sentiment fluctuations.
- (3)
Owing to the specificity of each individual investor and holiday, the uniform threshold that determines the therapeutic and hygienic effects of holidays is not uniform. This resulted in three statistically significant effects of holidays on investor sentiment: therapeutic, therapeutic and hygienic in parallel, and hygienic.
Overall, we find that holidays produce two dispositional effects on investor sentiment: therapeutic and hygienic effects. The former elevates investor sentiment, whereas the latter maintains investor sentiment at a certain level of "optimism." This study has important implications for understanding holidays and policymaking in the stock market.
The rest of the paper is organized as follows. Section 2 describes the hypotheses, data, and methodology used in this study. Section 3 examines the characteristics of investor sentiment during holidays statistically. Section 4 further argues for the dispositional effect of holidays on investor sentiment, using recent advances in machine learning in the field of causal inference. Finally, Section 5 concludes the study.
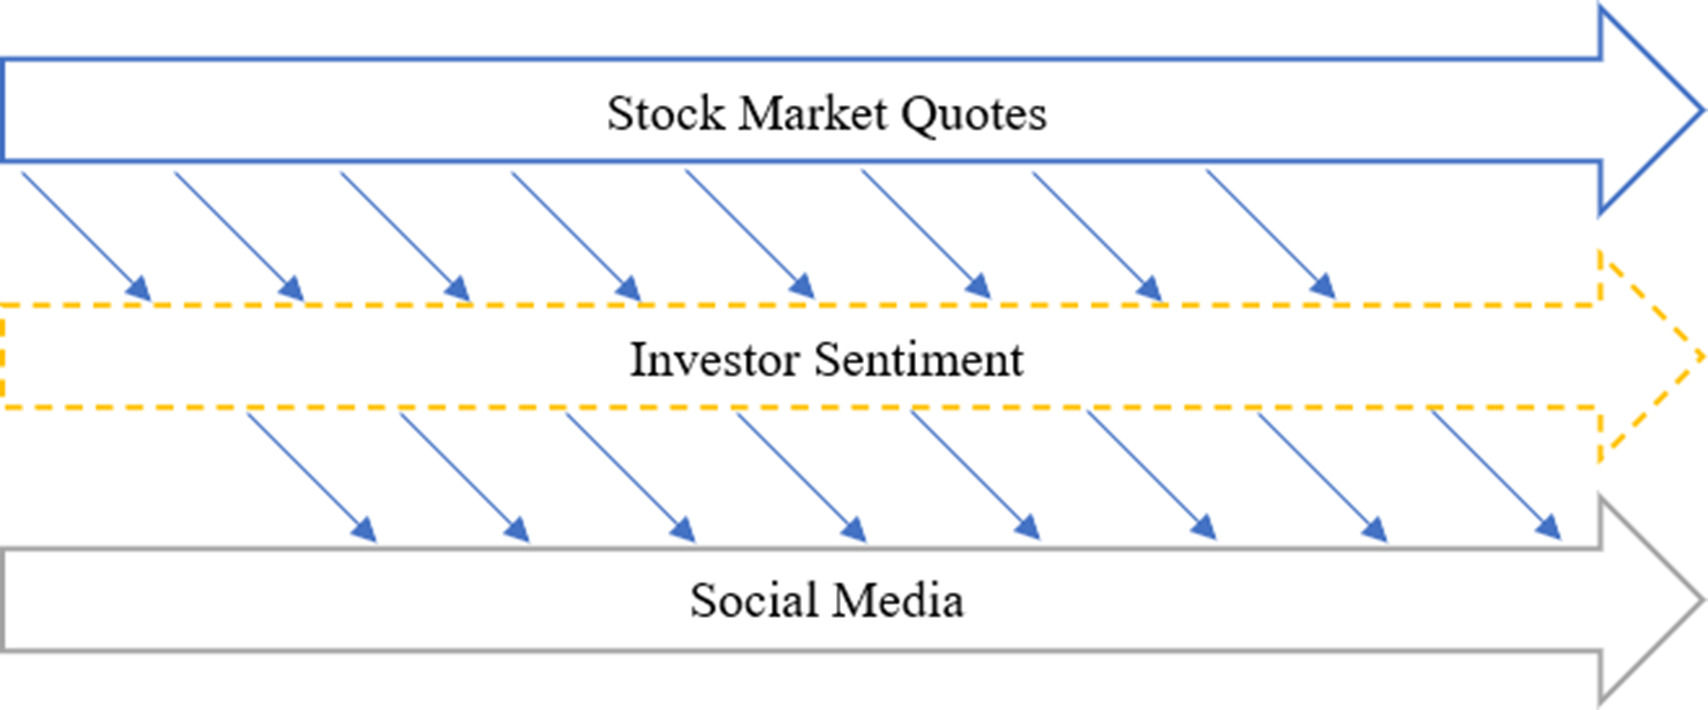
Hypotheses, data, and methodologyResearch hypothesesBaker and Wurgler (2007) defined investor sentiment as a belief in future cash flows and investment risk. As shown in Fig. 2, investors' assessment of future cash flows and investment risk in the stock market is derived from fundamental judgments about past and current stock markets. Stock market fundamentals affect investor sentiment, which spreads on social media (Paris et al., 2015; Stieglitz & Dang-Xuan, 2013). Deng et al. (2022) reported that investor sentiment could be used to predict the stock market direction. Tetlock (2007) and Piñeiro-Chousa et al. (2016) found that social media sentiment correlates with the stock market. Bordino et al. (2012) also reported a positive effect of online sentiment on stock prices. Based on these facts, we propose the first hypothesis of this study.

H1:Stock prices, returns, and social media sentiment are correlated.
Hong and Wang (2000) found that market closures generate rich patterns of variation in trading and returns. We refer to the time following the market closure as a holiday. Based on H1, we believe that holidays following market closures also have a significant effect on investor sentiment. Golder and Macy (2011) used data from millions of public Twitter messages to examine individual-level changes in sentiment on social media. They found that people's emotions deteriorated as the day progressed and that people are happier on weekends than on weekdays. Therefore, does investor sentiment worsen when the stock market opens? Will it improve with the holiday approaching? The second hypothesis of this study is based on this speculation.
H2:The opening of the stock market will lead to a deterioration in investor sentiment, whereas on holidays, investor sentiment will significantly improve. Holidays have therapeutic effects on investor sentiment.
Human emotions can be altered by daily activities, such as daily work, commuting, and eating (Fisher & Ashkanasy, 2000; Oatley & Duncan, 1994; Trampe et al., 2015). This complexity leads to an accurate measurement of mood rhythms at the individual level, which is difficult to achieve. However, in daily life, people's positive and negative mood fluctuations can be described statistically (Golder & Macy, 2011). H2 also suggests that the opening of the stock market worsens investor mood and that holidays have a therapeutic effect on investor mood. This leads us to our third hypothesis.
H3:Cyclical opening and closing of the stock market result in statistically regular swings in investor sentiment.
Herzberg proposed the famous two-factor theory in 1959 (Alshmemri et al., 2017; Kelso & Hetter, 1967). This theory is mainly used to explain the level of job motivation and job satisfaction. Herzberg believes that some factors can increase employee satisfaction and motivate employees to work, while other factors do not promote employee satisfaction but only prevent employee dissatisfaction; these are called hygiene factors (Naquin & Holton, 2003).
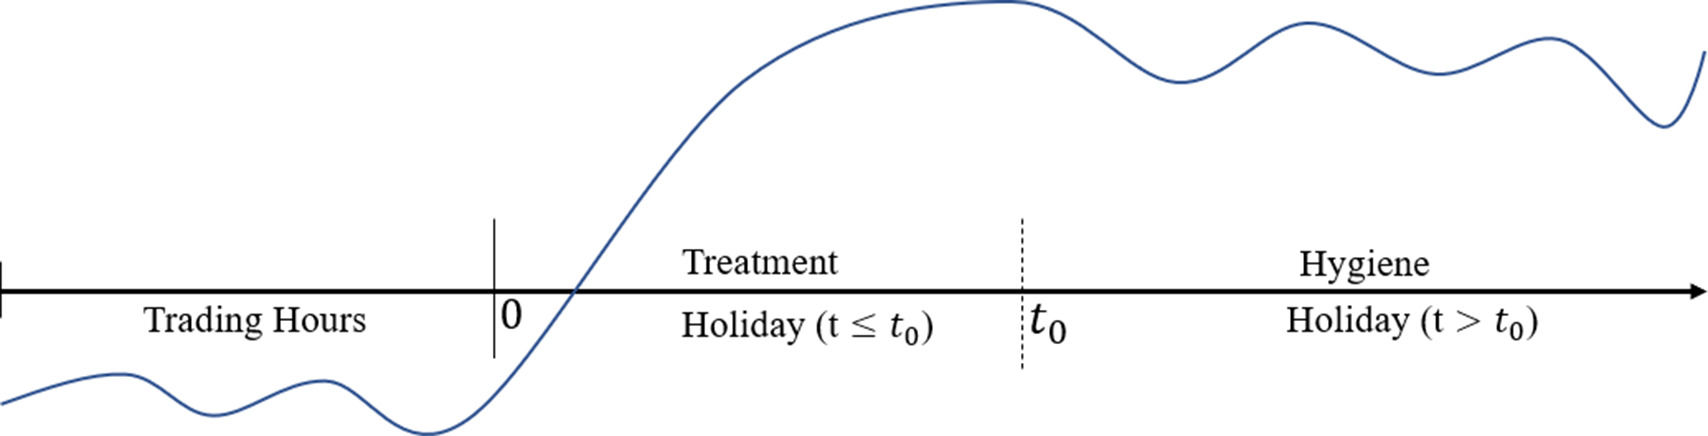
H2 states that investor sentiment is significantly elevated during holidays and that holidays have a therapeutic effect on investor sentiment. However, sustaining an increase in investor sentiment is difficult. As the length of a holiday increases, investor sentiment is influenced by an increasing number of extraneous factors. These extrinsic factors may be public factors that affect all investors or private factors related to a particular investor's personal life and work (Fisher & Ashkanasy, 2000; Nezlek & Kuppens, 2008). Each of these factors may lead to greater divergence or agreement in opinion, resulting in a “random walk” of investor sentiment (Barberis, 1998). As shown in Fig. 3, we argue that holidays do not have a therapeutic effect on inward investor sentiment over longer periods. For a particular holiday, fluctuations in investor sentiment become unpredictable when it exceeds a certain threshold. However, investor sentiment can remain significantly higher than investor sentiment during trading hours because of the absence of a direct stimulus from the stock market. Drawing on Herzberg's two-factor theory, we argue that the effect of holidays on investor sentiment is transformed from therapeutic to hygienic when the length of holidays exceeds a certain range. Thus, investor sentiment stays elevated during the trading session, but the elevation is no longer significant. Based on the above analysis, the fourth hypothesis of this study is proposed.

H4:The dispositional effect of holidays on investor sentiment transforms from a therapeutic to a hygienic effect when holiday length exceeds a certain threshold.
The COVID-19 pandemic has affected all aspects of people's lives, including education (Pokhrel & Chhetri, 2021), the economy (Brodeur et al., 2021, p19), daily life (Haleem et al., 2020), politics (Kavanagh et al., 2020), and the environment (Kuzemko et al., 2020). Recent studies suggest that COVID-19 similarly affects investor sentiment and, thus, financial markets (Albaity et al., 2022; Hoang & Syed, 2021; Huang & Zheng, 2020; J. Piñeiro-Chousa et al., 2022). Indeed, many scholars consider the special event context itself a potential emotional expression (Liu, Zhou, et al., 2022). For example, Duong et al. (2022) documented the persistence of anomalous idiosyncratic volatility in the Vietnamese stock market before the pandemic. However, the idiosyncratic volatility anomaly disappeared during the pandemic period. Messaoud et al. (2021) also reported that the relationship between overall sentiment and liquidity varies over time. We have reason to believe that the COVID-19 pandemic impacted the dispositional effect of holidays on investor sentiment, but we do not believe that its impact can shake H2 and H4. This leads to the fifth hypothesis.
H5:The COVID-19 outbreak affected the disposition effect of holidays on investor sentiment but did not overturn the underlying assumptions of H2 and H4.
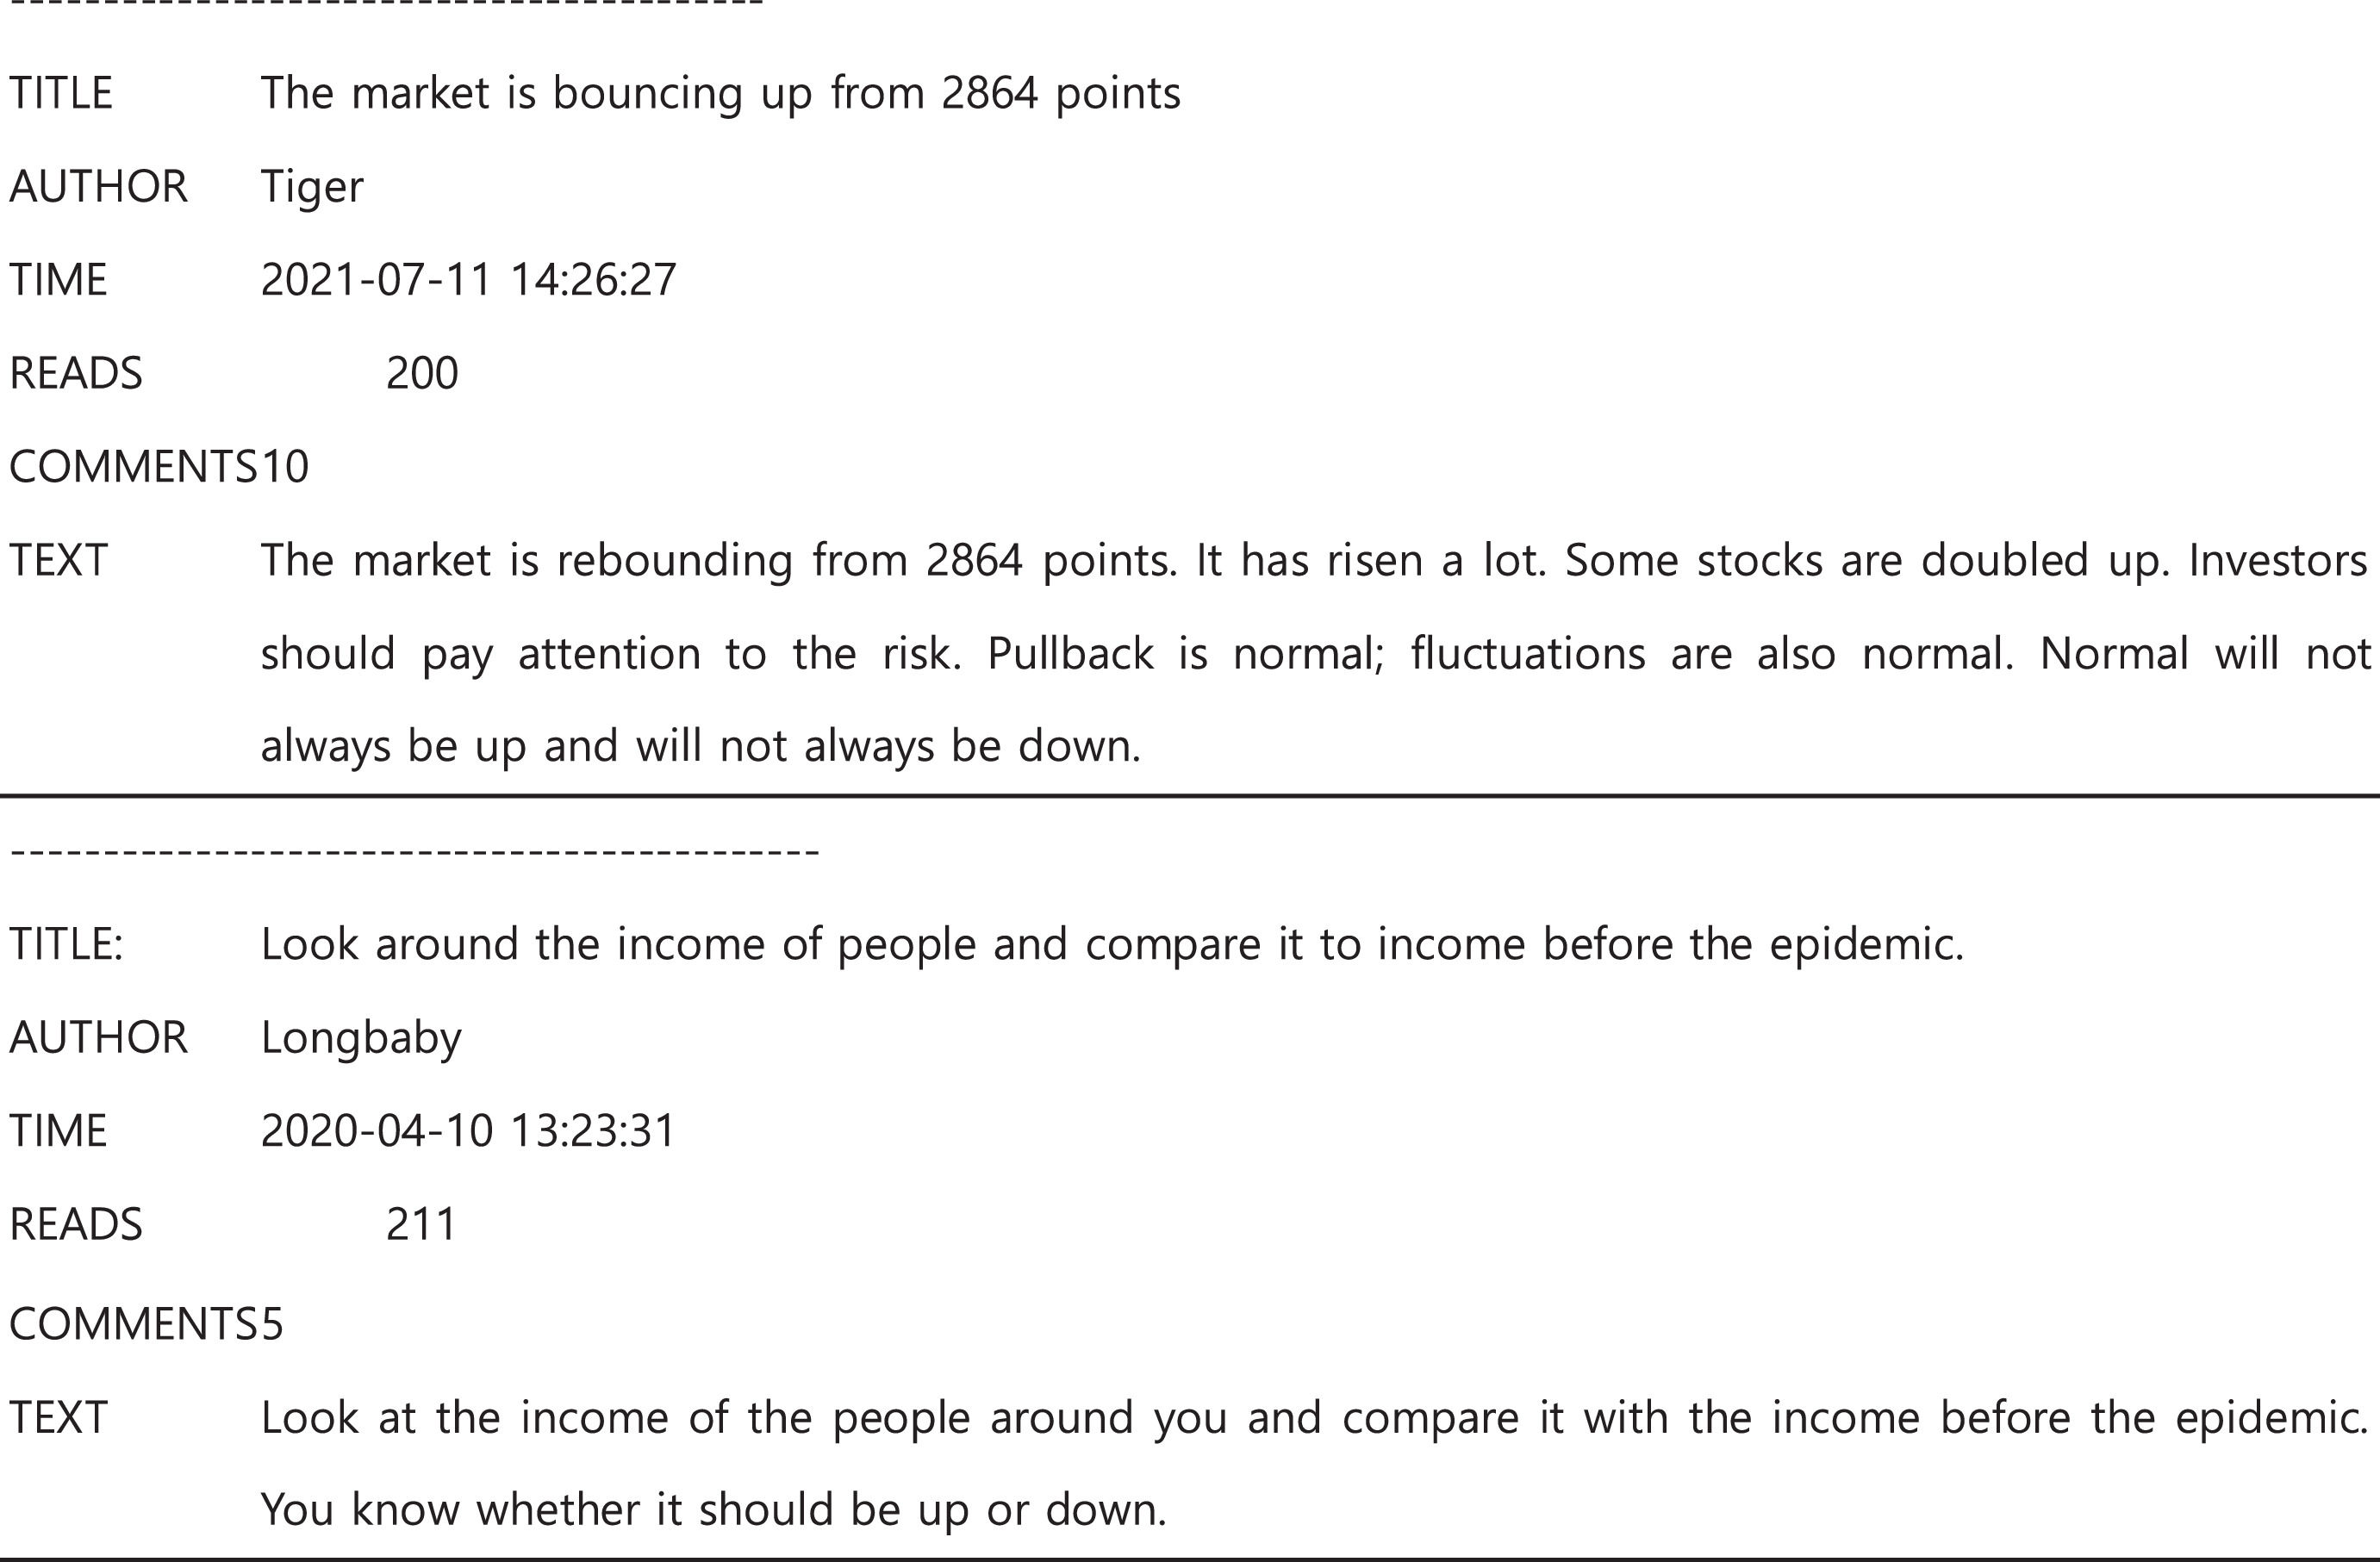
DataThe data used in this study consist of two parts: social media and stock price data. Social media data are used to extract investor sentiment, whereas stock price data are used to analyze the relationship between investor sentiment and the stock market. Social media data are extracted from investor messages on China's largest social media platform for stock market investors (Oriental Fortune Stock Bar). Fig. 4 shows a sample of investor messages.

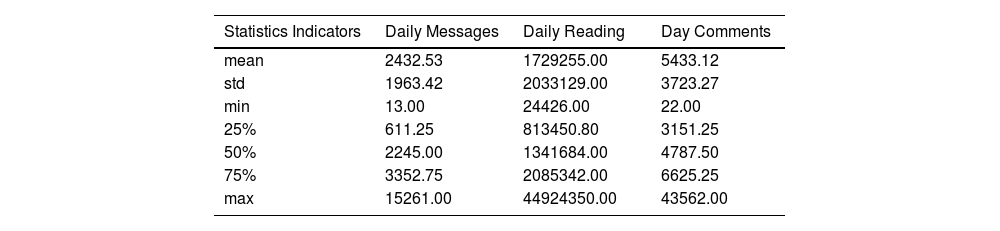
This study's statistical interval covers three full years, from January 1, 2019, to December 31, 2021. We use the most recent research data to obtain conclusions in line with the current moment. The total number of days of data statistics is 1094, and the total number of investor messages is over 2.66 million, with an average of 2432 messages per day. Detailed statistics are presented in Table 1.
Statistical description of social media messages.
25%, 50%, and 75% indicate quartiles.
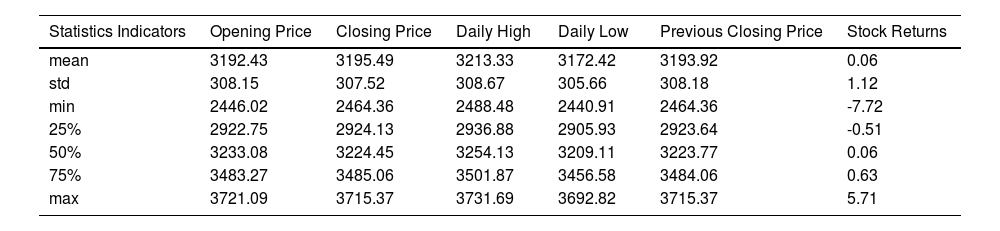
Since we capture social media messages on the topic of the SSE Index, we use the SSE Composite Index as a proxy for aggregate stock prices. We focus on the aggregate change in investor sentiment on social media; therefore, we do not focus on company-specific stock data. In this study, we collect data on opening and closing prices, high and low stock prices, returns, and other indicators using statistical intervals consistent with investor messages for a total of 730 trading days. Table 2 shows the statistical description of the SSE for 730 trading days. Referring to other literature records (Mallikarjuna & Rao, 2019; Nimal, 1997), this study uses closing prices to define stock market returns as

Statistical description of the SSE index.
25%, 50%, and 75% indicate quartiles.
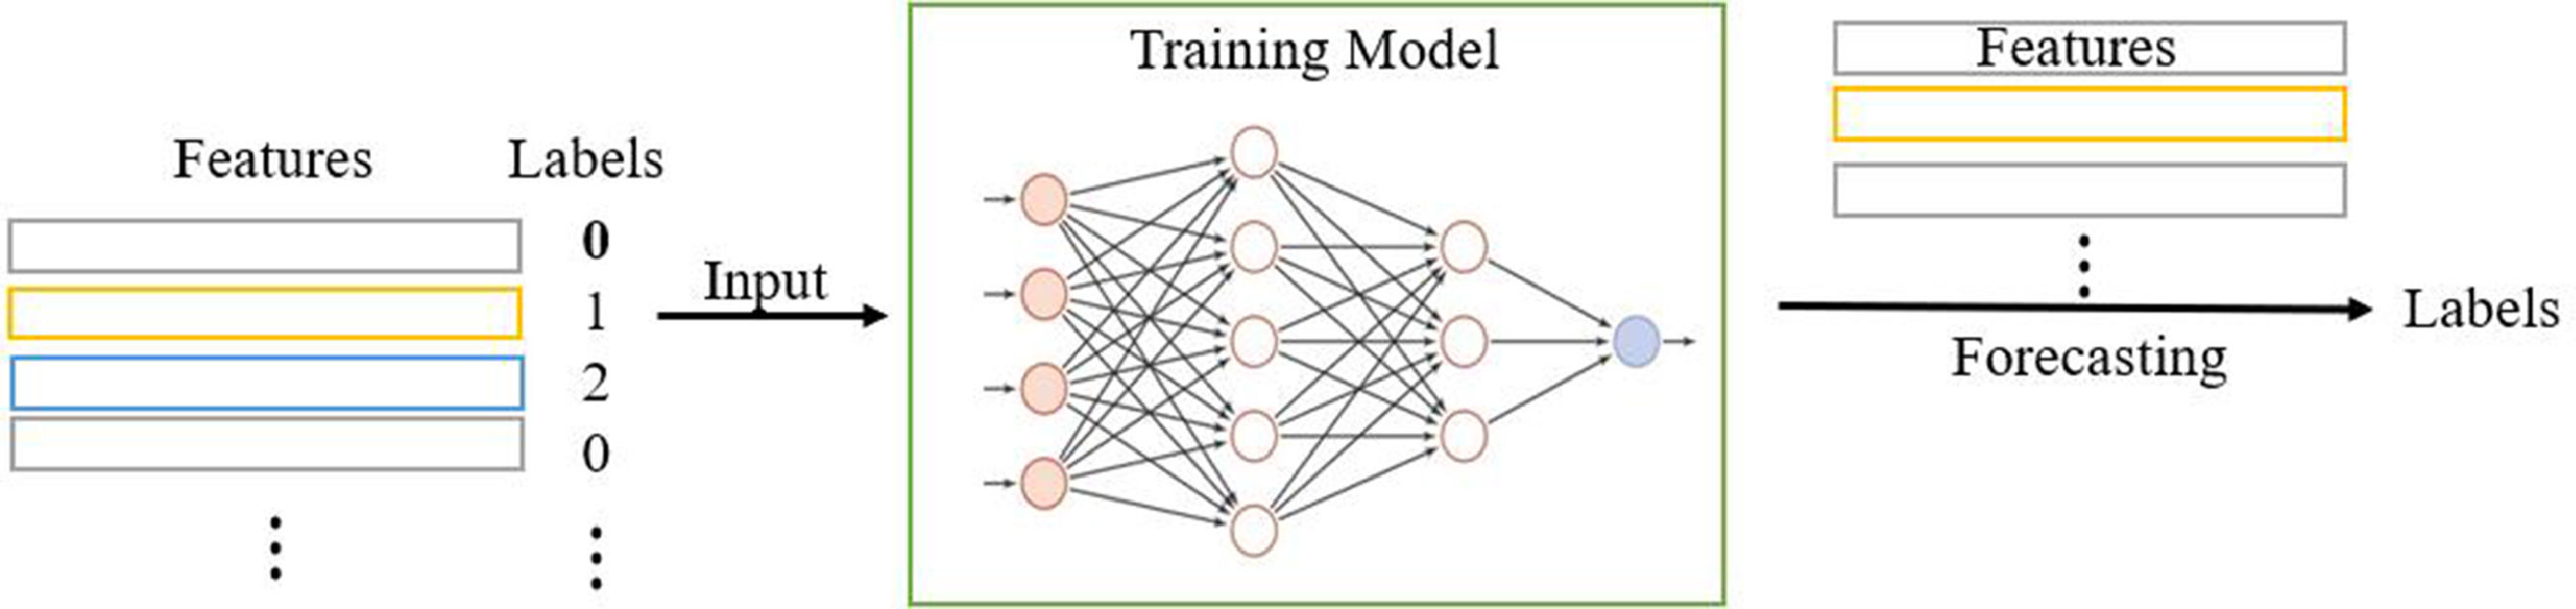
The basic principle of sentiment classification in this study is to train a neural network model using a portion of manually classified data and allow the model to learn human classification rules. The model is then allowed to help humans with text-sentiment classification. This is a typical supervised learning process (Kotsiantis et al., 2007), as shown in Fig. 5.

Liu et al. (2022) used Word2vec for text coding to transform the text into word vectors after performing the necessary preprocessing on the data (Goldberg & Levy, 2014; Taleb et al., 2015). A convolutional neural network was then trained to classify the messages into "bullish," "neutral," and "bearish" categories. In this study, we use the same data source as Liu et al. (2022); therefore, we adopt their sentiment classification model. The combined classification accuracy of this network model is 89.14%, which is higher than the 88.1% reported by Antweiler and Frank (2004) and 85.4% by Xiong et al. (2017). In particular, the classification accuracies of 90.99% and 94.62% for the positive and negative samples, respectively, which are most important for constructing the ICI, can be considered free from systematic errors. Table 3 presents the classification performance of the network model used in this study.
Performance of model classification.
| True Classification | Prediction Classification | |||
|---|---|---|---|---|
| Positive | Negative | Neutral | Accuracy | |
| Positive | 1010 | 79 | 21 | 90.99% |
| Negative | 21 | 880 | 29 | 94.62% |
| Neutral | 24 | 154 | 802 | 81.83% |
| Total | 89.14% | |||
Note: This table is based on a confusion matrix, which is widely employed in the field of machine learning.
In this study, we construct an ICI based on the number of bullish and bearish messages on the stock market in a given time period. Ntbullish represents the number of messages with confidence in the stock market during period t, and Ntbearish represents the number of messages with no confidence in the stock market during period t. Referring to Antweiler's method of defining the bullish sentiment index, the ICI is constructed as follows:

In a time period, the higher the percentage of social media posts expressing a bullish view of the market, the higher the ICI for that time period, indicating that investors are more confident in the market. The lower the proportion of posts on social media expressing confidence in the market, the lower the ICI in that period, indicating that investors lack confidence in the market. In this study, ICI is used as a proxy for investor sentiment. We refer to Liu, Zhou, et al.'s (2022) suggestion of not using Antweiler's protocol index to co-construct the sentiment indicator.
Table 4 lists the definitions of the variables used in this study.
Variables definition.
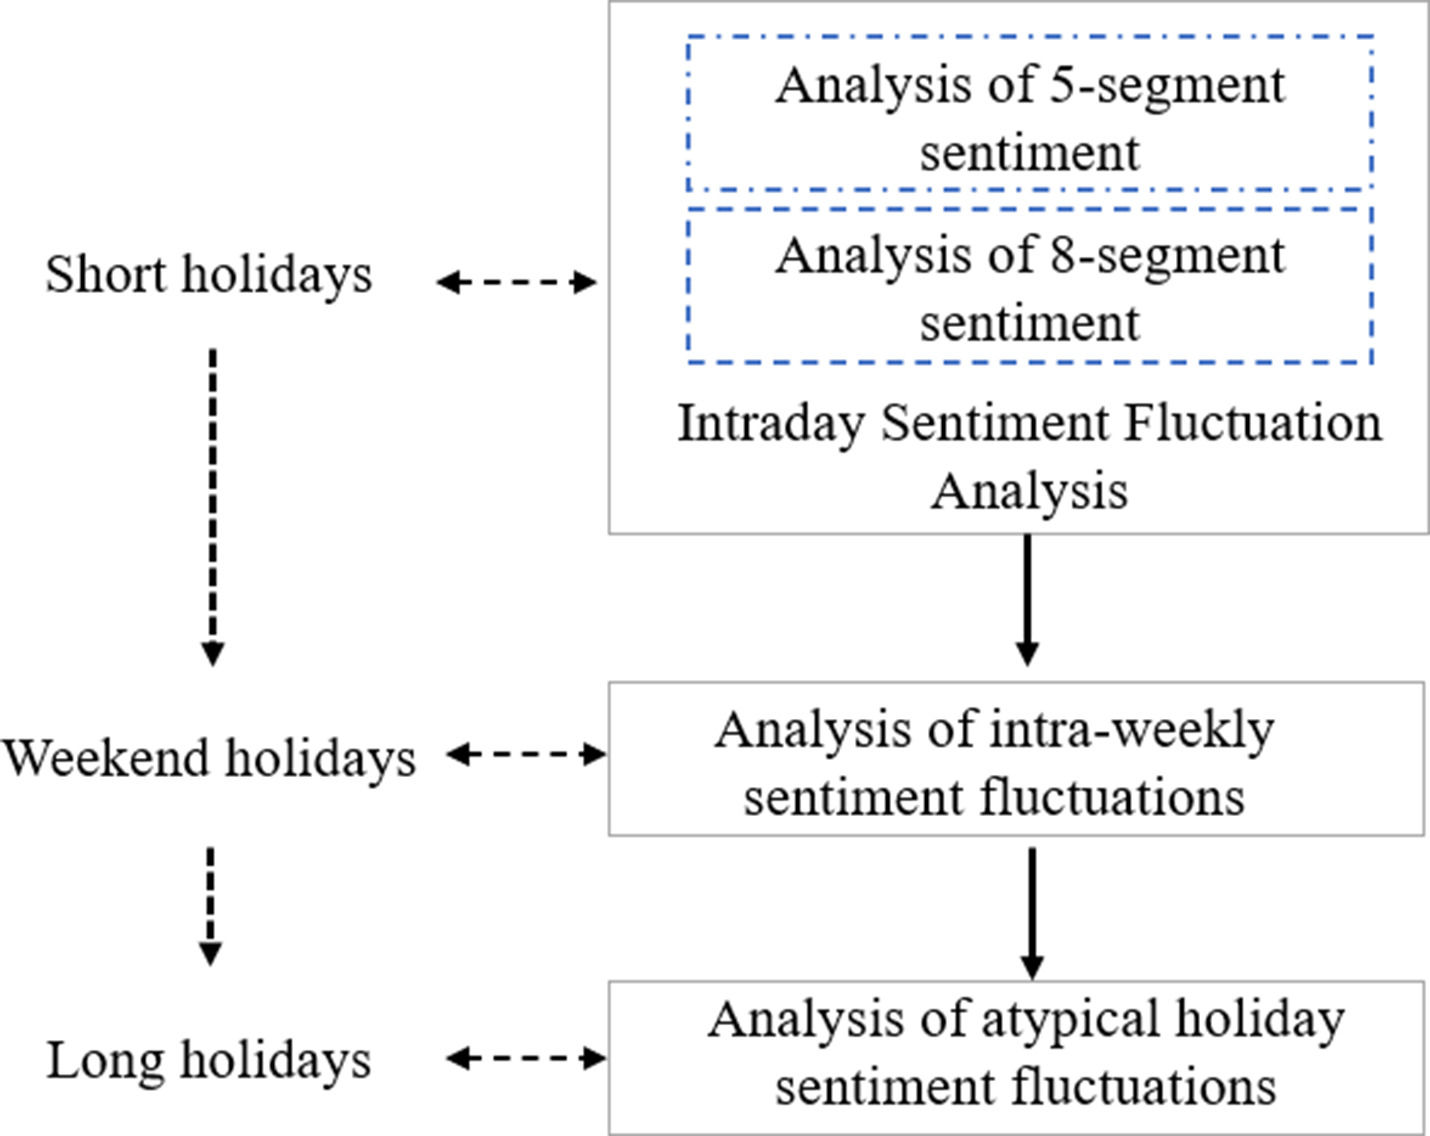
In this study, we refer to all closed-market periods as "holidays." We comprehensively examine the dispositional effects of intraday holidays on investor sentiment, the dispositional effect of weekly holidays on investor sentiment, and the dispositional effect of atypical holidays on investor sentiment. These three types of analyses correspond to shorter, medium-length, and long holidays to ensure that credible analytical results are obtained. Fig. 6 illustrates the framework of this study.
Intraday sentiment fluctuation analysisSentiment analysis in five segments
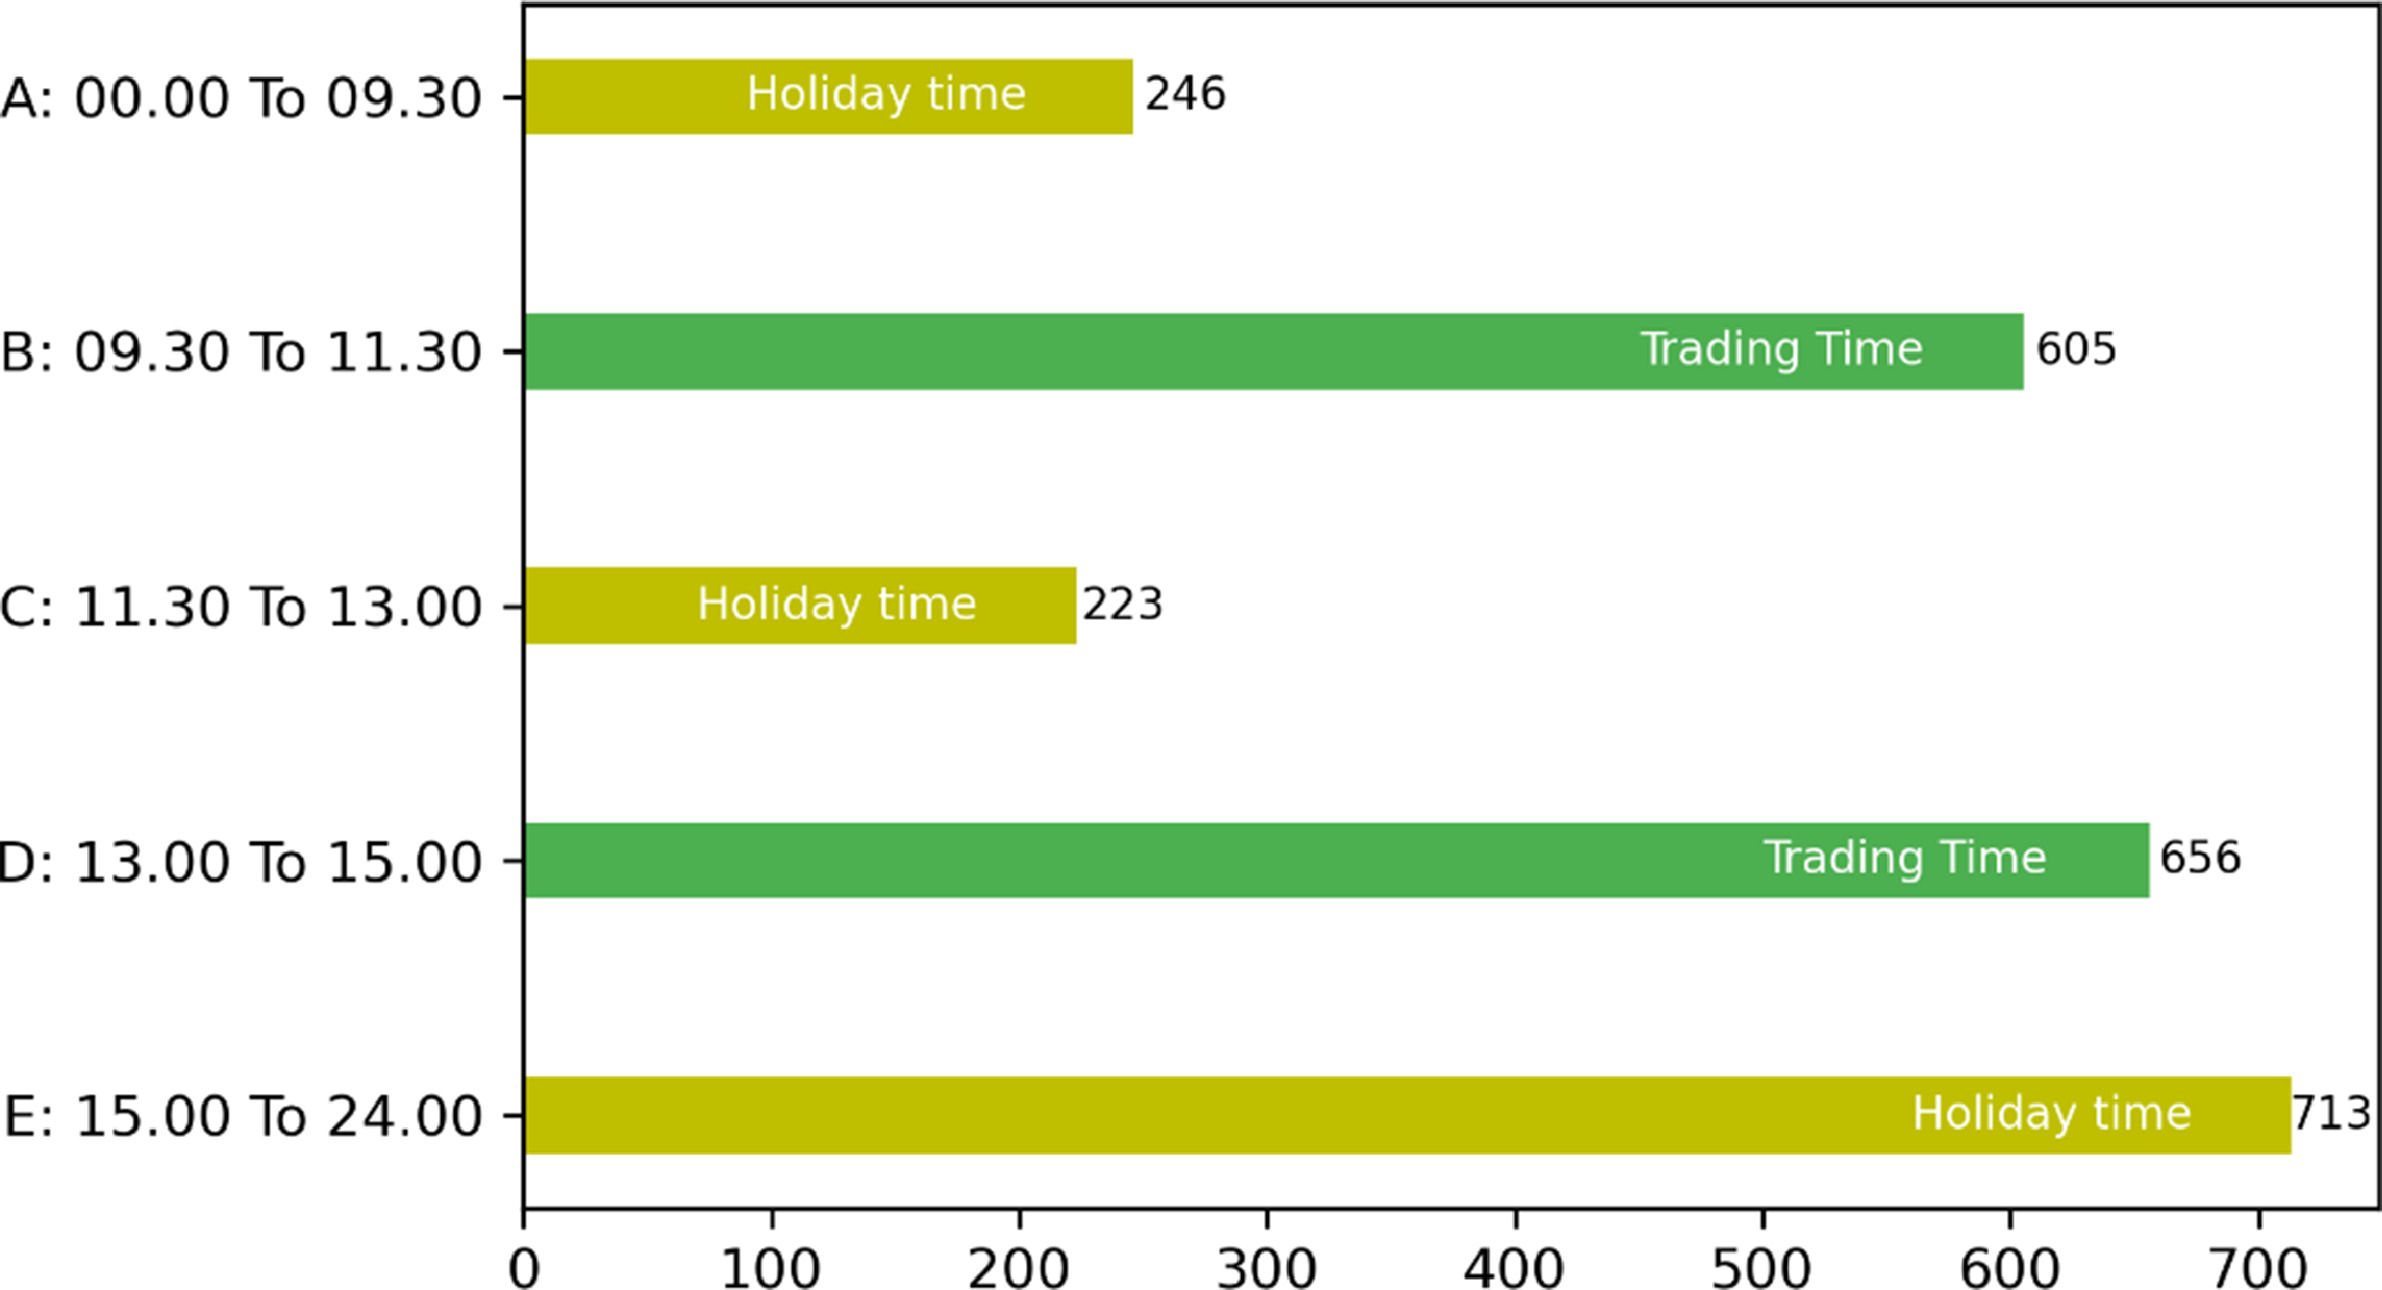
The SSE's trading days range from Monday to Friday. The trading hours are from 09:30 to 11:30 h and 13:00 to 15:00 h on trading days. At other times, the stock market is closed. Thus, each trading day contains two trading periods and three closed trading periods. In our study, we refer to all closed periods as holidays; therefore, a typical trading day consists of three holidays and two trading periods. We used A, B, C, D, and E to represent the five time periods. Fig. 7 shows the details of the five time periods, where the length of the bars represents the average message volume for each time period. On the one hand, because many people are still asleep before the market opens in the morning, fewer investors leave messages during period A. On the other hand, the B and D trading periods are not very long, but investors frequently express their views on social media. The C holiday period is similar in length to the B and D periods; however, the volume of investor messages is low. During the three holidays in a day, investors focus on expressing their views in the afternoon after the market closes in period E.

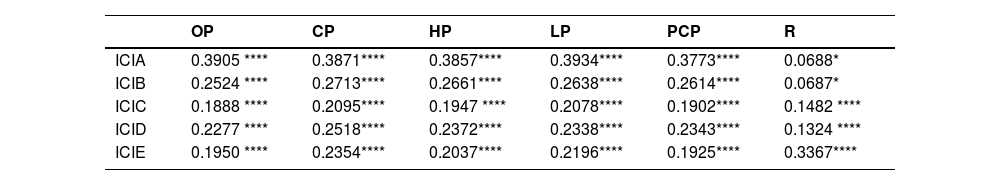
Table 5 shows the correlation analysis between intra-day sentiment and stock price fundamentals for the five segments. The analysis data show that OP, CP, HP, LP, and PCP all have extremely significant weak correlations with investor sentiment in each segment. The correlation between stock returns and segmented sentiment is more specific. On the morning of the trading day, investor sentiment is less likely to predict the day's return, and the significance and correlation between investor sentiment and stock returns are weak. In the afternoon, the significance of and correlation between investor sentiment and returns are significantly higher. In contrast, after the market closes and the day's return has been determined, both the correlation and significance of returns and investor sentiment reach their highest values, which is in line with general logic. The data in Table 5 verify H1 at a more micro level: there is a correlation between stock prices, returns, and investor sentiment.
Analysis of intra-day investor sentiment and stock price correlation: 5 segments.
Note: *, **, ***, and **** represent significance at the 0.05, 0.01, 0.001, and 0.0001 levels, respectively.
OP, opening price; CP, closing price; HP, daily high price; LP, daily low price; PCP, previous closing price; R, stock returns.
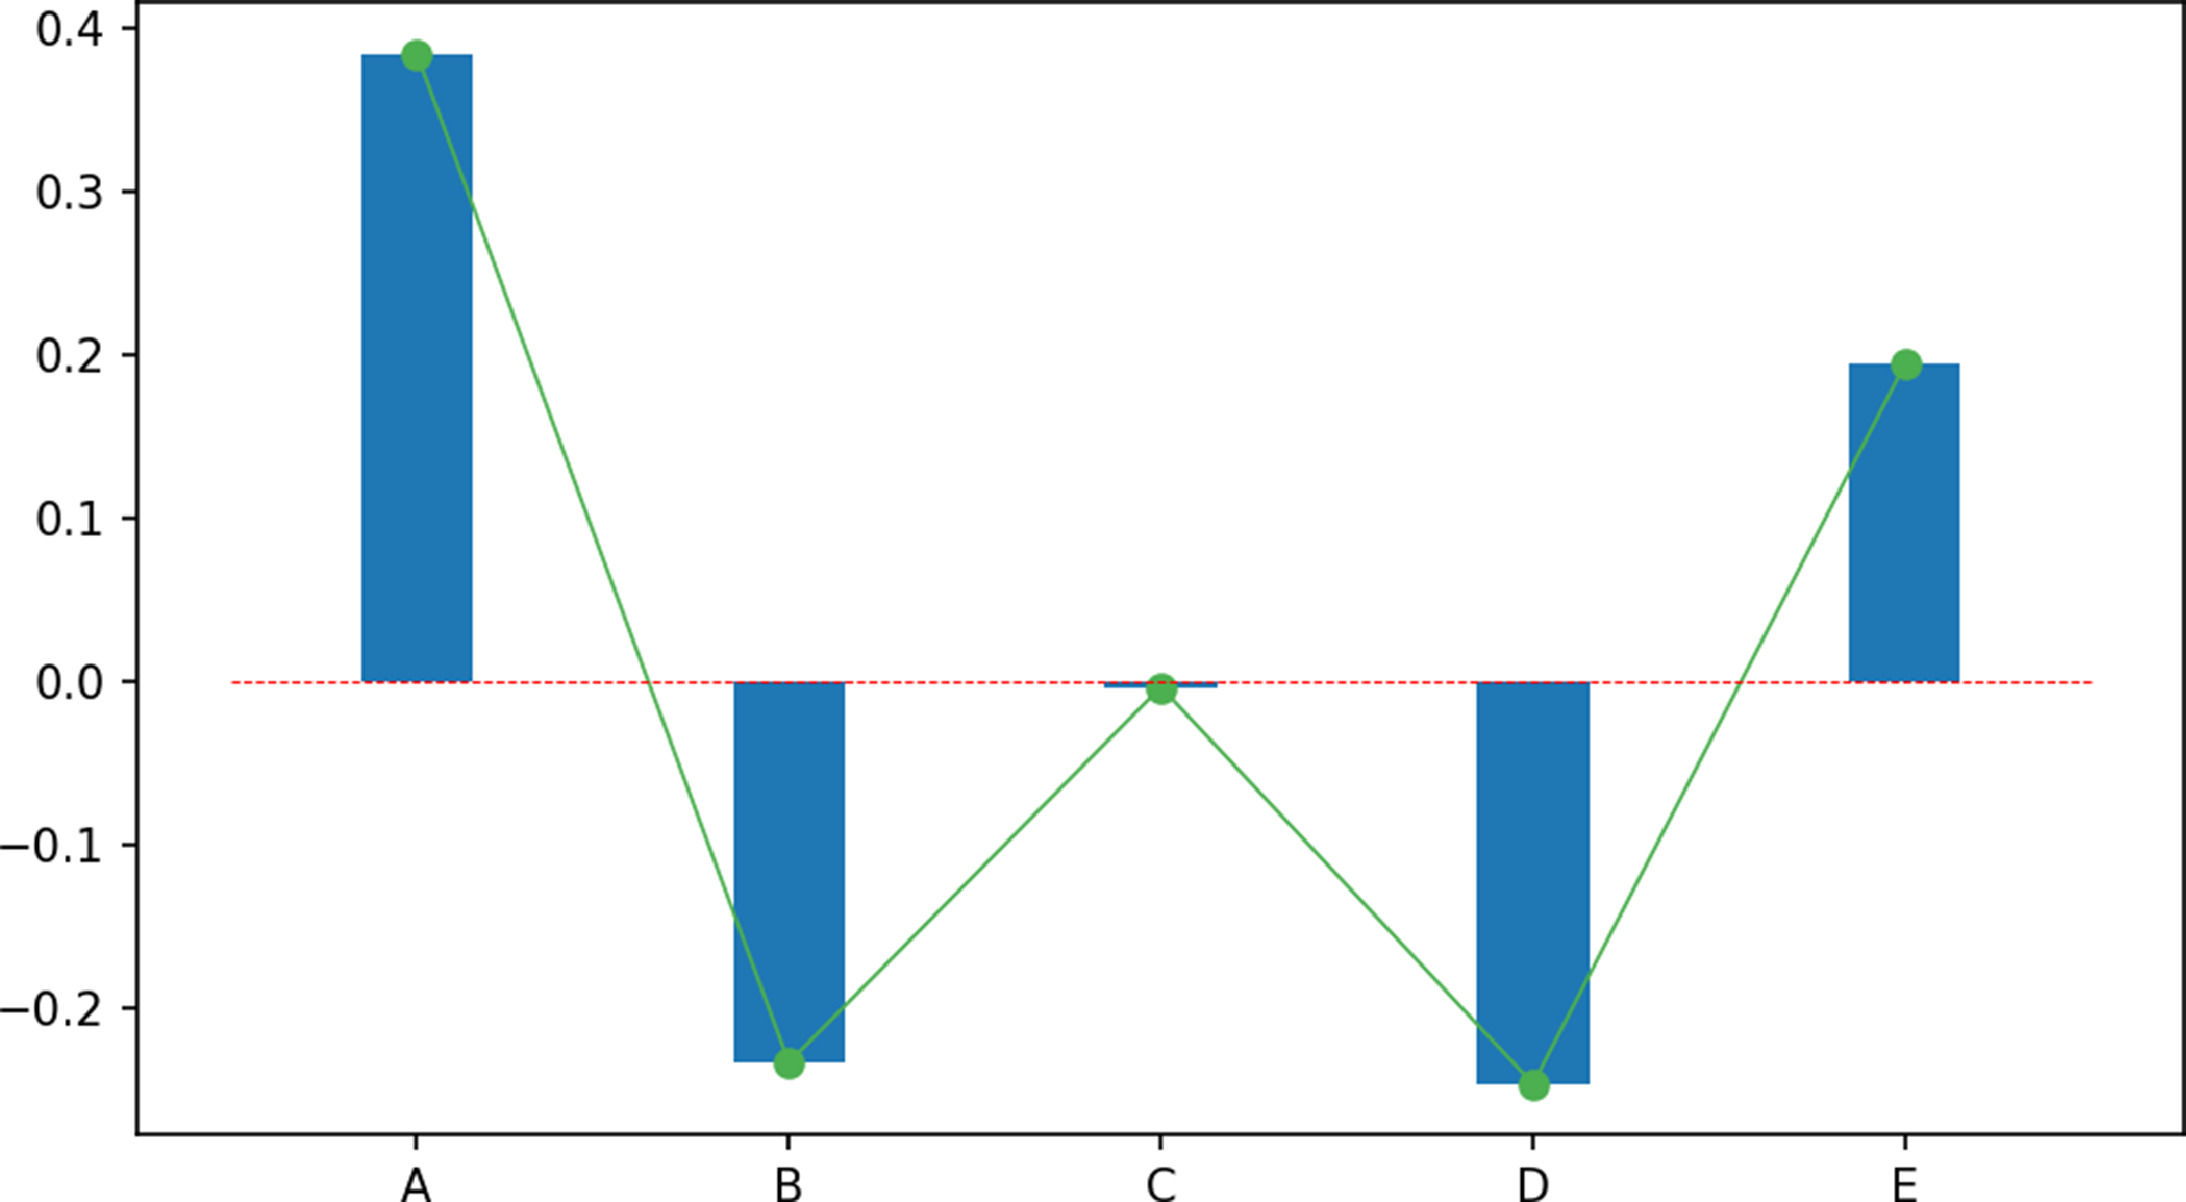
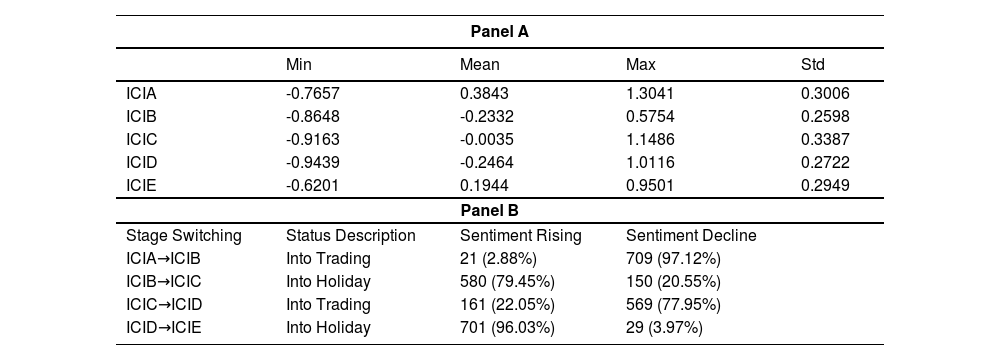
Fig. 8 shows the mean investor sentiment for five periods of the day. These average values are obtained from the statistics of 730 trading days. It is easy to see that investor sentiment rapidly deteriorates when there is a switch from time band A to B. When segment B goes to segment C, investor sentiment improves substantially. However, in the afternoon, after the stock market opens, investor sentiment deteriorates. When the market closes, investor sentiment increases dramatically. This phenomenon verifies H2 at the micro level: the opening of the stock market leads to a deterioration in investor sentiment, and during holidays, investor sentiment improves significantly. The holiday season has a therapeutic effect on investors’ sentiments. Panel A of Table 6 shows the detailed data corresponding to Fig. 8.

Analysis of intra-day investor sentiment and stock price correlation: 5 segments.
To avoid the mean trap generated by extreme values, we count the investor sentiment trend when switching between time segments for a sample of 730 trading days. As shown in Panel B of Table 6, 97.12% of the sample shows a deterioration in investor sentiment when the time switches from segment A to segment B. When the time is switched from segment C to segment D, 77.95% of investor sentiment shows a deterioration. This finding supports the first half of H2: the opening of the stock market leads to a deterioration in investor sentiment. At the same time, 79.45% of the sample investors' sentiment improves when the time is switched from segment B to segment C, whereas in the afternoon market closure, 96.03% of the sample investors' sentiment improves. This finding supports the second half of H2: holidays have a therapeutic effect on investor sentiment, which improves significantly during holidays. Our findings suggest that investor sentiment on social media is not fundamentally different from the daily sentiment of people studied by Golder and Macy (2011) using Twitter data.
Based on these findings, investor sentiment is positively related to the fundamentals of stock prices. Additionally, at the individual level, investor sentiment may be influenced by factors such as daily work, commuting, and diet (Hong & Wang, 2000). In general, the following function can be used to describe how investors feel during trading hours.

In the above formula, Pt denotes the fundamentals of stock market prices,
Pt=[OP,CP,HP,LP,PCP].
Other factors that influence investor sentiment are uncountable. For example, individual events can have positive or negative effects on the stock market (Barberis et al., 1998). However, these extraordinary external events do not impact our statistical conclusions, such as investor sentiment, which is significantly elevated during holidays. Therefore, we ignored these factors to obtain a clear description.
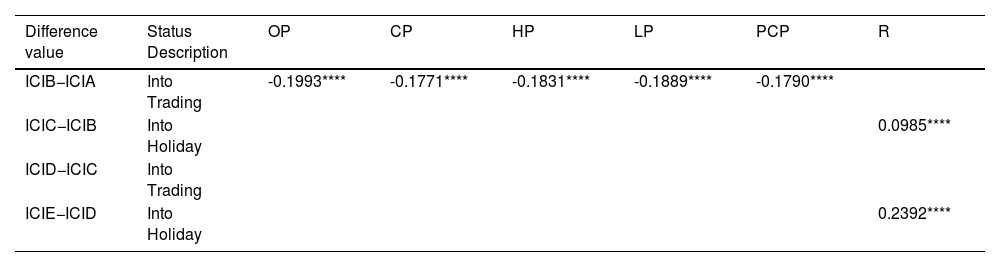
Table 7 shows the correlation analysis of the sentiment differential when investor sentiment switches between periods A, B, C, D, and E with stock prices and returns. In the morning, when the stock market opens, the deterioration in investor sentiment shows a significant negative correlation with stock prices. In contrast, when the stock market goes from the trading session to the holiday (the state described as "Into Holiday"), the increase in investor sentiment is not correlated with stock market fundamentals but is significantly positively correlated with returns. Stock price fundamentals do not affect the increase in investors' sentiment when they enter a holiday, whereas returns significantly affect the mood of investors after the market closes. However, based on the findings in Panel A of Table 6, investor mood is significantly elevated during holidays, regardless of the yield. Thus, investor sentiment during holidays can be described as:
Analysis of intra-day investor sentiment and stock price correlation: 5 segments.
Note: It shows only significant data.
*, **, ***, and **** represent significance at the 0.05, 0.01, 0.001, and 0.0001 levels, respectively.
ICIH=ICIT+fH(t,Rt,…)

OP, opening price; CP, closing price; HP, daily high price; LP, daily low price; PCP, previous closing price; R, stock returns.
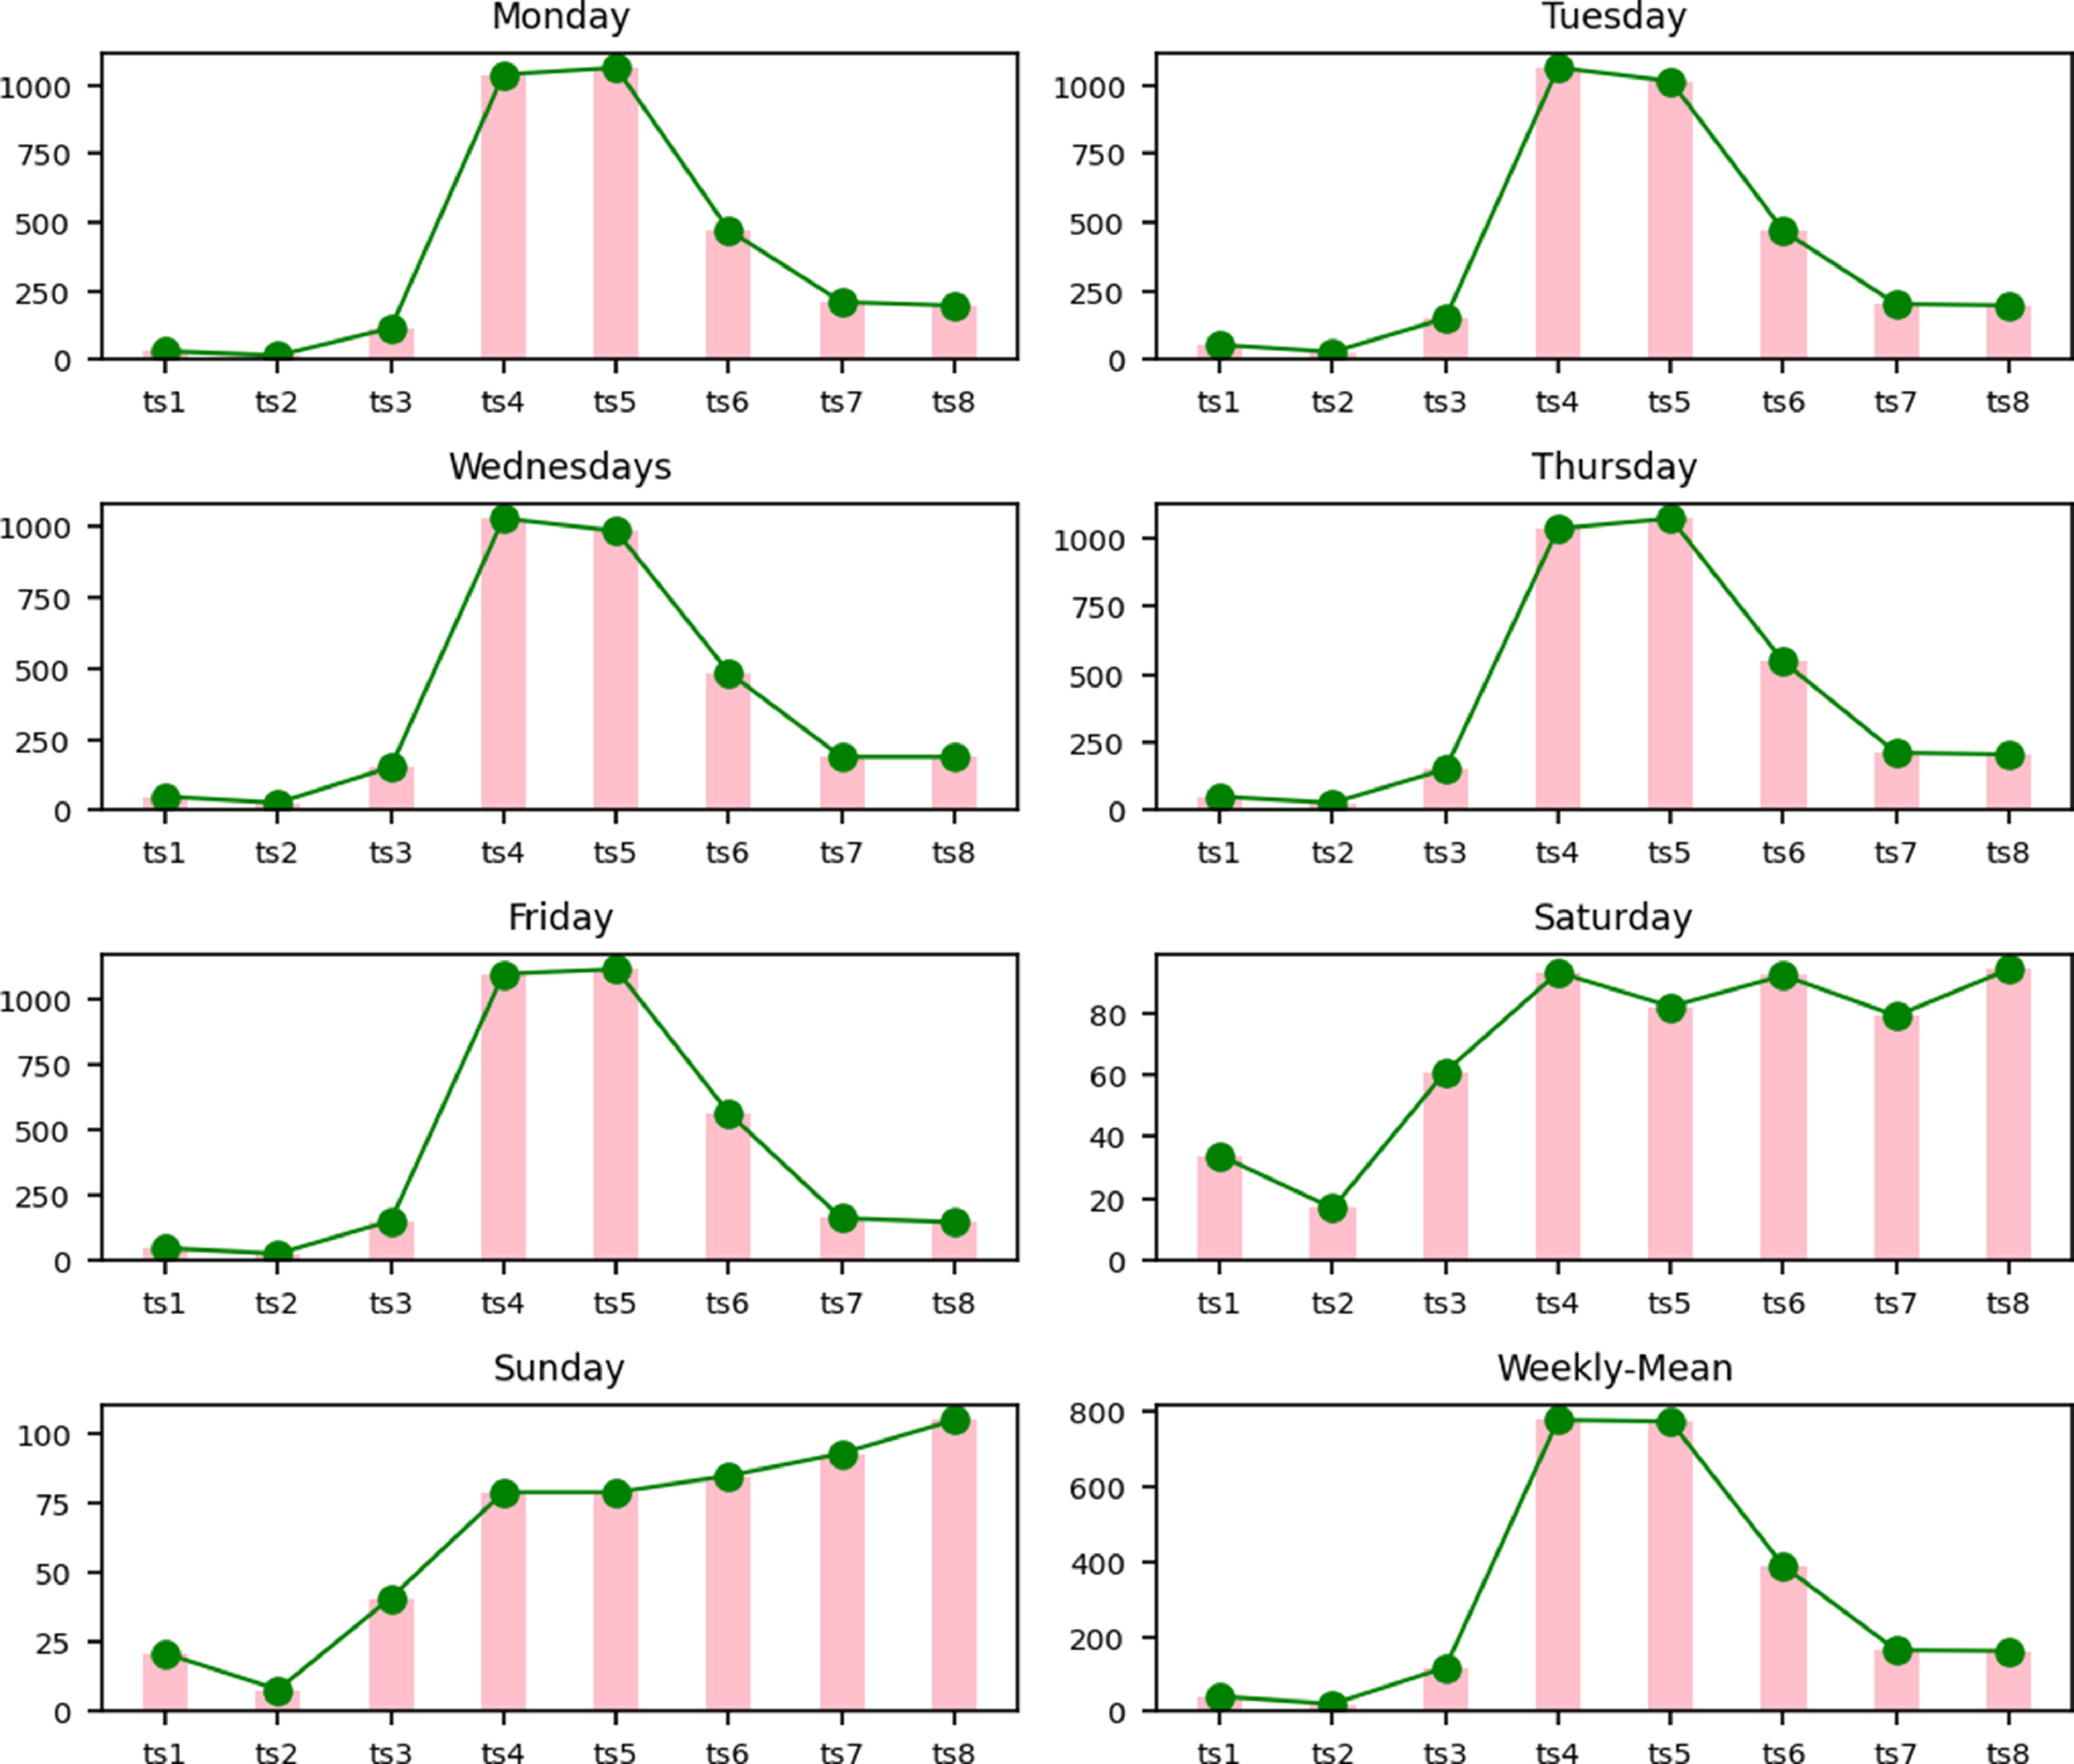
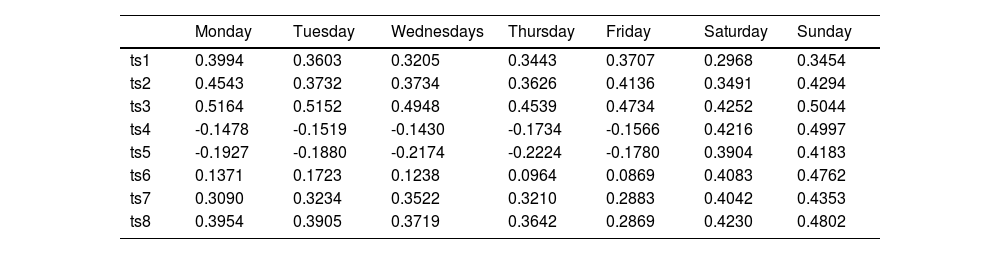
Sentiment analysis in eight segmentsWe divide the 24 h of the day into eight three-hour time segments to further investigate the disposition effect of holidays on investor sentiment. We call 00:00 h to 02:59 h “ts1,” and so on (ts1–ts8 for these eight segments). Fig. 9 shows the distribution of the volume of investor messages into eight segments over a week. We show these data to illustrate that there is a significant difference in the time distribution of investor messages during the day between holidays and trading days. Investors focus their attention on ts4 and ts5, the periods that include trading hours during Monday through Friday trading days. Regular stock market opening and closing from Monday to Friday causes the distribution of investors' messages to converge into a consistent pattern. However, on Saturdays and Sundays, the main determinant of the distribution of investors' messages was people's living habits.

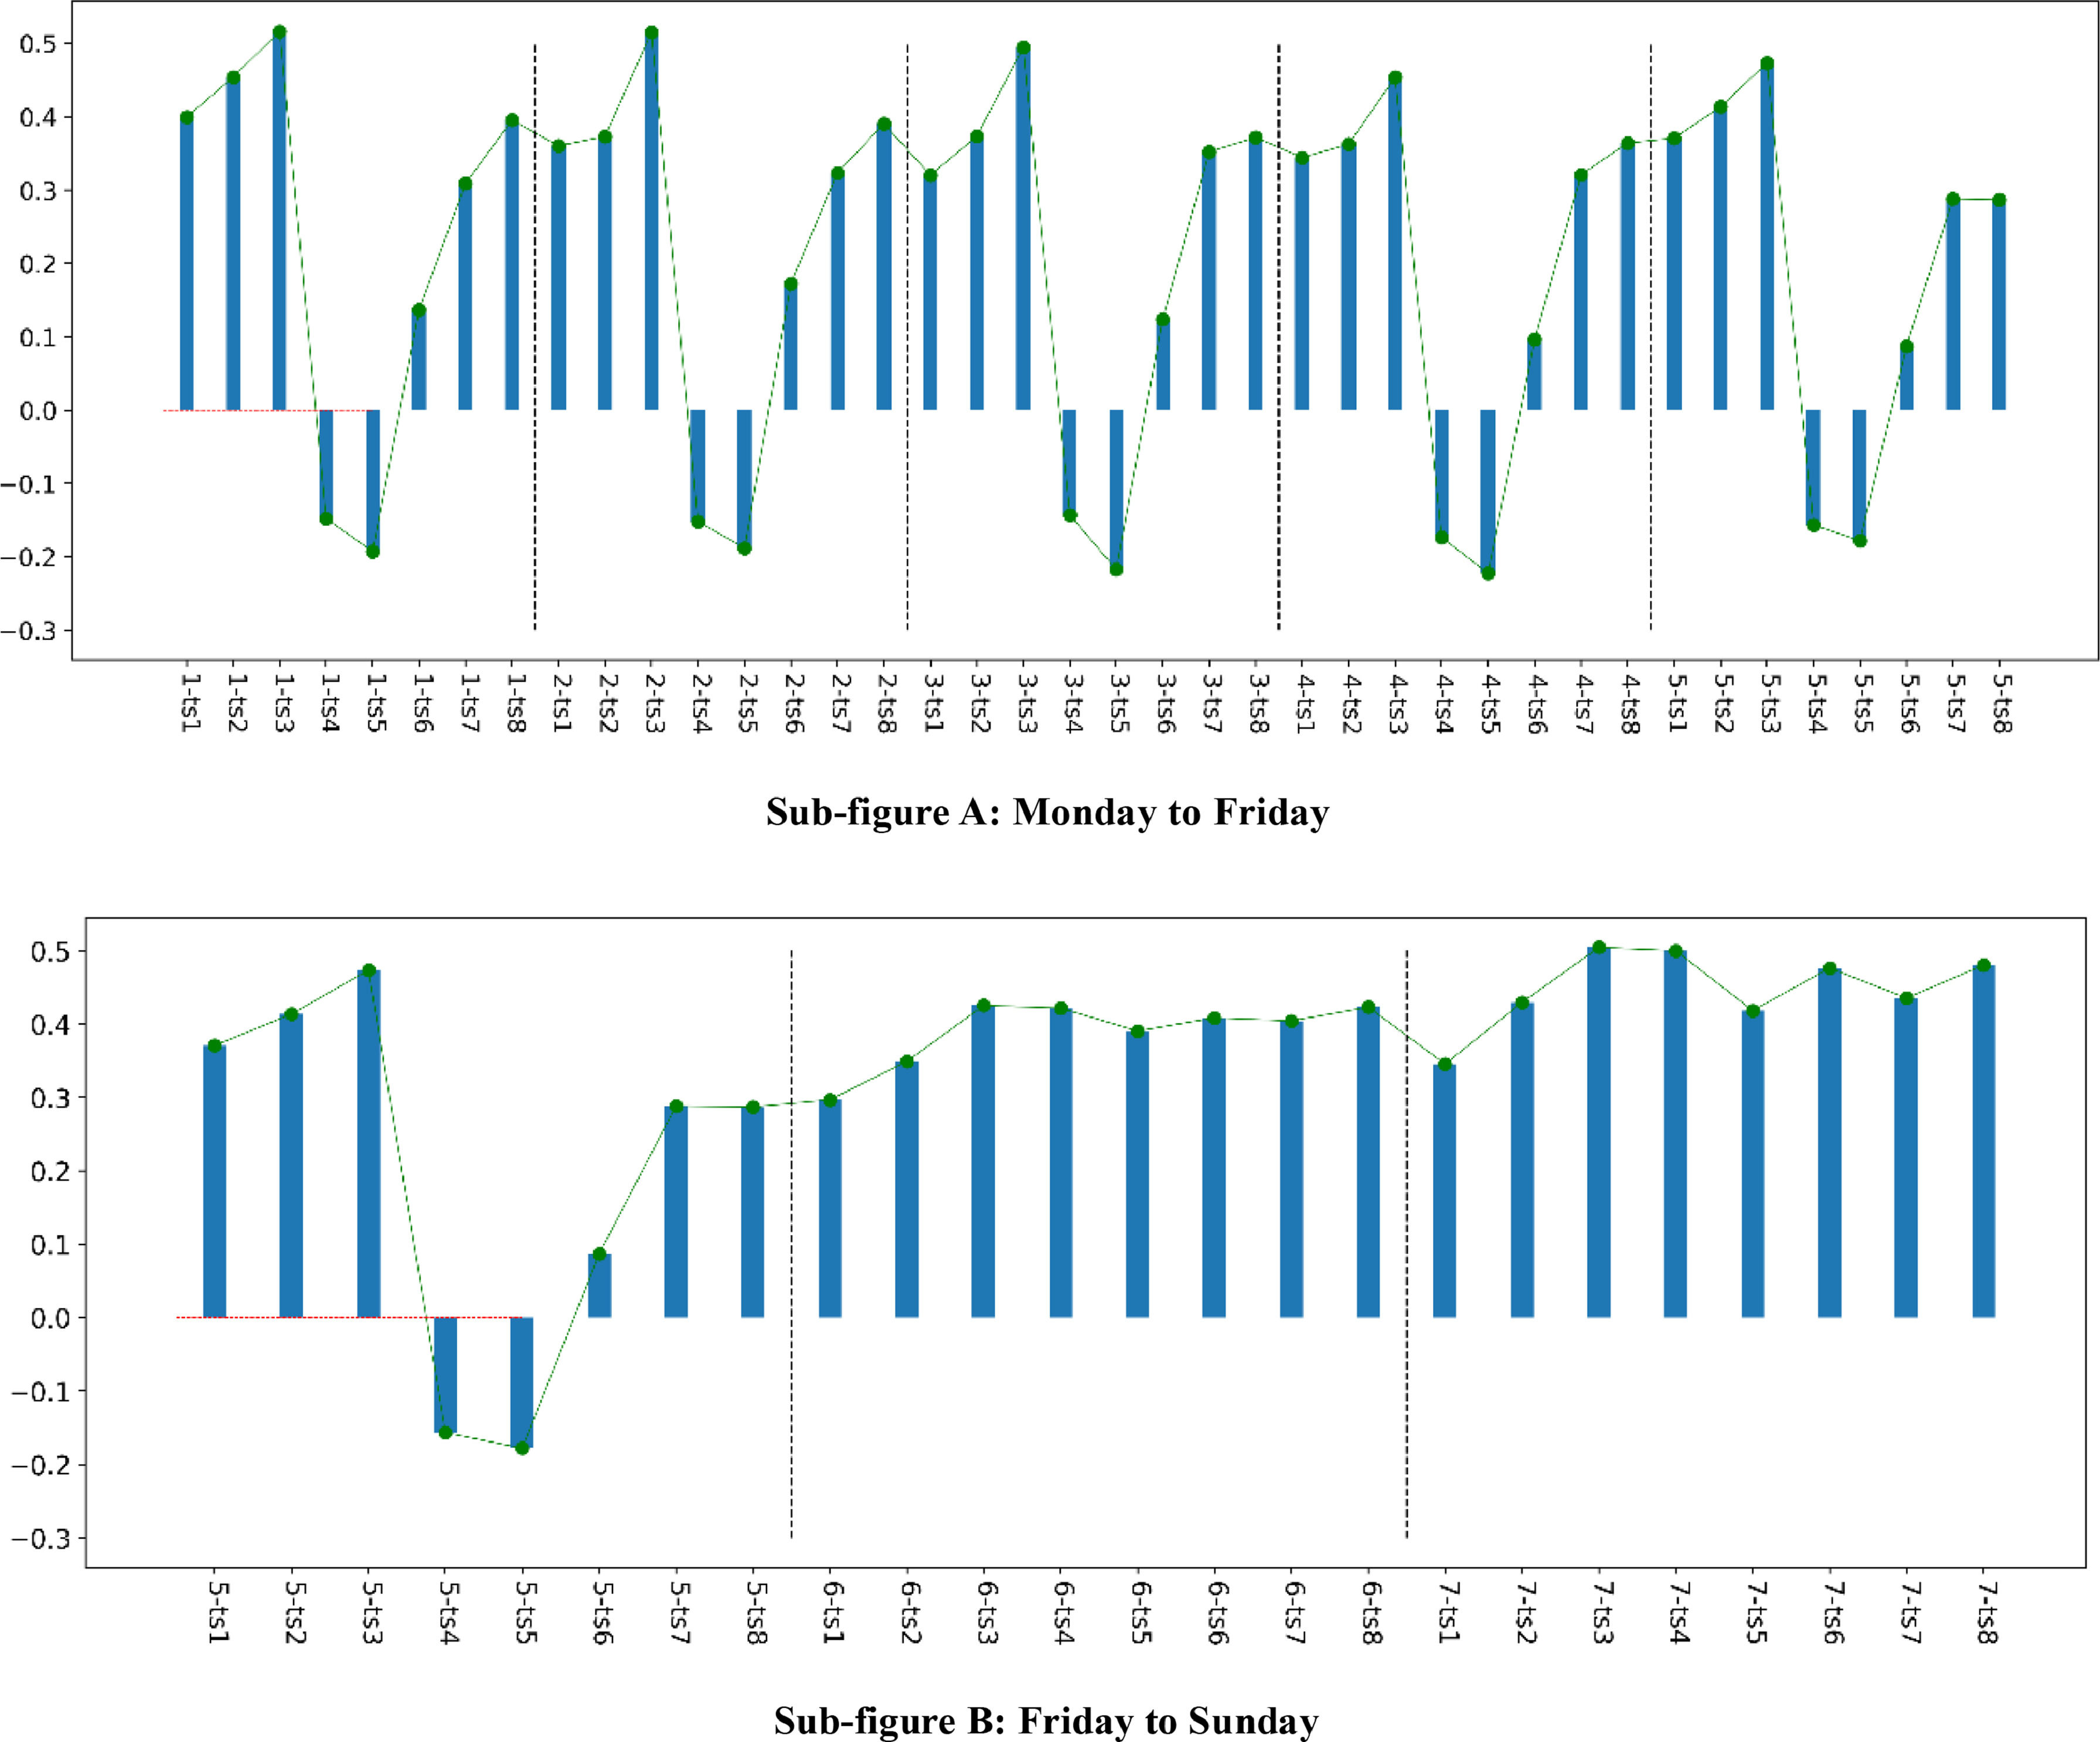
Sub-figure A in Fig. 10 shows how investor sentiment changes from Monday to Friday. Investor sentiment reaches its highest daily value in the ts3 period after waking. This finding is consistent with Hong and Wang's (2000) finding that human mood is related to sleep quality. This also suggests that investor sentiment on social media is not fundamentally different from general human sentiment. Investor sentiment deteriorated rapidly after the stock market opened (when in ts4 and ts5) and increased significantly after the stock market closed (when in ts6, ts7, and ts8). The pattern of investor sentiment fluctuations from Monday to Friday is similar. This finding supports H3 at the micro-level. When the stock market opens and closes regularly, investor sentiment changes in ways that are statistically significant and regular.

Investor Sentiment Distribution for 8 Segments: Weekly Statistics. Sub-figure A: Monday to Friday. Sub-figure B: Friday to Sunday. Note: From Monday to Sunday, use numbers 1, 2, 3, and so on. 1-ts1 indicates investor sentiment for the first segment on Monday. Sub-figures A and B are partially duplicated for better articulation.
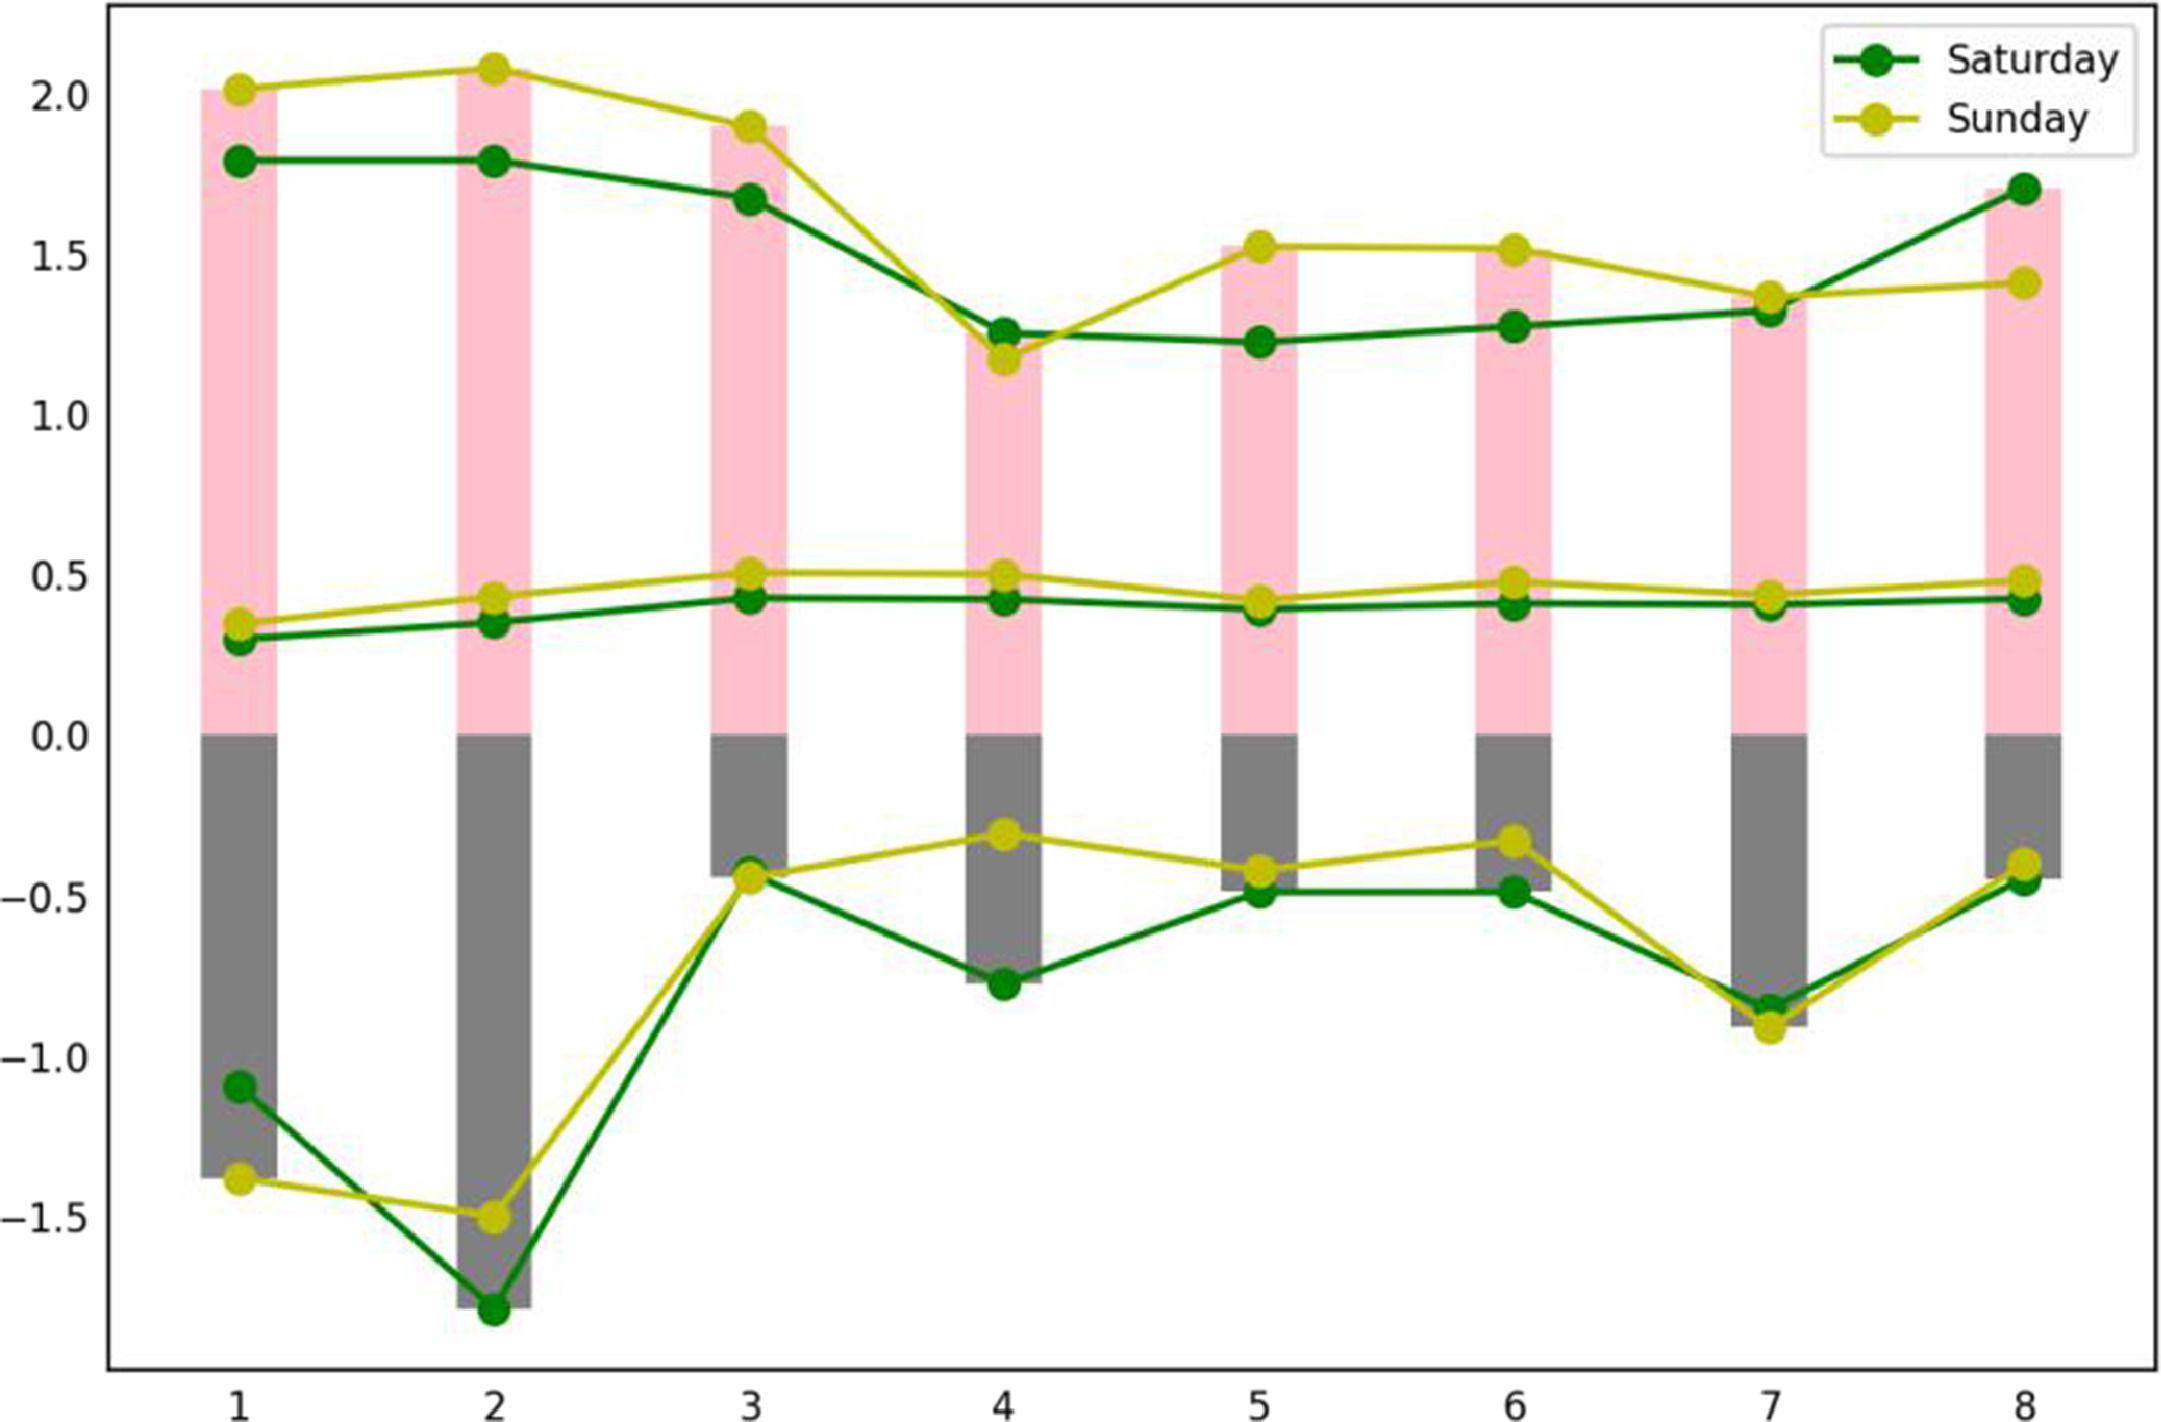
Table 8 presents the detailed data accompanying Fig. 10, which supports H3 in this study. Sub-figure B of Fig. 9 shows the volatility of investor sentiment from the beginning of the holiday on Friday (segment 5-ts6) to the end of the holiday on Sunday (segment 7-ts8). Investor sentiment continues to climb after the stock market closes on Friday, peaking at the ts3 segment on Saturday. Subsequently, investor sentiment remains relatively flat. On Sundays, investor sentiment decreases slightly in the ts1 segment, and then investor sentiment increases to a maximum in ts3. This pattern is similar to that of Monday–Friday, a fluctuation related to work and rest. Subsequently, investor sentiment shows irregular fluctuations. Fig. 11 illustrates the comparison curve of investor sentiment fluctuations on Saturdays and Sundays. It is easy to see that although the mean value of investor sentiment is slightly higher on Sunday than on Saturday at all periods, the difference is not large and shows a similar fluctuation rule.
Investor sentiment distribution for 8 segments: weekly statistics.
. Note: The top two curves are the maximum sentiment fluctuation curves. The middle two curves are the mean sentiment fluctuation curves. The bottom two curves are the minimum sentiment fluctuation curves.")
Comparison of Investor Sentiment Between Saturday and Sunday by Segment (8 segments). Note: The top two curves are the maximum sentiment fluctuation curves. The middle two curves are the mean sentiment fluctuation curves. The bottom two curves are the minimum sentiment fluctuation curves.
Combining the combined results of Sub-figure B in Figs. 10, 11, and Table 8, we find that investor sentiment shows a significant increase at the beginning of a holiday, but this trend is not sustained. When holiday length exceeds a certain range, investor sentiment tends to stabilize and is mainly influenced by life patterns and daily events. This finding supports H4, which states that the dispositional effect of holidays on investor sentiment changes from a therapeutic to a hygienic effect when the length of the holiday exceeds a certain threshold. The investor sentiment on holidays described by formula (4) can be improved as follows:

In the above equation, Et denotes the events in life that affect a person's underlying emotions, whereas L denotes a person's work and rest patterns. t0 is the point at which the holiday effect changes from therapeutic to hygienic. Based on Barberis and Golder's study, we believe that Et and L are the main factors influencing investor sentiment fluctuations after the disposition effect of holidays enters the hygiene phase. Occasional events that are not always present are not in our consideration because they do not have an impact on the statistical conclusions.
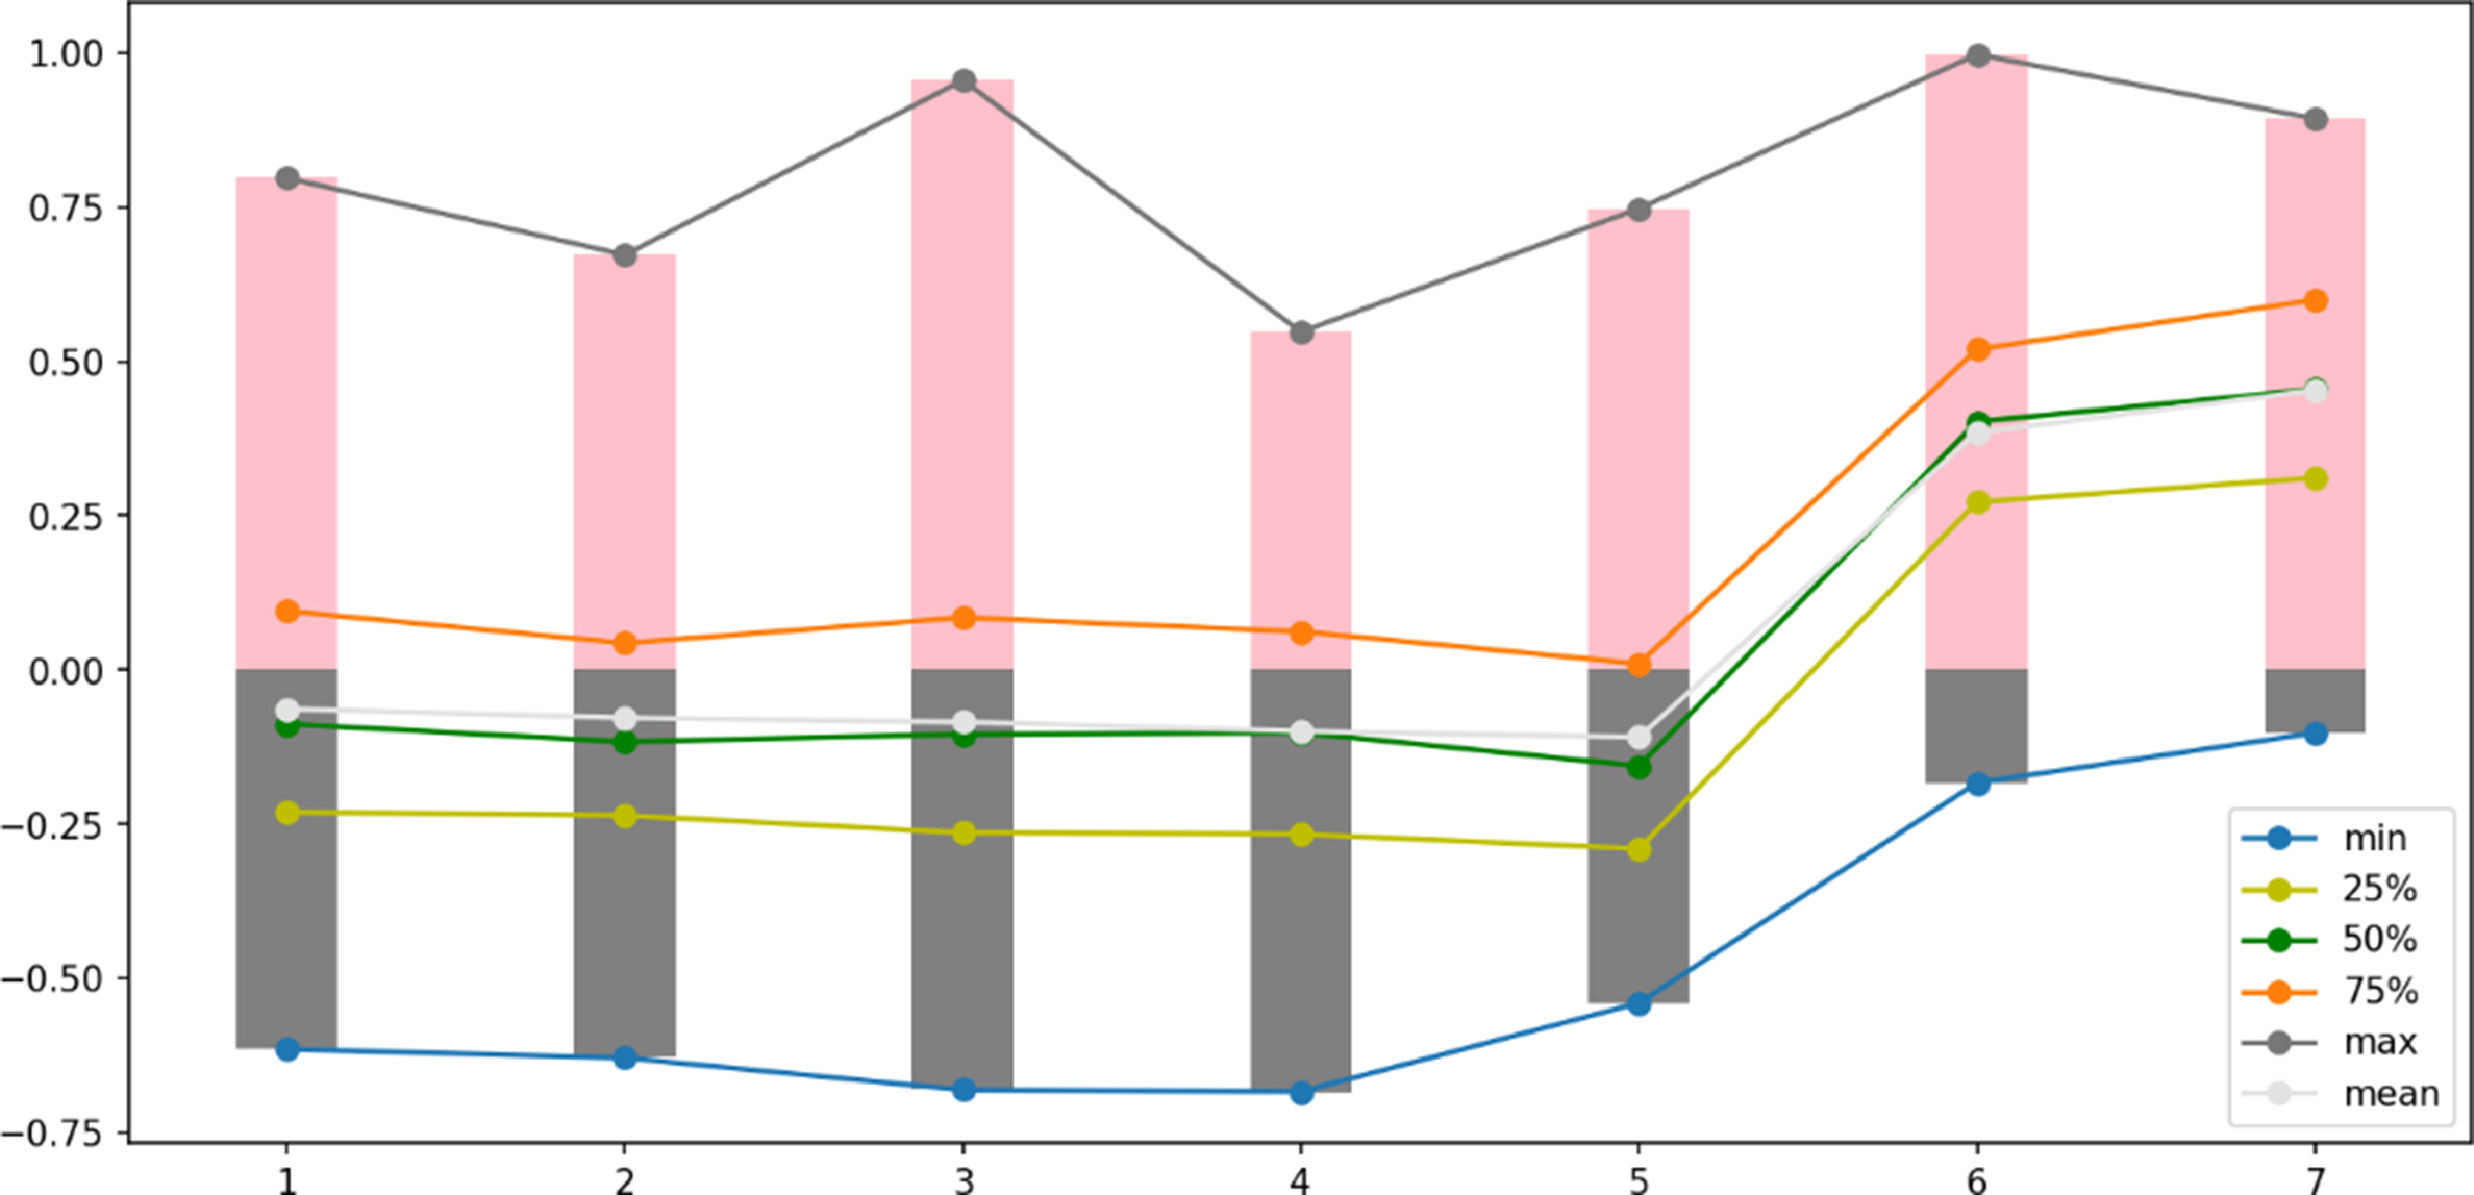
Analysis of investor sentiment fluctuations during the weekFig. 12 presents statistical information on weekly fluctuations in investor sentiment from 1094 days of underlying sentiment data. The x-axis in the figure represents Monday to Sunday, and the y-axis is investor sentiment. It is clear from the mean curve and the 25%, 50%, and 75% quartile curves in the figure that investor sentiment is significantly higher on Saturdays and Sundays relative to trading days and slightly higher on Sundays relative to Saturdays.

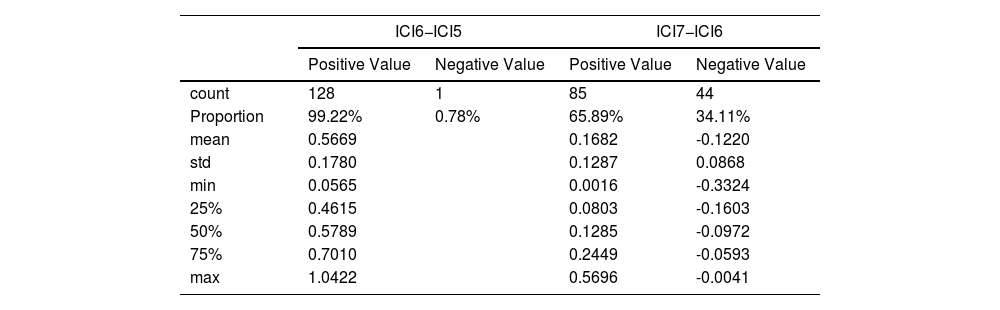
Table 9 shows the change in weekend investor sentiment over 129 full trading weeks in terms of both the direction and the specific value of the change in sentiment. According to the statistics, 99.23% of the sample experienced a significant increase in investor sentiment on Saturdays, with a mean increase of 0.5669. Of the sample, 65.89% showed a slight increase in investor sentiment on Sundays, with a flat increase of 0.1682, whereas 34.11% of the sample showed a slight decrease (-0.1220) in investor sentiment on Sundays.
Statistics on changes in investor sentiment over the weekend.
Note: This table counts sentiment data for 129 complete trading weeks for a total of 903 days.
These samples of falling sentiments cannot be explained by the therapeutic effect of holidays on investor sentiment. Barberis et al. (1998) argued that such natural fluctuations are a kind of random walk due to external stimuli, such as lifestyle and work, and in a constant stock market environment. This random walk is the main factor influencing investor sentiment fluctuations when holidays no longer have a therapeutic effect. These negative random walk samples that the therapeutic effect cannot explain are present in the same proportion as the positive samples of random walks that cannot be explained by the therapeutic effect (Dvoretzky & Erdös, 1951; Pearson, 1905). These samples, totaling 68.22%, are unable to have an elevating effect on investor sentiment but still maintain investor sentiment at a certain level.
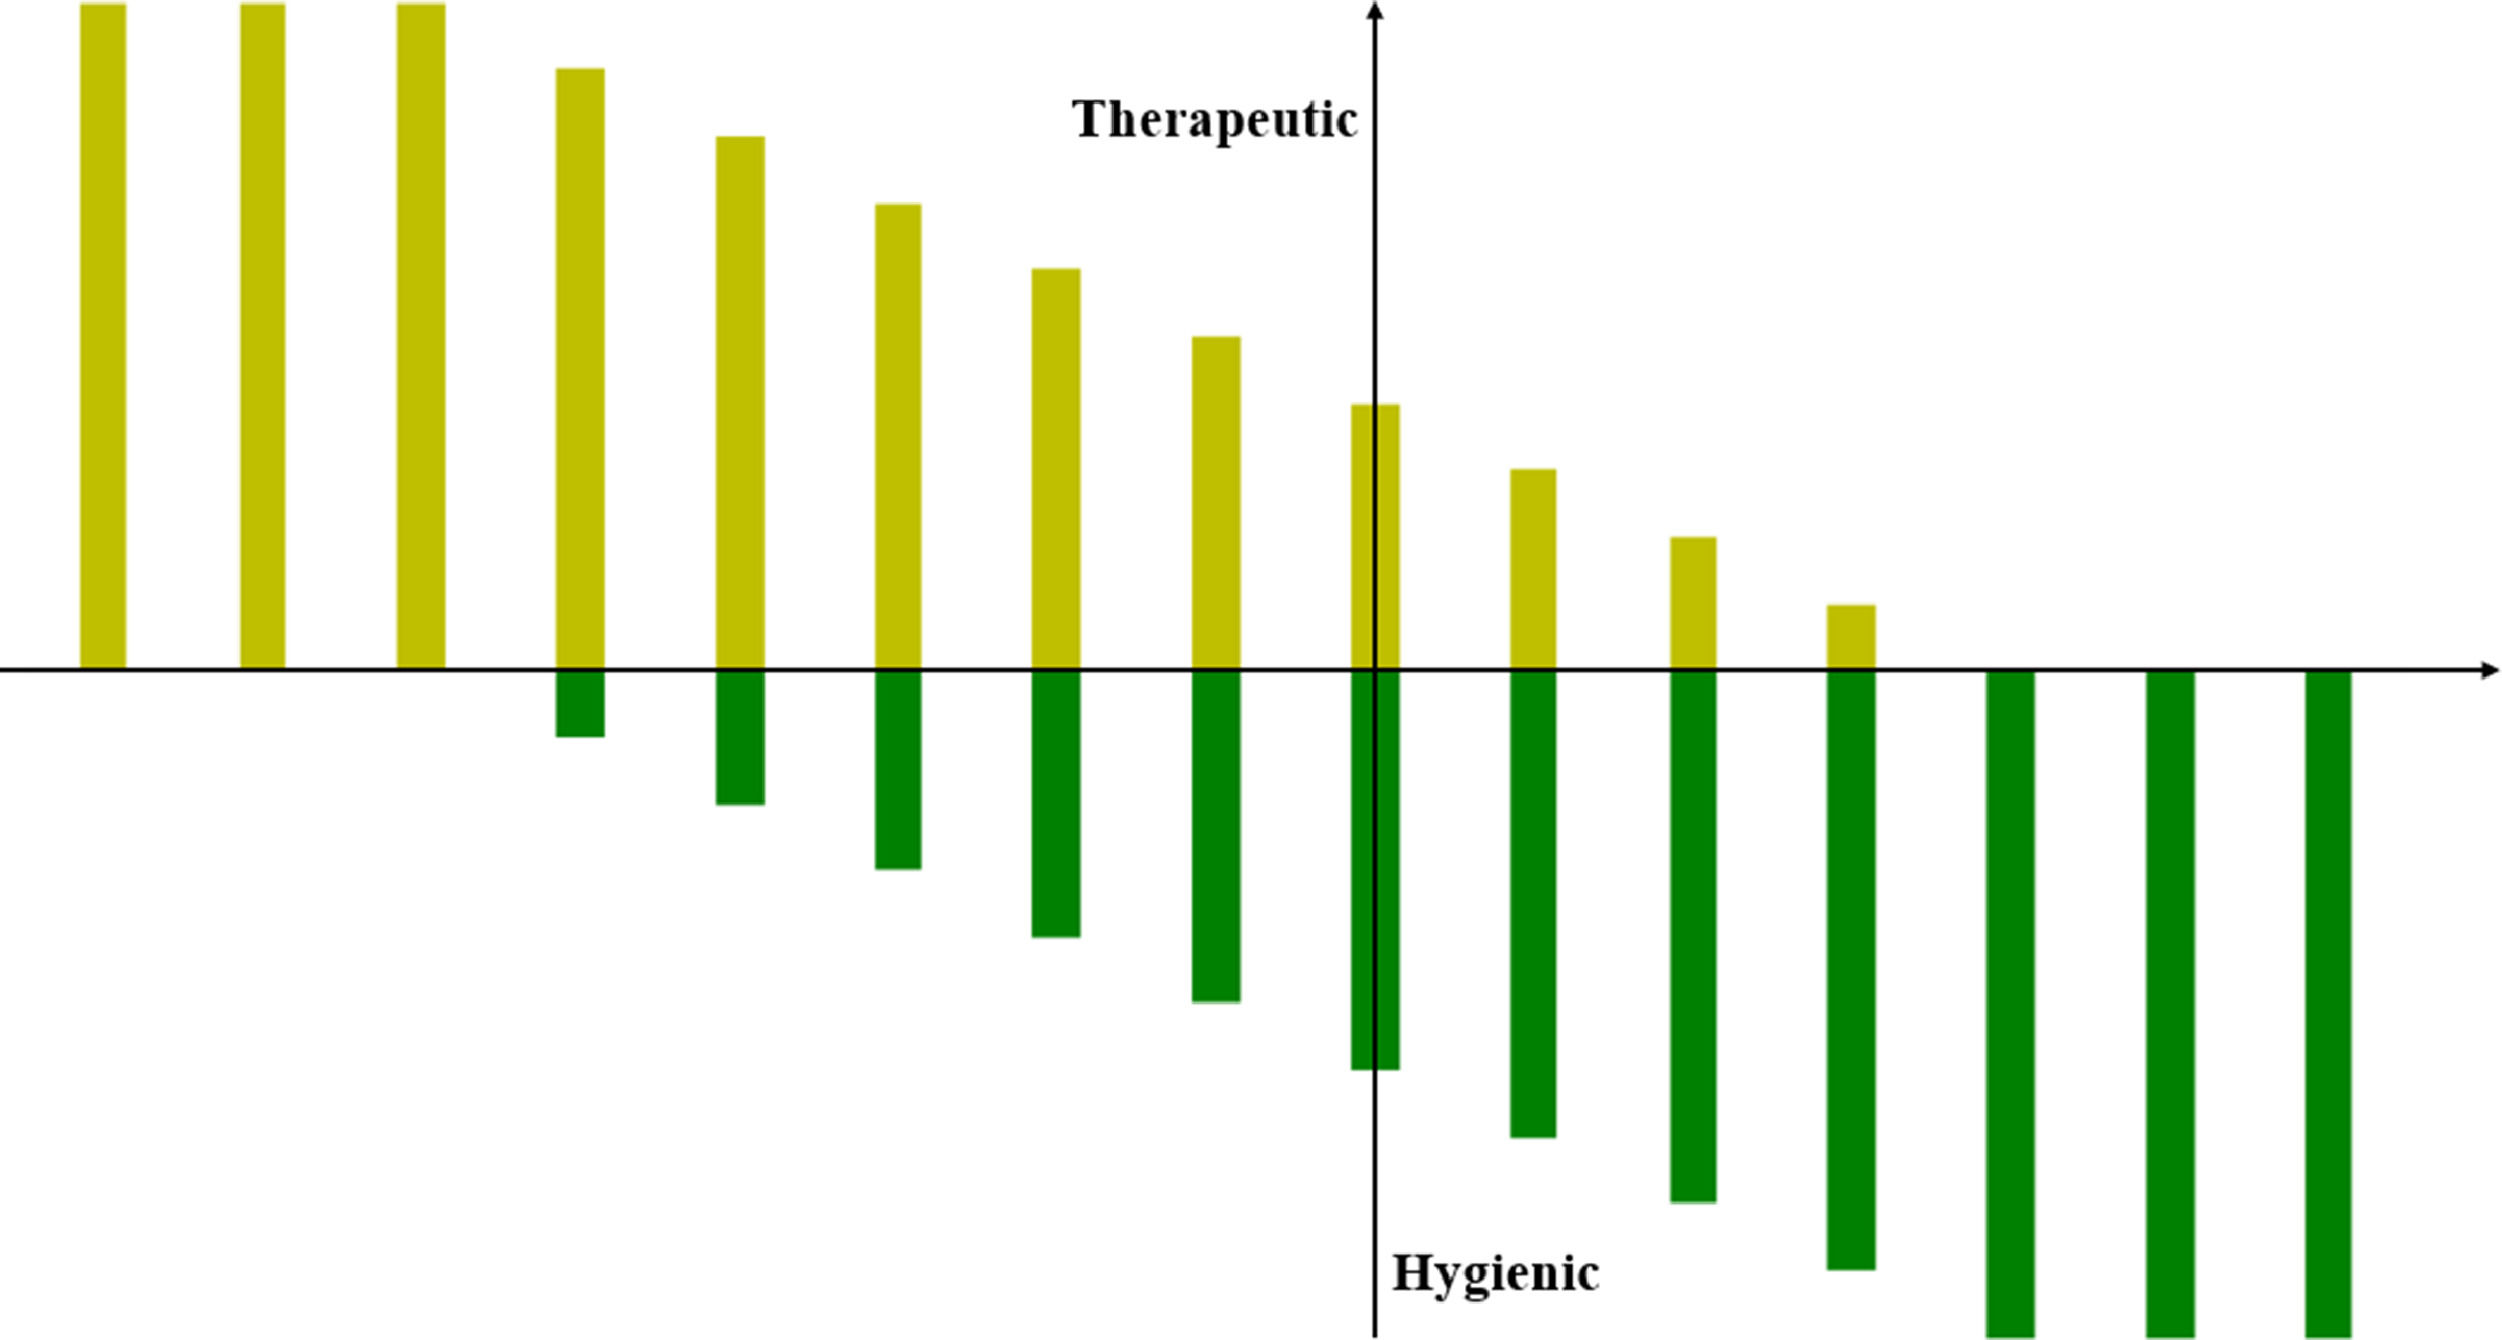
Owing to individual investor differences and the heterogeneity of each sample of holidays, the threshold at which the dispositional effect of holidays on investor sentiment switches from a therapeutic to a hygienic effect is not uniform. This makes it statistically possible that the dispositional effect of holidays on investor sentiment does not shift directly from a therapeutic to a hygienic effect but rather exists as a buffer and excess. Fig. 13 illustrates the transition from a therapeutic to a hygienic dispositional effect of holidays on investor sentiment. The Sunday holiday dispositional effect occurs at the point where its x- and y-axes meet.

Schematic Diagram of the Transition From Hygienic to Therapeutic Effects. Note: The yellow bar indicates the therapeutic effect, and the green bar indicates the hygienic effect. The combination of the length of the yellow bar and the green bar shows the disposition effect of holidays on investor sentiment.
The above analysis supports H2 and H4. Investor sentiment is significantly elevated during holidays, which has a therapeutic effect. However, when the length of holidays exceeds a certain point, the effect of holidays on investor sentiment changes from therapeutic to hygienic.
The full trading cycle consists of five trading days and two holidays. Investor sentiment rises significantly on weekends and deteriorates rapidly on Mondays. The 5+2 trading cycle leads to regular fluctuations in investor sentiment. This explanation supports H3 on a larger scale: when the stock market opens and closes at regular times, investor sentiment changes significantly and regularly.
On Saturdays, investor sentiment is elevated to a negative value in only one sample. Therefore, we do not present its statistical description in the table.
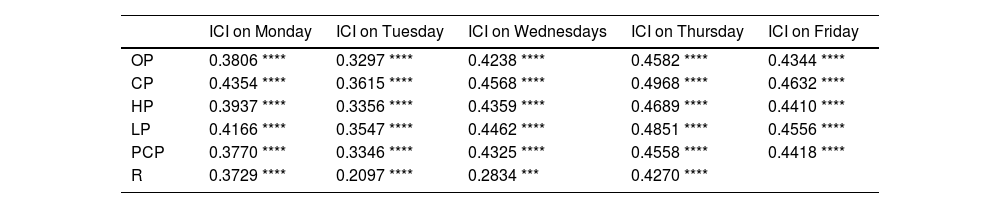
We also analyze the correlation between investor sentiment and stock prices on trading days from the weekly trading cycle perspective. Similar to the findings we obtained in our segmented sentiment analysis, investor sentiment shows an extremely significant correlation with stock market fundamentals on trading days. This finding supports H1, which states that stock prices, returns, and investor sentiment are correlated. Our summary of how Eq. (3) describes how investors feel during intra-day trading (Section 3.1) applies to how investors feel during intra-weekly trading.
ICIT=fT(Pt,Rt,…).
It is important to note that there is one exception in the data in Table 10. The correlation between investor sentiment and stock returns on Fridays is not significant. We believe that this is because, after the end of the trading week, the main factor influencing investor sentiment is no longer the return of the day.
Statistics on changes in investor sentiment over the weekend.
Note: It shows only significant data.
*, **, ***, and **** represent significance at the 0.05, 0.01, 0.001, and 0.0001 levels, respectively.
OP, opening price; CP, closing price; HP, daily high price; LP, daily low price; PCP, previous closing price; R, stock returns.
Moreover, similar to the results of the intra-day holiday investor sentiment analysis in Section 3.1, the degree of improvement in investor sentiment on Saturdays and Sundays is also not correlated (p>0.2) with stock market fundamentals (HP, LP, and R) for that week and stock price fundamentals (OP, CP, HP, LP, PCP, and R) on Fridays. Thus, the functional description of intra-day holiday investor sentiment (formula 4), summarized in Section 3.1, still applies to weekend holidays.
ICIH=ICIT+fH(t,Rt,…)
=fT(Pt,Rt,…)+fH(t,Rt,…).
In addition, based on the findings in Table 9, investor sentiment improves substantially at the beginning of holidays (Saturdays), whereas on Sundays, about 2/3 of the sample investors’ sentiment no longer improves. This finding supports H2 and H4 that the dispositional effect of holidays on investor sentiment shifts from a therapeutic to a hygienic effect when the length of the holiday exceeds a certain threshold. Thus, the functional description of intra-day investor sentiment summarized in Section 3.1 of this paper (Formula 5) still applies to the more macroscopic weekend holidays:
ICIH={ICIT+fH(t,Rt,…)(t≤t0)ICIT+fH(t0,Rt,…)+fL(Et,L,…)(t>t0).
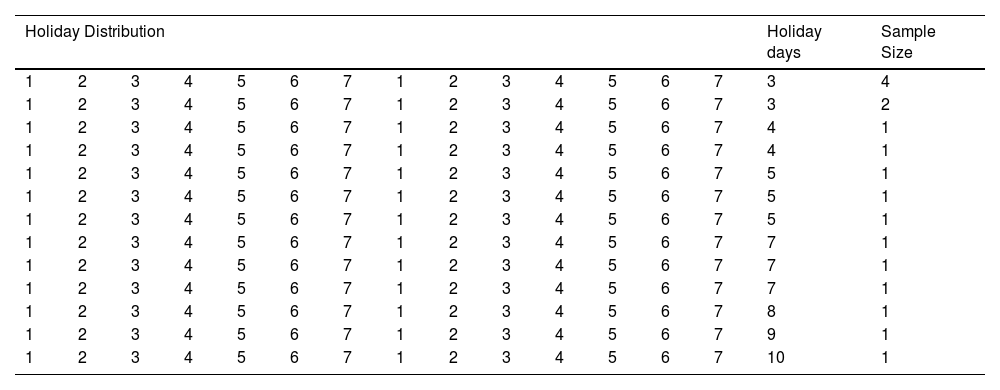
Analysis of investor sentiment for atypical holidaysIn the stock market, a typical trading cycle consists of five trading days and two holidays. However, this typical cycle can sometimes be broken, resulting in more than three consecutive days of holidays. This atypical holiday may be caused by a “special holiday” or generated by a stock market closure due to anomalies in the stock market, such as a continuous downward or upward spike. In this study, there were 17 consecutive atypical holidays on the Shanghai Stock Exchange between January 1, 2019, and December 31, 2021. These special holidays range from a minimum of three days to a maximum of 10 days. Table 11 shows the distribution of 17 atypical holidays.
Statistics on the distribution of irregular holidays.
Note: The numbers 1-7 in the Holiday Distribution column represent Monday to Sunday.
White padding represents trading days; light green padding represents holidays.
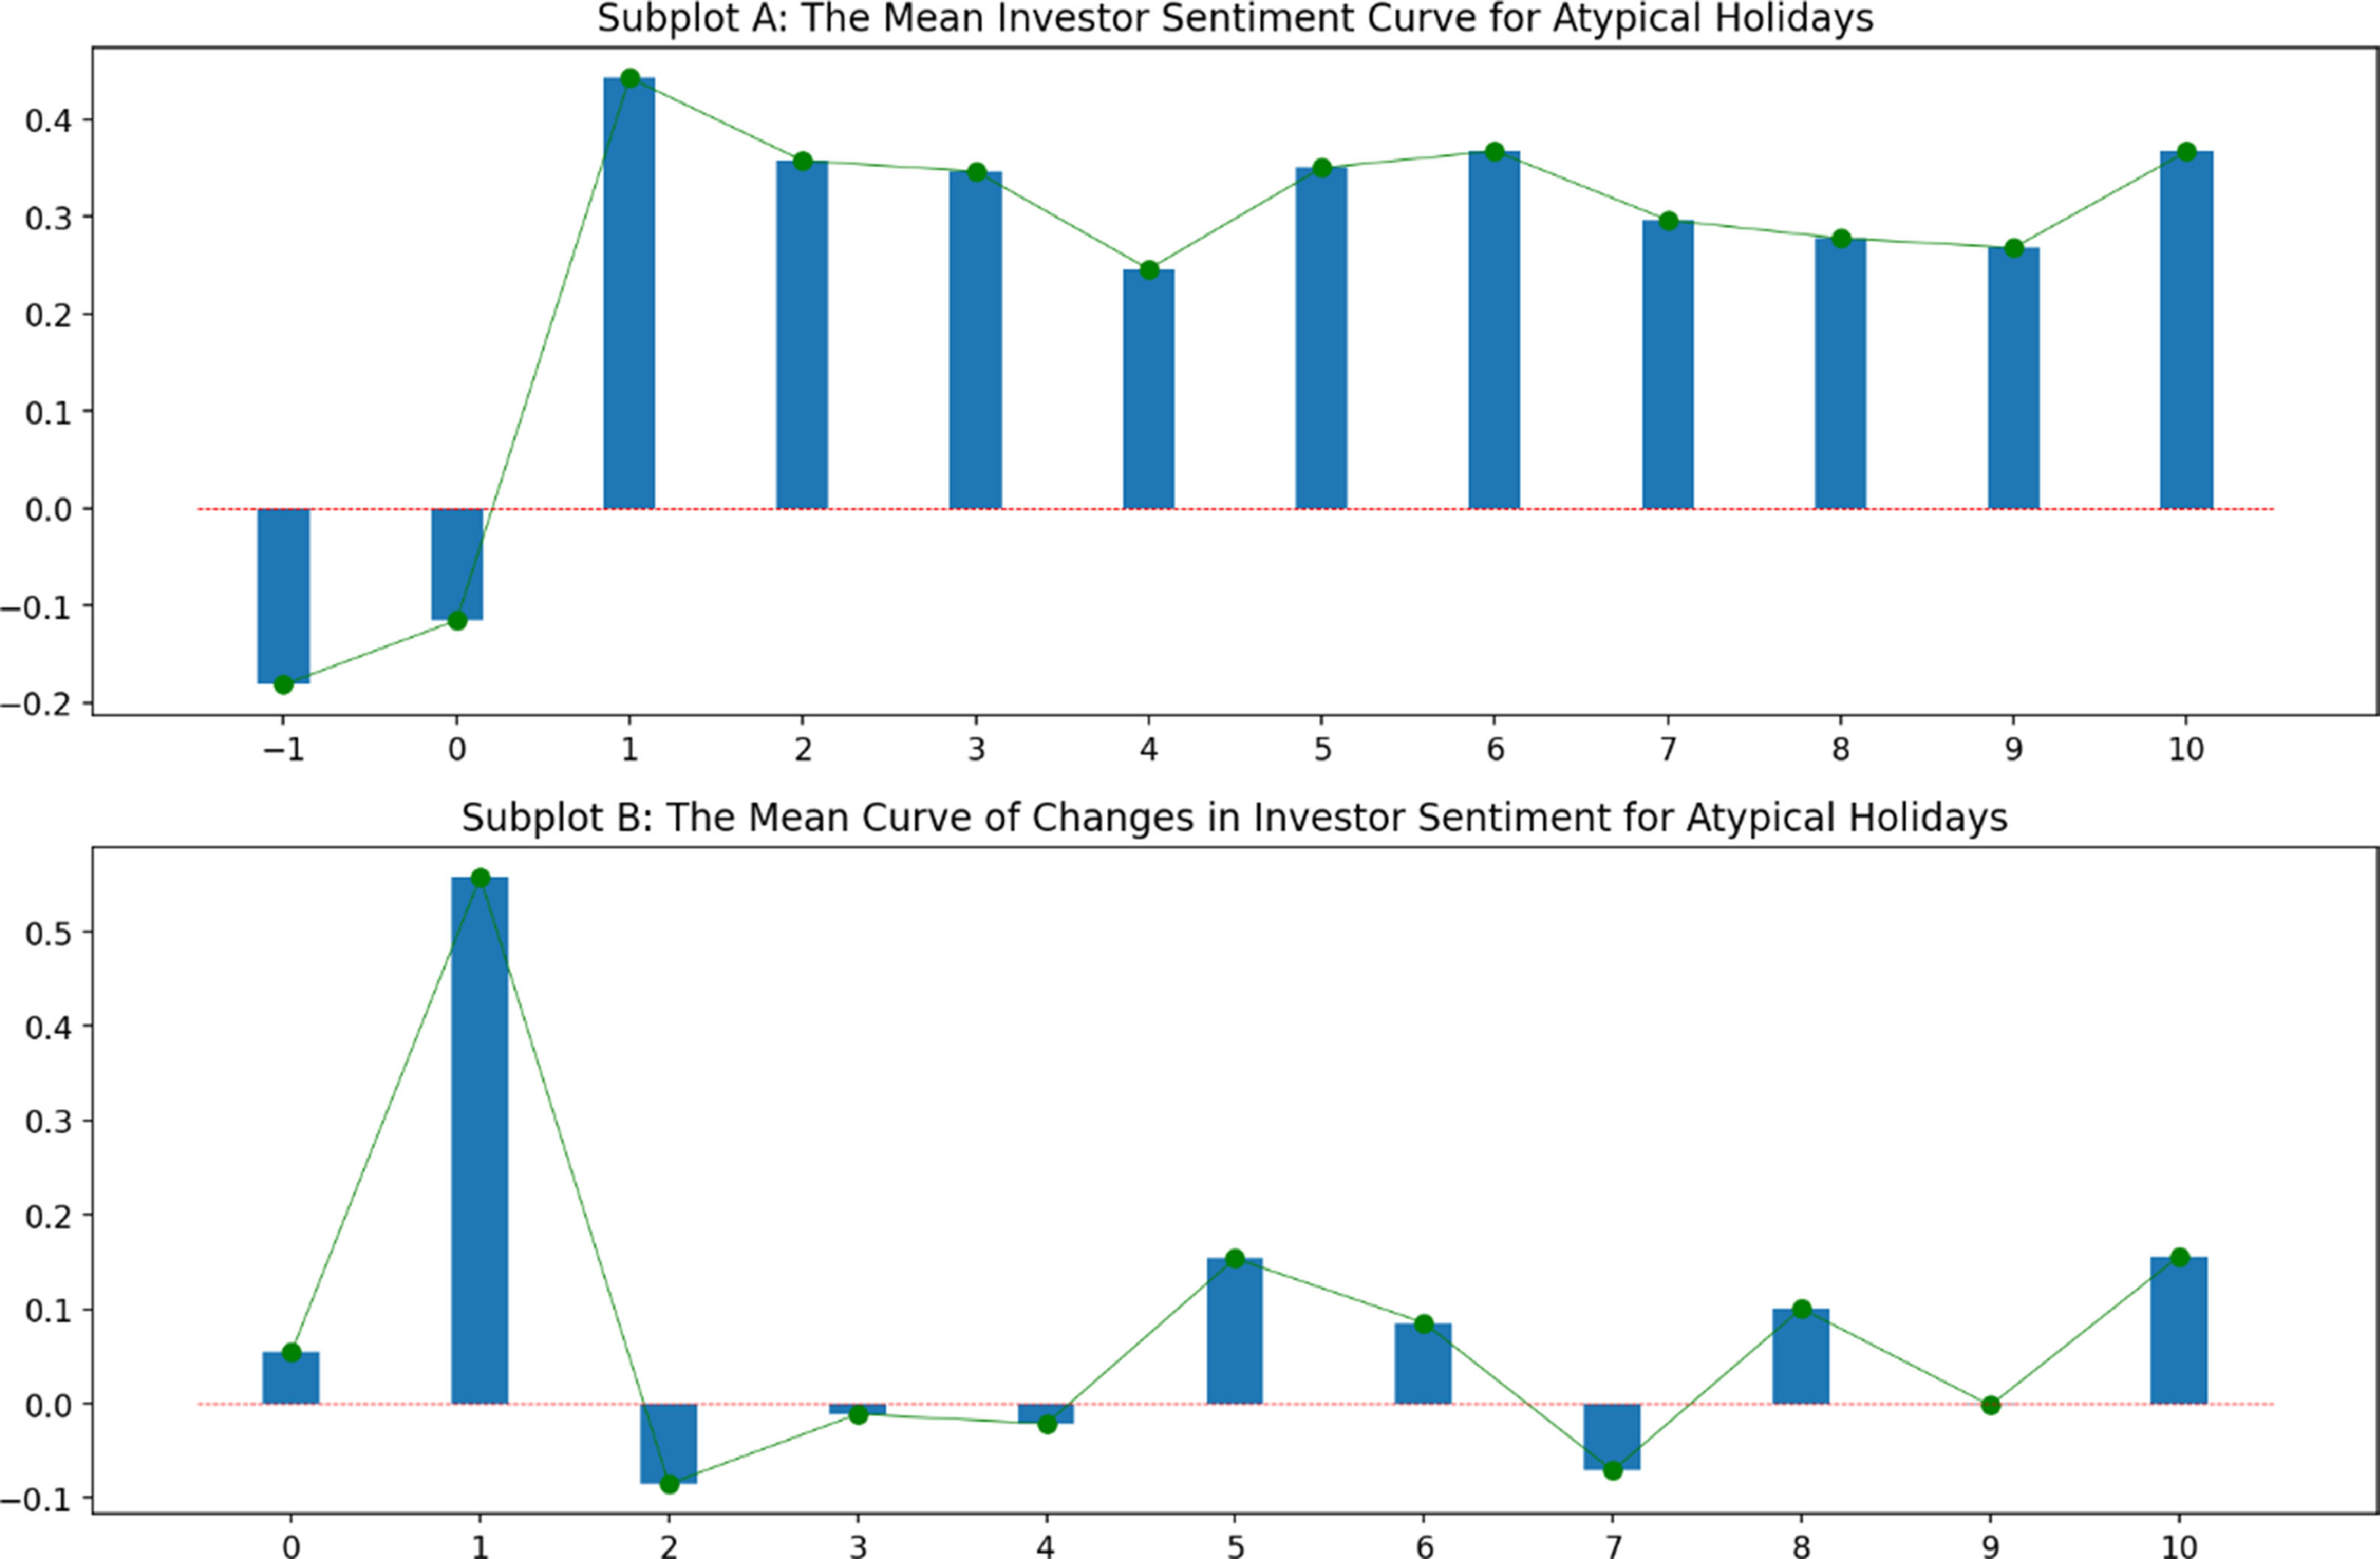
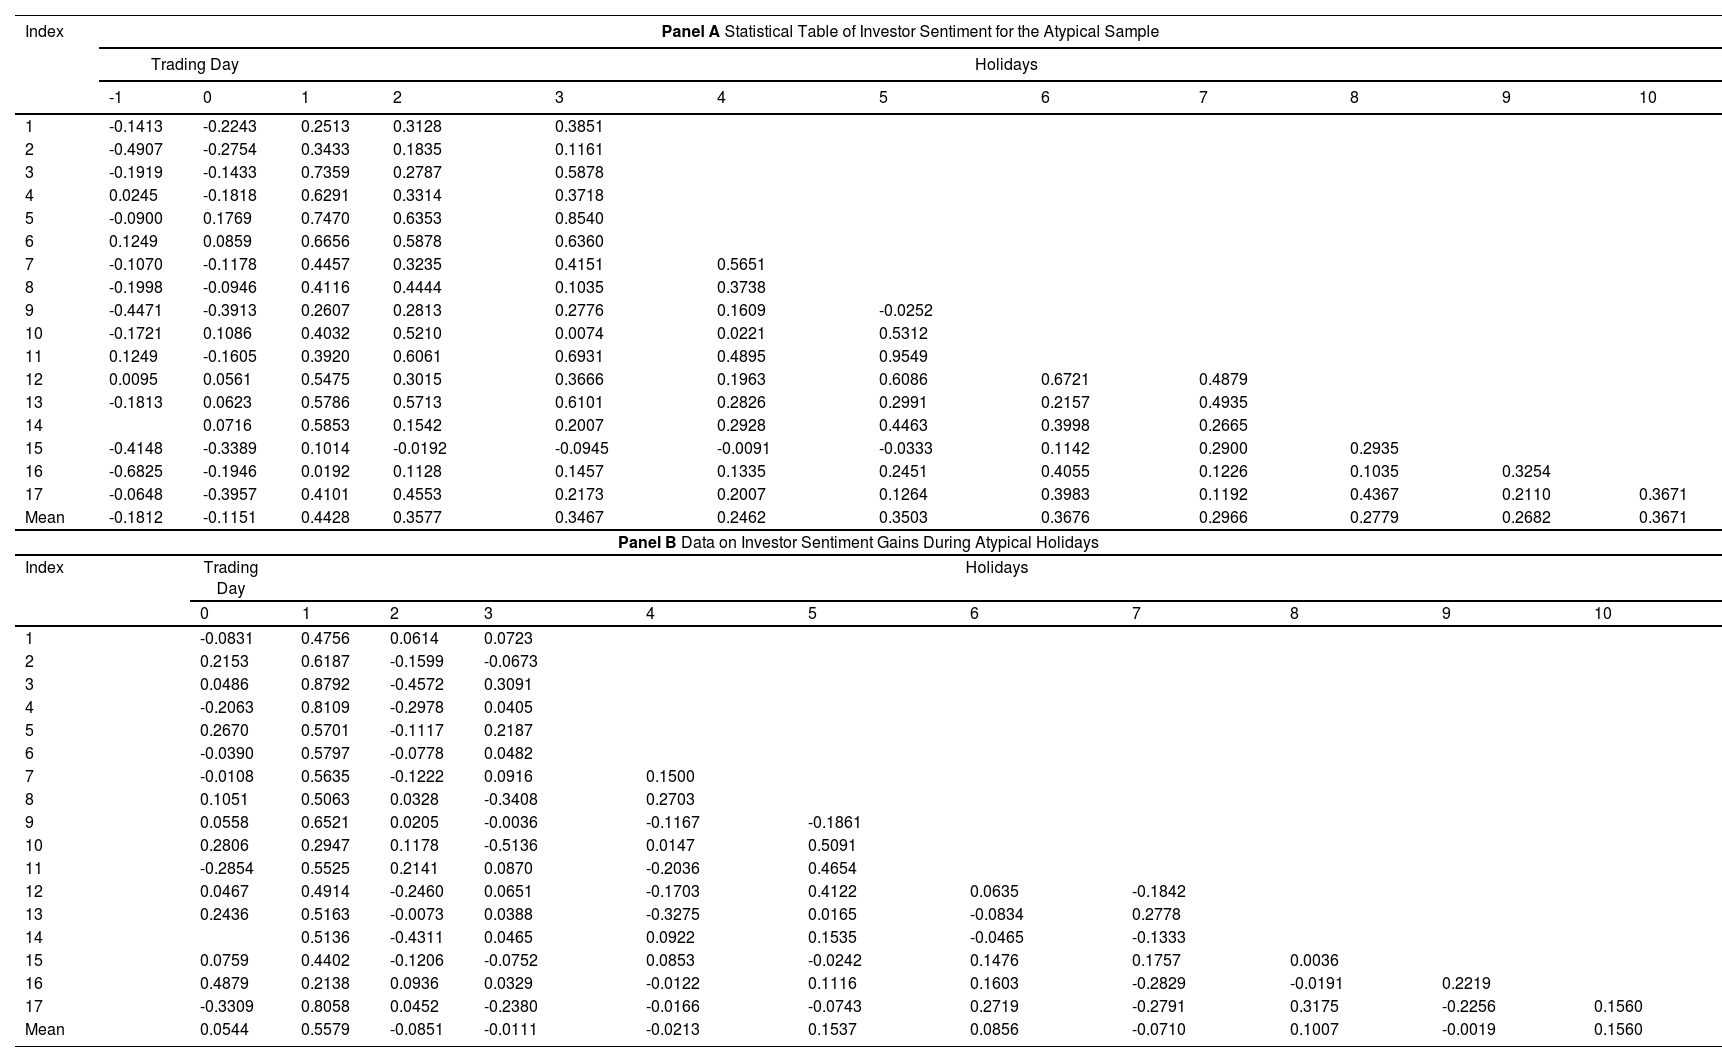
Table 12 shows investor sentiment and fluctuations for 17 atypical holidays. Panel A shows the specific values of investor sentiment two days before and during holidays. Panel B shows the fluctuations in investor sentiment on the day before and during the holiday. The fluctuating values are the differences between the current day's investor sentiment and the previous day's investor sentiment. To see how investor sentiment changes during holidays that are not typical, we plot Fig. 14 with the mean data from Panels A and B in Table 12. Subplot A in Fig. 14 corresponds to Panel A of Table 12. Subplot B of Fig. 14 corresponds to Panel B of Table 14.
Statistics of investor sentiment during atypical holidays.
Note: The numbers -1 and 0 in Panel A represent the two trading days before the holiday, and the natural numbers 1 to 10 represent consecutive holidays. Panel A presents the current-day investor sentiment. The value 0 in the Panel B table header represents the last trading day before the holiday, and 1–10 represents consecutive holidays. Panel B shows the volatility of investor sentiment, and its value is the difference between the investor sentiment on that day and the previous day.

As shown in Fig. 14, investor sentiment rises substantially on the first day of the holiday and shows irregular fluctuations during the subsequent holiday but remains at high levels relative to the trading day. This finding supports H2 and H4. Holidays make investors feel better, but when they last longer than a certain amount of time, the effect changes from therapeutic to hygienic.
The trading-day columns of Panels A and B each have one data blank, which is caused by the non-existence of this data.
In summary, we test our hypotheses from three perspectives: the state of change in investor sentiment during a day, during a week, and during atypical holidays. Among them, we verify H1 to H4 using the change in investor sentiment within one day and within one week. H2 and H4 are further tested by examining how investor sentiment changes during unusual holidays.
Additional evidence based on causal inferenceWe conduct a qualitative analysis of the dispositional effect of holidays on investor sentiment, which is the central issue of this study. In this section, we use recent advances in machine learning in the area of causal inference (Cui & Athey, 2022; Pearl, 2019) to further quantitatively argue for the dispositional effect of holidays on investor sentiment.
Inference methodCausal ML is a Python package that provides a suite of uplift modeling and causal inference methods using machine learning algorithms based on recent research. Essentially, it estimates the causal impact of intervention T on outcome Y for users with observed features X without strong assumptions on the model form. We quantify the dispositional effect of holidays on investor sentiment by comparing the causal effect of stock prices on investor sentiment in samples from the control and treatment groups.
The assessment process consists of two stages as follows:
Stage 1 Estimate the average outcomes μ0(x) and μ1(x):
using machine learning models.
Stage 2 Define the Conditional Average Treatment Effect (CATE) estimate as follows:

The investor sentiment YT for the trading session can be considered an estimate based on X[OP,CP,HP,LP,PCP,R]. Investor sentiment YH for the holiday period can also be considered an estimate based on X. The causal inference machine learner estimates the impact of holidays on investor sentiment EH by inferring the difference in the causal impact of the dependent variable X on the target scalar Y for samples in the control and treatment groups.
The estimated dependent variable, X, is the same for a set of simultaneous control group samples (trading hours) and treatment group samples (holidays). The disposition effect can be approximated as follows:
m is the number of samples in the control group, and n is the number of samples in the treatment group. Causal inference machine learning does not require the same size of control group samples as treatment group samples. However, a small sample size can produce conclusions that are not statistically significant. Based on the functional description of investor sentiment in Section 3, the therapeutic effect of holidays can be described as

In our model, within the same context, the treatment effect of holidays is mainly caused by stock returns in the trading session and the length of the holiday.
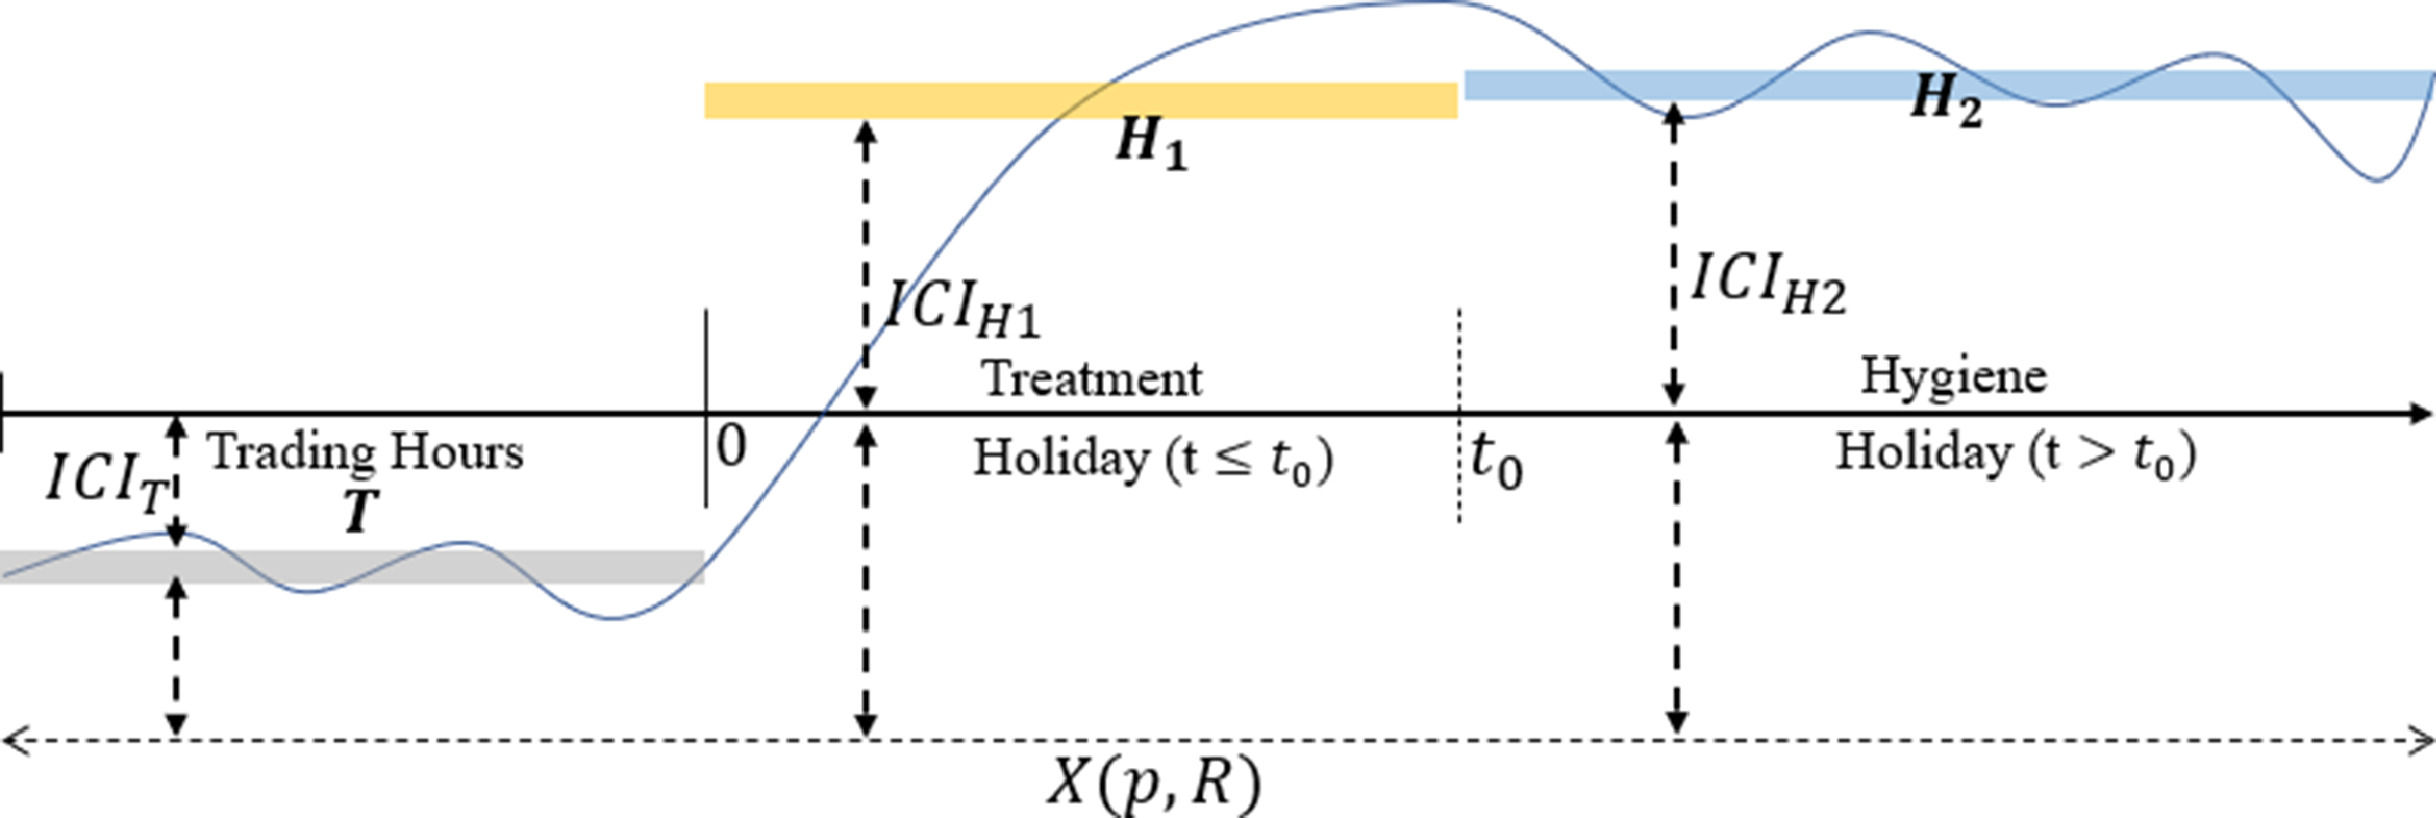
As shown in Fig. 15, if there are two consecutive holidays H1 and H2 after trading period T, the disposition effects of holidays H1 and H2 are both therapeutic. Then, the difference in the causal effects of holidays H1 and H2 can be described as:


Within the same context, the main factor influencing the dispositional effect of the holiday at this point is the phase in which the holiday takes place. If holiday H1 has a therapeutic effect and H2 has a hygienic effect, then
.
Since t1 is close to t0 at this point,

Within the same context, the main factors that affect how investors feel are the random sentiments caused by work, life, and daily events.
If the dispositional effects of both H1 and H2 are therapeutic, investor sentiment shows an upward trend on the time axis t. There is a large difference between EH1 and EH2(Eq. (10)). If the effect of H1 is therapeutic and that of H2 is hygienic, there is no coherent upward trend in investor sentiment on the time axis. In this case, the value of EH2−EH1 is smaller and is explained mainly by the emotional fluctuations underlying human life, work, and the influence of daily events (Eq. (10)). We can determine whether the excess holidays H1 to H2 is a continuous therapeutic effect or an excess from a therapeutic to a hygienic effect by judging the difference between EH1 and EH2.
We are required to set a reasonable threshold to determine whether the excess from holiday H1 to holiday H2 is a switch from a therapeutic to a hygienic effect. Based on the findings in Section 3.2, the dispositional effect of Sundays on investor sentiment includes both therapeutic and hygienic effects in the samples. The dispositional effect of approximately two-thirds of the sample is hygienic, and the dispositional effect of about one-third of the sample is therapeutic. The junction of the x-axis with the y-axis in Fig. 13 in Section 3.2 indicates the location of the dispositional effect of Sunday holidays on investor sentiment. At this point, the dispositional effect of holidays is dominated by the hygienic effect, and as EH2−EH1 becomes smaller, the proportion of the therapeutic effect gradually shrinks, and the hygienic effect dominates. However, due to the complex external environment, it is difficult to estimate an exact value to indicate how large EH2−EH1 is when the dispositional effect of holiday H2 is completely therapeutic or how small EH2−EH1 is when the dispositional effect of holiday H2 is completely hygienic.
Based on 129 trading cycles, the mean difference between investor sentiment on Sundays and that on Saturdays is 0.069. This difference can be considered an approximate estimate of EH2−EH1. As a result, we set α=0.069. When EH2−EH1≤α, the hygienic effect dominates the disposition effect of holiday H2, and the smaller its value, the greater the proportion of the hygienic effect. Conversely, when EH2−EH1>α, the dispositional effect of H2 cannot be judged as predominantly hygienic. The larger the value, the higher the proportion of the therapeutic effect. Thus, the effect of the H2 holiday on investor sentiment is as follows:
EH2={EH2−EH1≤α:MainlyforHygieneEH2−EH1>α:NotMainlyforHygiene.
More conclusions can be drawn when we assume that the transition from therapeutic to hygienic effect shown in Fig. 13 is continuous rather than jumping. When EH2−EH1 tends to zero, it is the ideal state for the interpretation of holiday H2 as a hygienic effect. However, since sentiment on social media is influenced by life, work, rest patterns, and various external influences, this is only an ideal assumption. Similarly, the dispositional effect of holiday H2 is dominated by the hygienic effect (the proportion of hygienic effect is not less than 50%) when EH2−EH1≤α, then, EH2−EH1=2α is the minimum value of holiday H2 that can be completely explained by the therapeutic effect.
Different machine-learning algorithms have their own advantages and disadvantages. In this study, four basic algorithms (LGBM, XGB, random forest, and linear regression) are used for causal inference. The final results are then considered as the mean values from the above algorithms. This provides a reliable and fair conclusion.
Causal inference analysisArgument for the therapeutic effect of holidaysWe use the intra-day sentiment segmentation method shown in Fig. 7 to divide a typical trading day into three holidays and two trading periods. Similarly, we use A, B, C, D, and E to represent the five time periods. We assess the causal effect of holidays on investor sentiment by comparing the difference in the impact of stock market fundamentals (X[OP,CP,HP,LP,PCP,R]) on investor sentiment (Y) between holiday periods and trading periods.
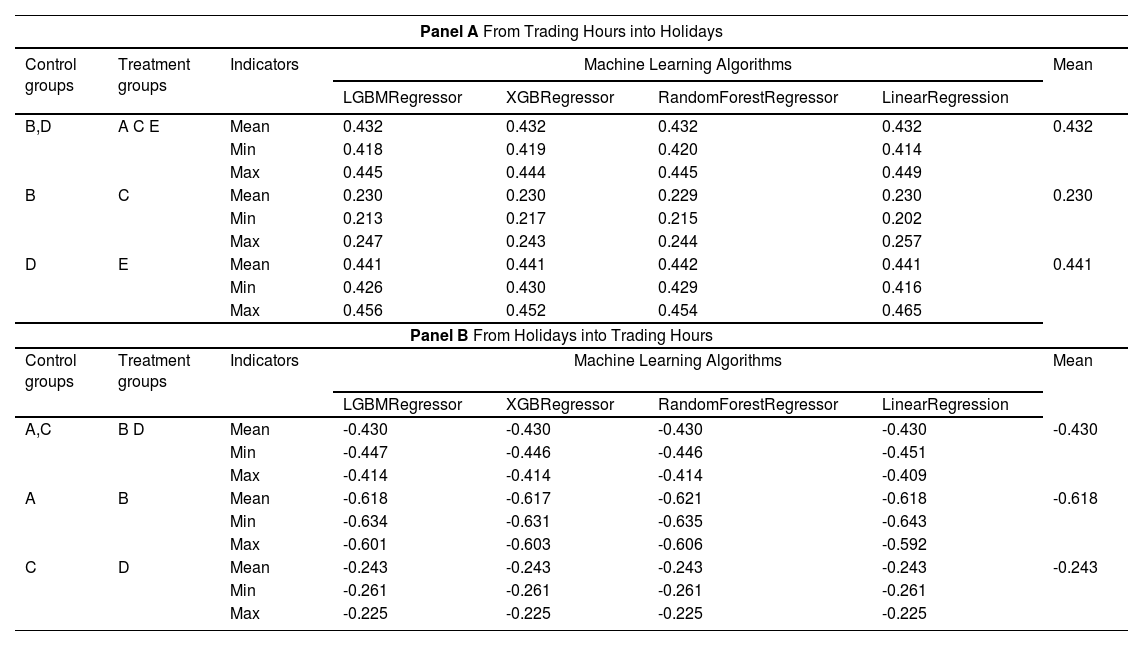
Table 13 presents the results of the causal inference of investor sentiment for these five segments. Panel A uses trading periods as the control group and holidays as the treatment group to verify the dispositional effect of holidays on investor sentiment. In contrast, Panel B uses holiday periods as the control group and trading periods as the treatment group to observe this causal relationship in reverse. As Panel A shows, the average disposition effect of holidays on investor sentiment during a trading day is 0.432. Combined with the data in Table 6, this shows that there is a very strong treatment effect. The data in Panel A also show that the therapeutic effect on investor sentiment is higher after the afternoon closure than during the midday closure. The results in Panel B of Table 13 show the disposition effect of a trading session on investor sentiment, using holidays as a control group, is -0.430. In addition, the statistical results show that the deterioration in investor sentiment is significantly higher in the first trading session of the day than in the second trading session.
Causal inference of 5-segment sentiment.
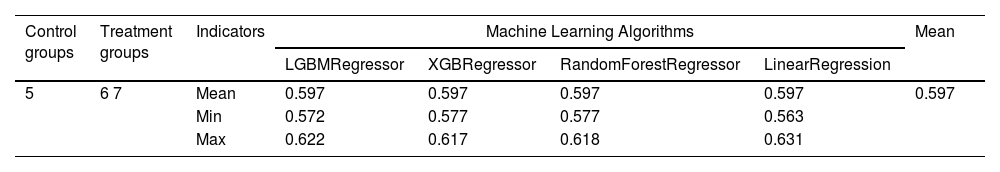
We analyze the causal effect of holiday weekends on investor sentiment using Fridays as the control sample and Saturdays and Sundays as the treatment samples. Table 14 shows the causal effect of holiday weekends on investor sentiment, with a mean therapeutic effect of 0.597. The causal inference results in Tables 13 and 14 clearly support H2 of this paper. When the stock market opens, investor mood decreases, but investor sentiment increases significantly when holidays occur. Holidays have a therapeutic effect on investor sentiments.
Weekend holiday effect analysis (A).
Note: 5 denotes Friday, 6 denotes Saturday, and 7 denotes Sunday.
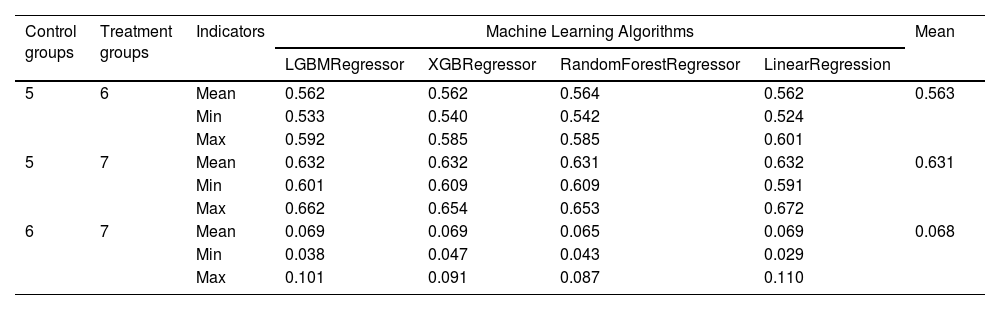
Following the methodology elaborated in Section 4.1, we first identify the hygienic effect of Sunday holidays on investor sentiment by analyzing the difference between the dispositional effects of Saturdays and Sunday holidays on investor sentiment. Table 15 tabulates the causal inference results with Friday as the control group data and Saturday and Sunday as the treatment group data. The dispositional effect of the Saturday holiday on investor sentiment (E6) is 0.563, whereas that of the Sunday holiday (E7) is 0.631, and the difference between them is 0.068 (E7−E6). This finding is consistent with the causal inference results using Saturday as the control group and Sunday as the experimental group. In addition, since the threshold α=0.069, E7−E6<α, it can be argued that the hygienic effect dominates the effect of the Sunday holiday on the disposition of investor sentiment.
Weekend holiday effect analysis (B).
Note: 5 denotes Friday, 6 denotes Saturday, and 7 denotes Sunday.
Golder and Macy (2011) argued that routine, work, and sleep all impact human emotions. These external environmental influences on investor sentiment may become important factors that influence investor sentiment fluctuations once the holiday effect enters the hygiene phase. To reduce the influence of these factors, we divide the 24 hours of a day into eight segments of three-hour intervals each. The difference in the impact of Saturday and Sunday holidays on investor sentiment is compared in segments. Consistent with Section 3, we refer to 00:00 hours–02:59 hours as ts1, with ts1–ts8 for each of the eight segments.
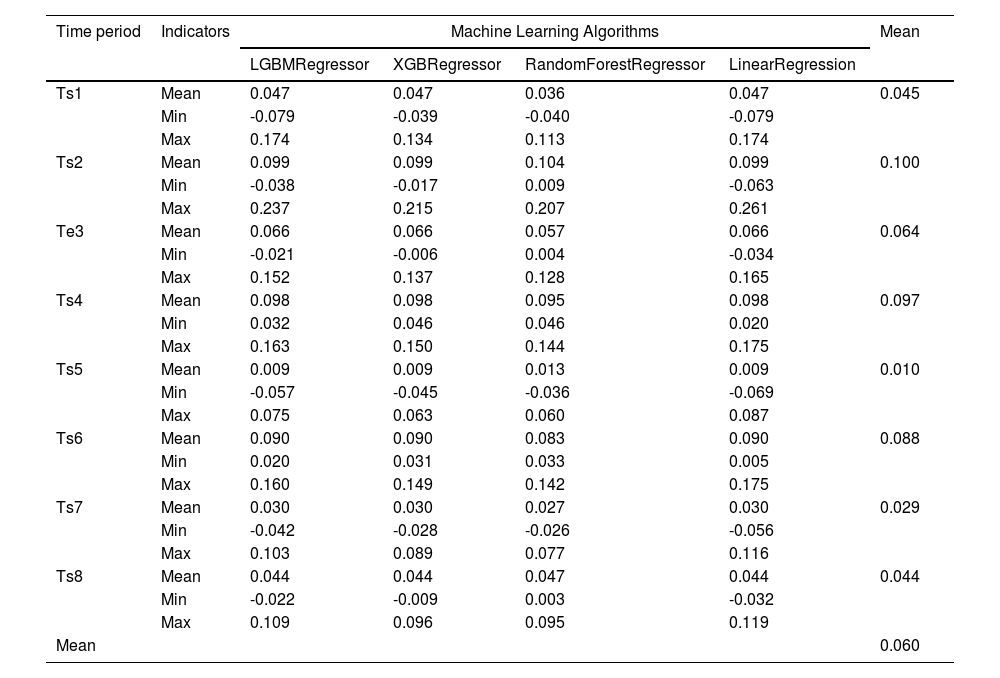
We use data from each segment of Saturday as the control group and data from each segment of Sunday as the treatment group to analyze the difference between the impact of Sunday and Saturday holidays on investor sentiment. The results of causal inference are presented in Table 16. The analysis results show significant differences in the dispositional effects of holidays on investor sentiment at different times of the day. The dispositional effect of holidays on investor sentiment can be disturbed by work and rest patterns. Conversely, the mean difference in investor sentiment over eight time periods (E7−E6) is 0.060, which meets the condition that E7−E6<α. Thus, the disposition effect of Sunday holidays on investor sentiment is believed to be dominated by the hygienic effect. This finding is consistent with the analysis results presented in Table 15.
Causal inference of 8-segment sentiment.
In this section, we use machine learning causal inference to further examine holidays' therapeutic and hygienic effects on investor sentiment. We did not use machine learning causal inference to analyze the relevance of atypical holidays. This is because making inferences from a small sample size using causal inference machine learning is unreliable.
Further discussionWe have studied and argued for the dispositional effects of holidays on investor sentiment: therapeutic and hygienic effects. This section focuses on whether COVID-19 has an impact on these findings. Moreover, we describe the similarities and differences between our findings and those of previous studies.
COVID-19′s influenceTo investigate whether COVID-19 impacted our findings, we compare the difference in the effect of holidays on investors' emotional disposition before and during COVID-19. The seriousness of COVID-19 was first realized on January 23, 2020, when the Chinese government announced a lockdown in Wuhan to prevent the spread of the epidemic. Therefore, it can be assumed that January 23, 2020, was the point at which COVID-19 began (Cao et al., 2020). Therefore, we use the data from January 1, 2019, and January 22, 2020, as the sample data before the onset of COVID-19, which consist of 259 trading days. The data between January 23, 2020, and February 22, 2021, are used as the sample data during the epidemic (also consisting of 259 trading days). The impact of COVID-19 on our findings is examined by comparing and analyzing the differences in the effect of holidays on investor sentiment disposition between the two intervals.
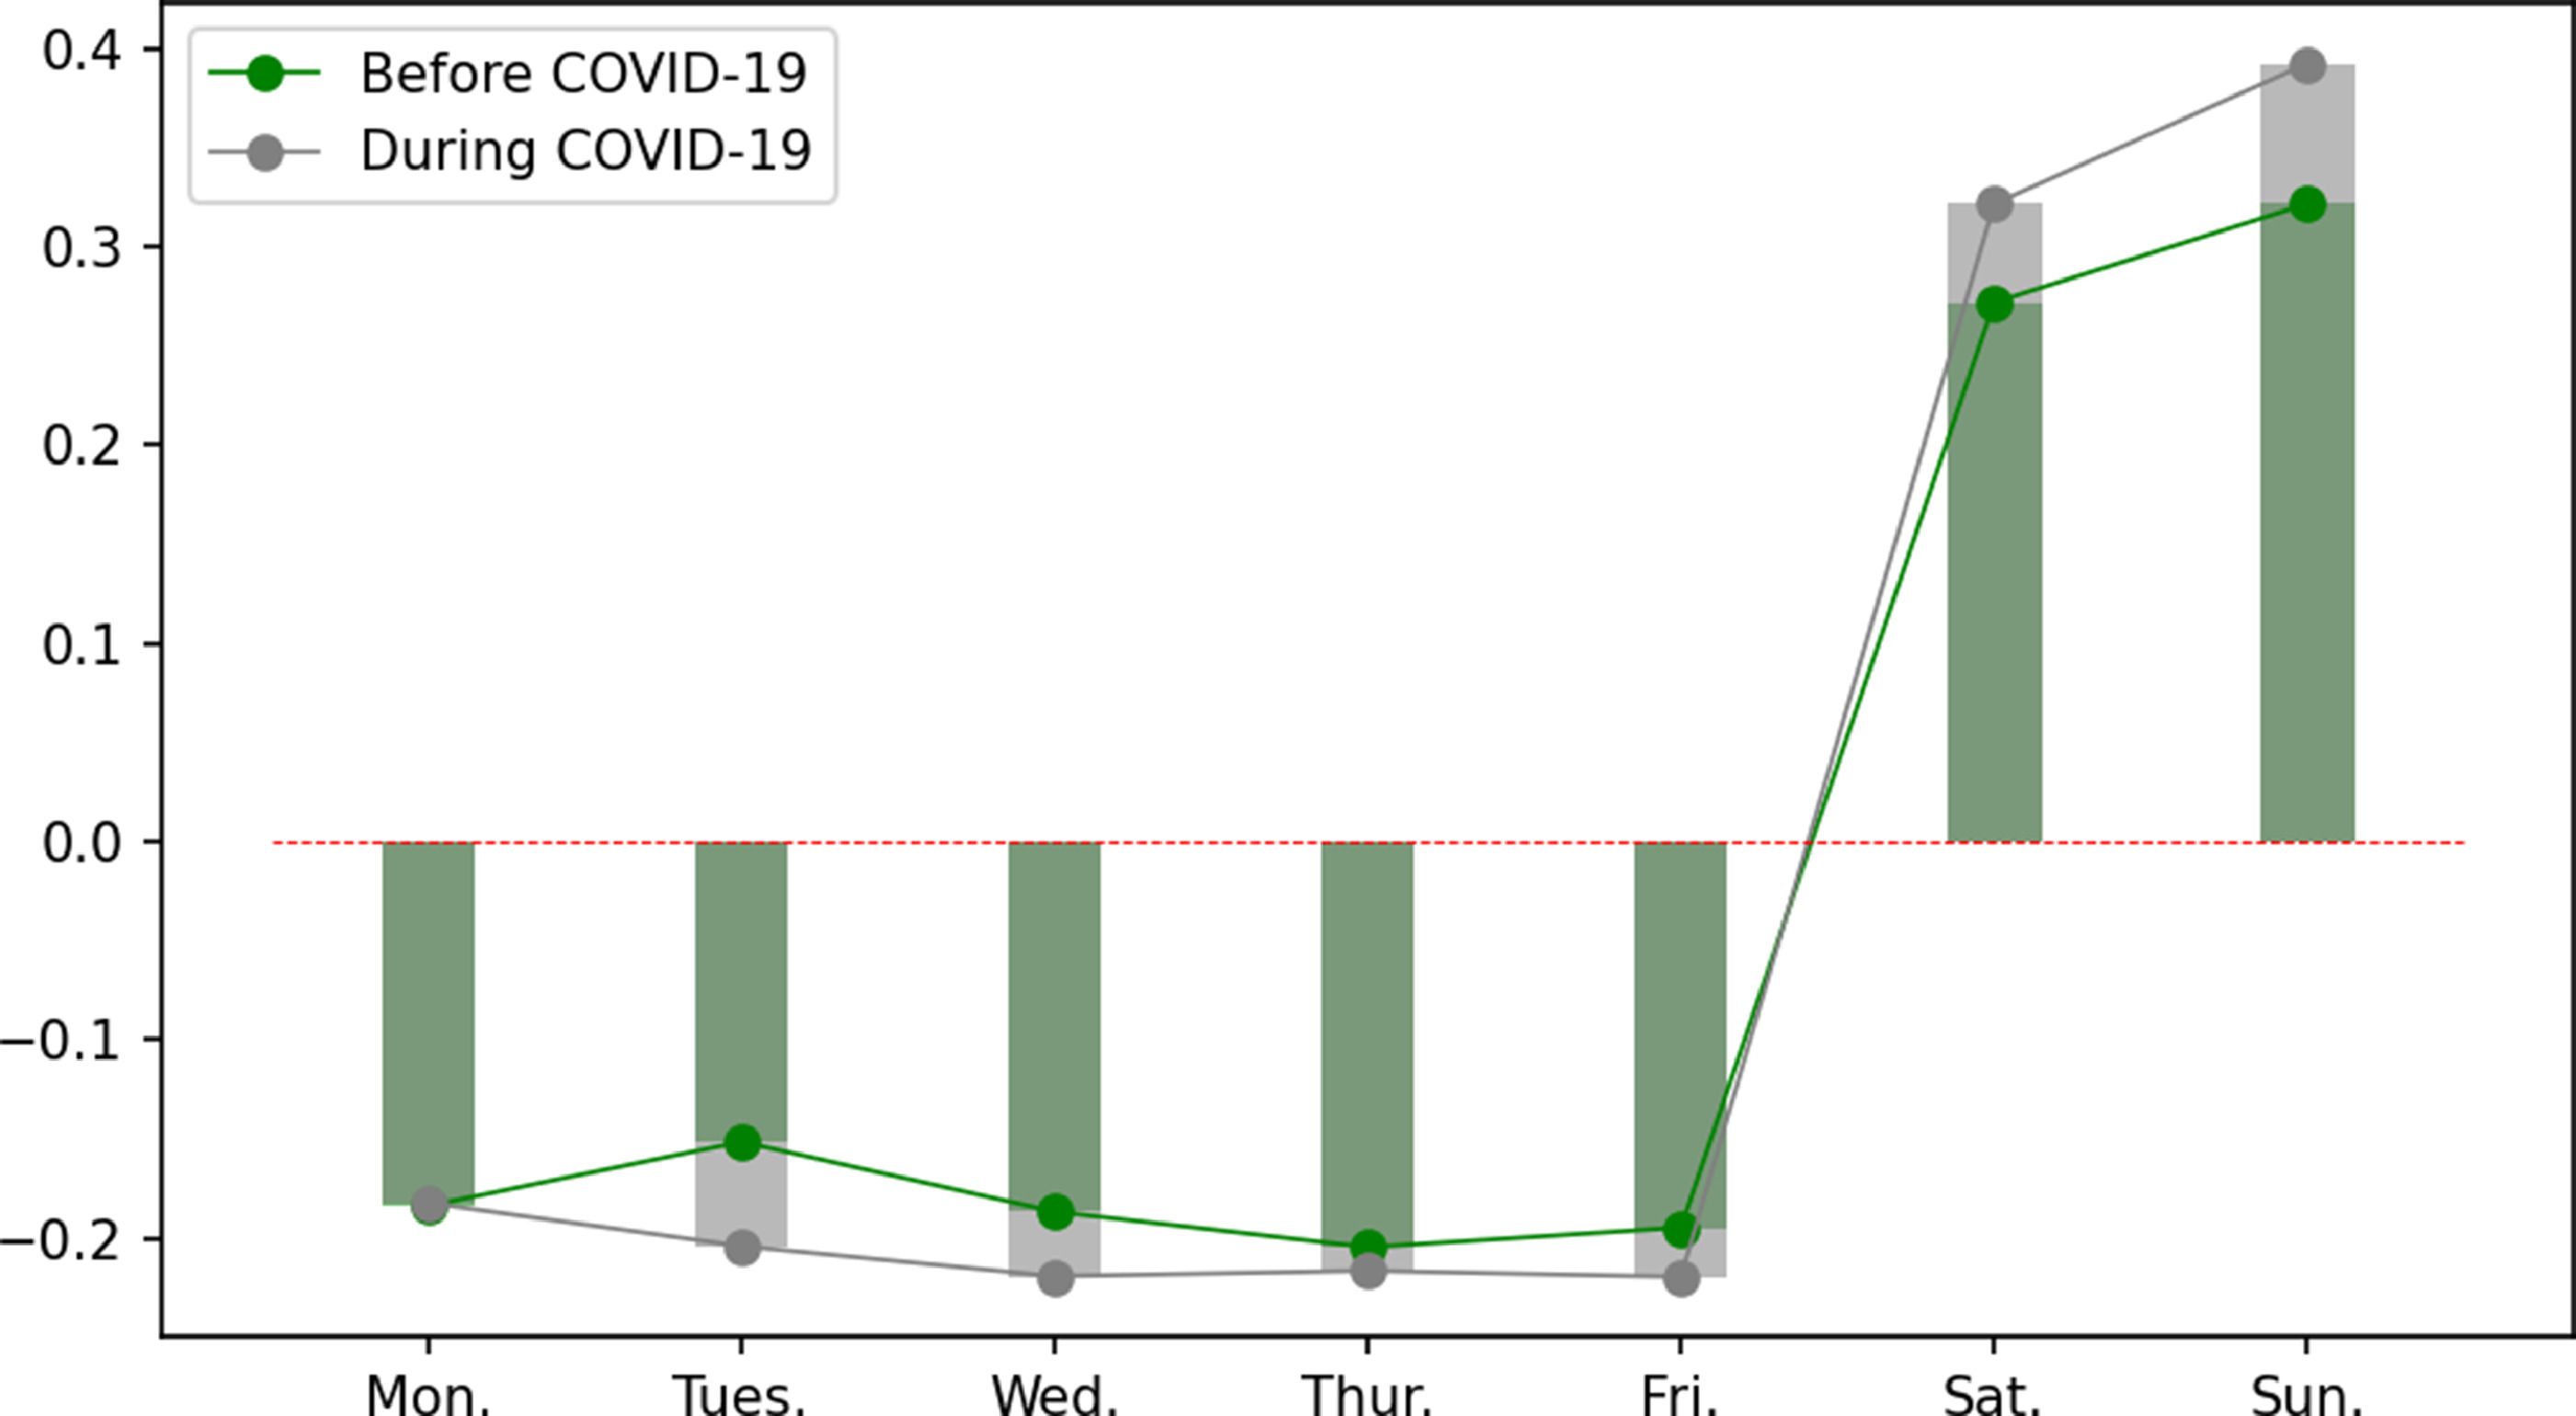
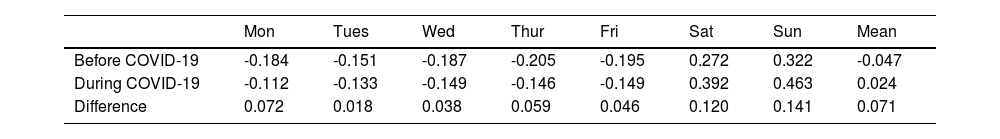
Table 17 shows the intra-week variations in investor sentiment before and during the COVID-19 pandemic. There are two points of interest in the statistics. First, the dispositional effect of holidays on investor sentiment is evident, both before and after the epidemic. Second, investor sentiment during COVID-19 is higher on each day of the week than before COVID-19. Fig. 16 is made from the data in Table 17, which shows the above results.

First, we exclude a confounding phenomenon that is not relevant to our main study, that is, the significant increase in investor sentiment during COVID-19. There are two possible explanations for this phenomenon: it is caused by either COVID-19 or market fundamentals. Although investor sentiment on social media differs from traditional investor sentiment and is a more microscopic expression of sentiment, social media sentiment is also an expression of investor beliefs about future cash flows and investment risk (Baker & Wurgler, 2007). Pang and Lee (2008) argued that social media sentiment responds to the question of "what users think." It is neither common sense nor supported by the literature if we assume that the occurrence of COVID-19 caused investor sentiment to be hopeful about the future of the stock market. Therefore, we believe that stock market fundamentals were the cause of the sharp rise in investor confidence during COVID-19.
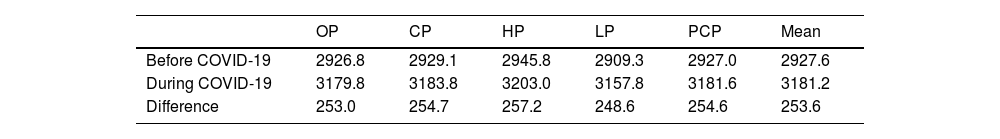
The subject of the social media data used in this study is the SSE Index; therefore, social media sentiment reflects investors' beliefs about the future cash flows and investment risks of the SSE Composite Index. Table 18 shows the fundamentals of SSE for 259 trading days before and 259 trading days during the COVID-19 period. It can be seen that the SSE during the COVID-19 period is significantly higher than before that period. Therefore, the overall higher average investor sentiment during COVID-19 than before COVID-19 is driven by stock market fundamentals. This finding is consistent with the description of Eq. (3) in this study and with previous findings on the correlation between stock market prices and online sentiment reported in the literature (Da et al., 2011; Kumar & Lee, 2006; Liu, Lee, et al., 2022; Tetlock, 2007).
Comparison of intra-week movements in investor sentiment before and during COVID-19.
| OP | CP | HP | LP | PCP | Mean | |
|---|---|---|---|---|---|---|
| Before COVID-19 | 2926.8 | 2929.1 | 2945.8 | 2909.3 | 2927.0 | 2927.6 |
| During COVID-19 | 3179.8 | 3183.8 | 3203.0 | 3157.8 | 3181.6 | 3181.2 |
| Difference | 253.0 | 254.7 | 257.2 | 248.6 | 254.6 | 253.6 |
Note: OP: opening price; CP: closing price; HP: daily high price; LP: daily low price; PCP: previous closing price.
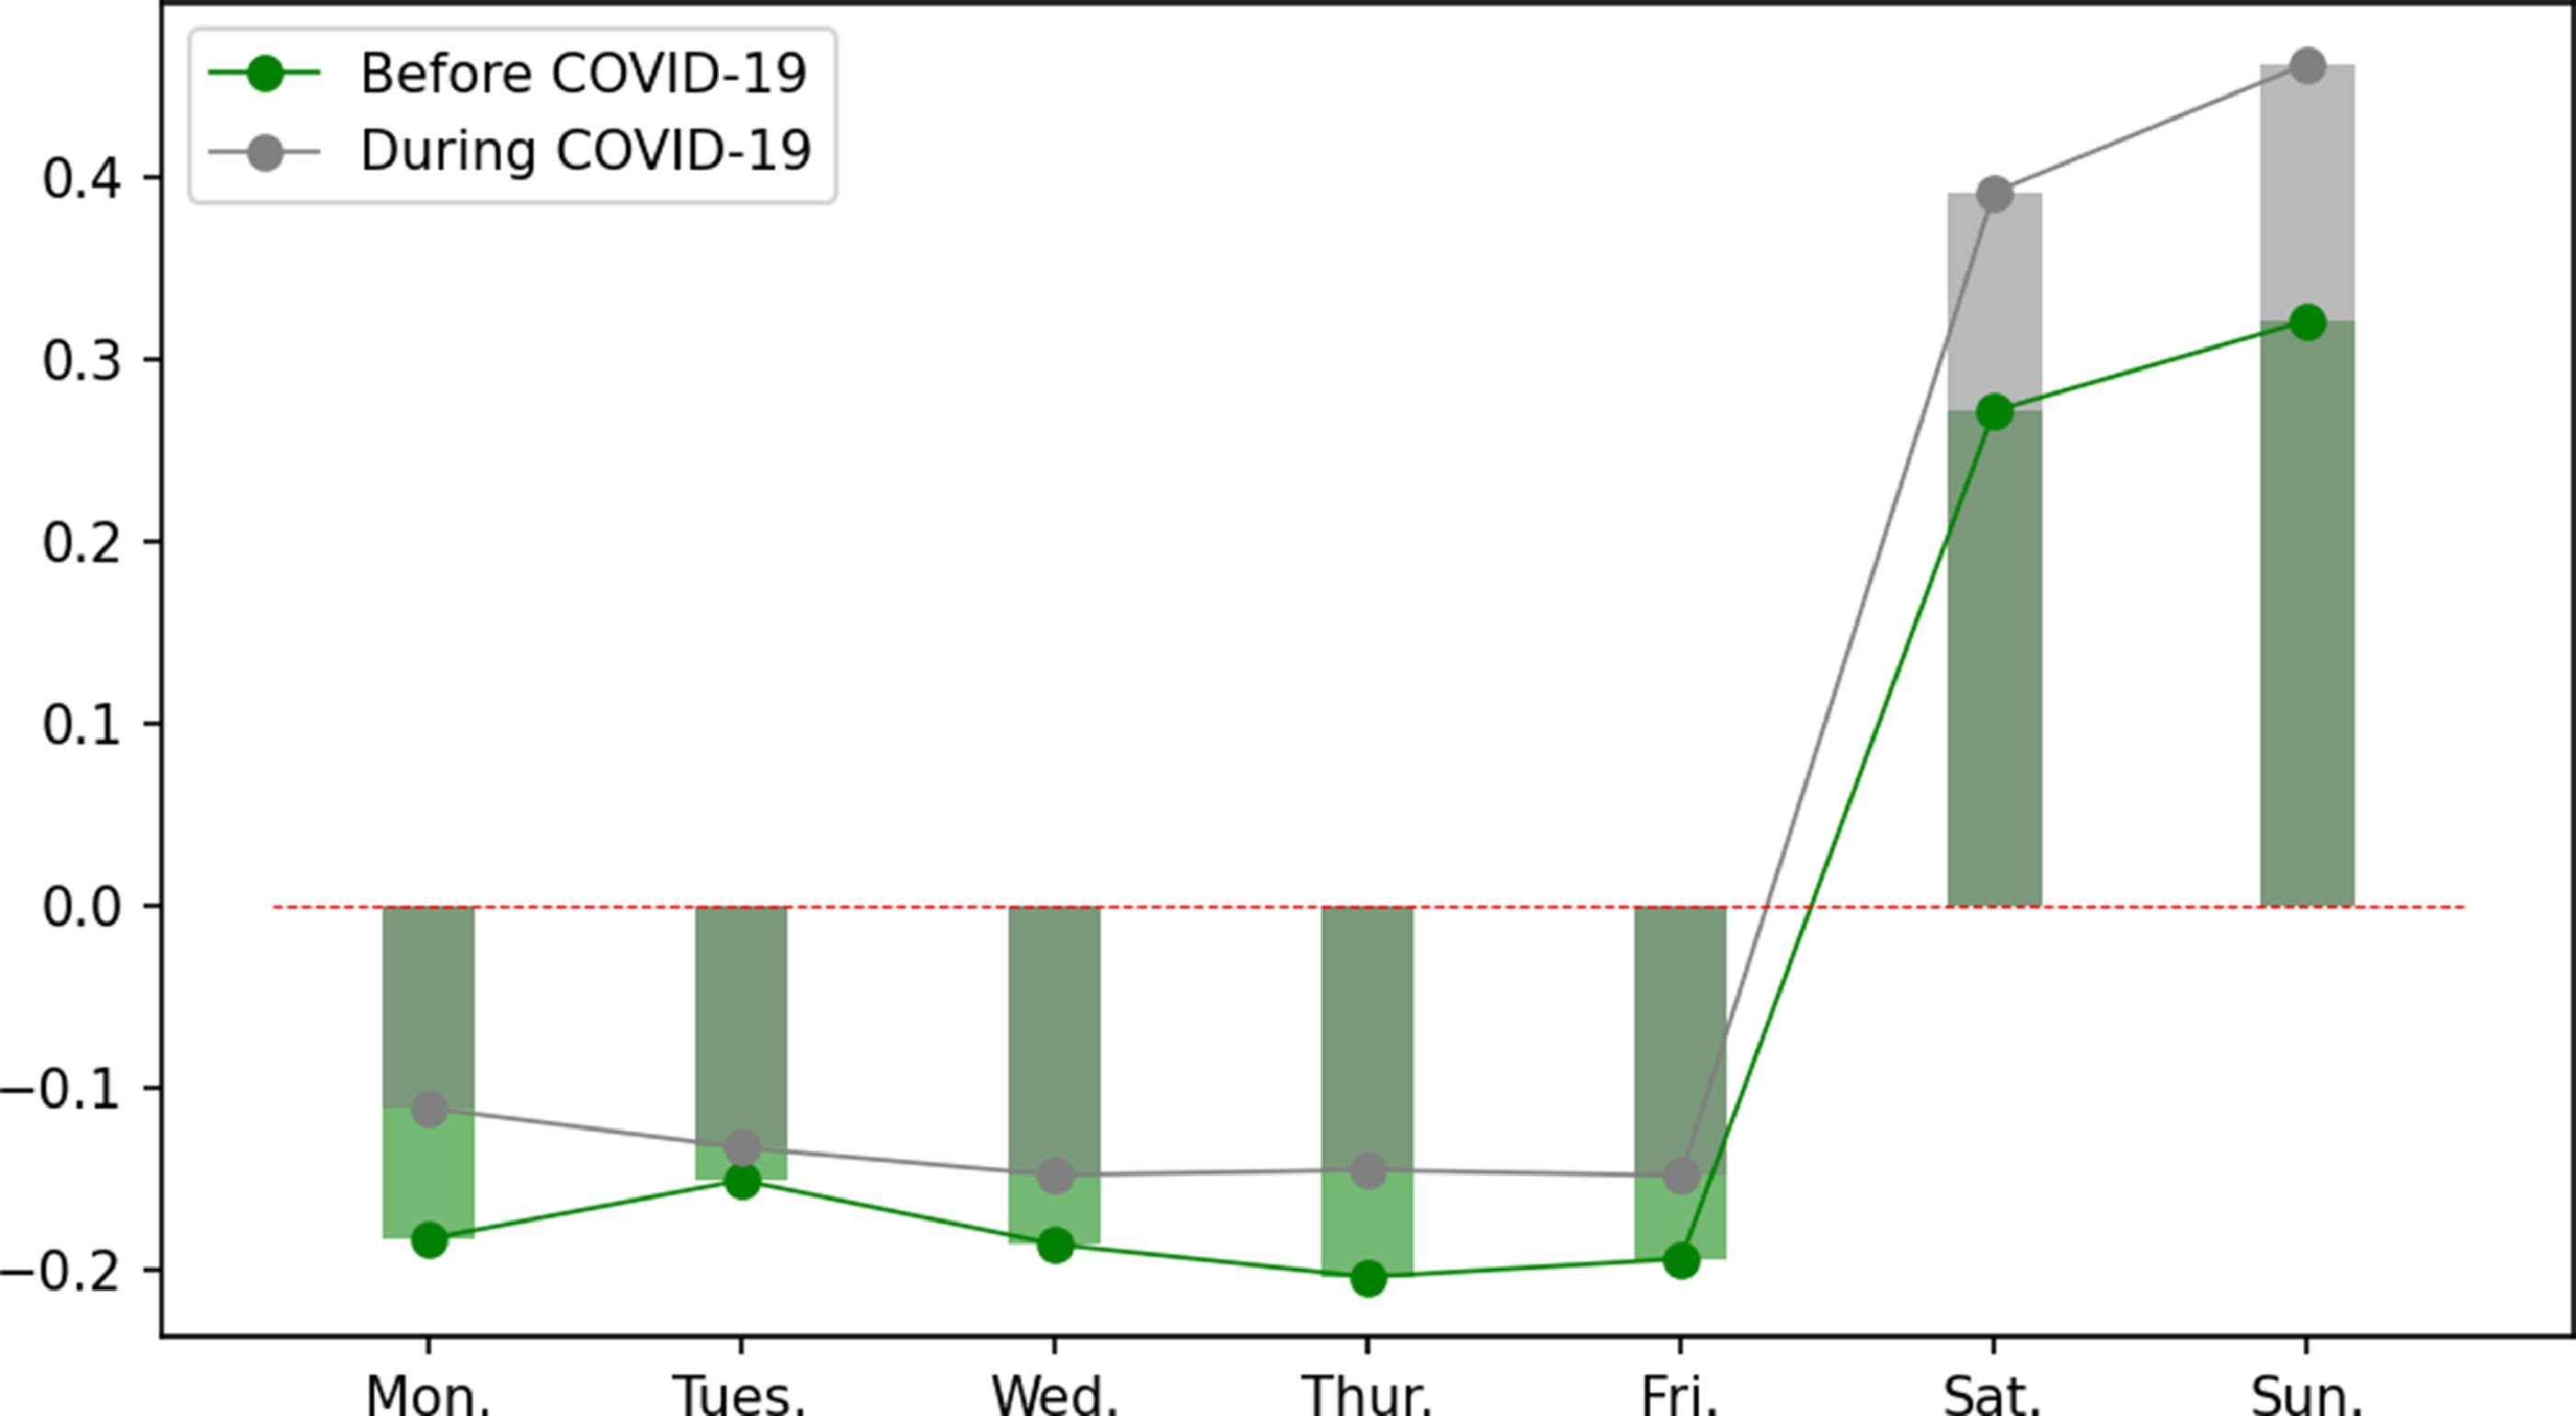
As shown in Table 17, the mean value of investor sentiment during COVID-19 is higher than that before COVID-19, with a difference of 0.071. To exclude the interference of stock market fundamentals, we subtract 0.071 from the investor sentiment indicator during COVID-19 and plot a new comparison of the intra-week movements of investor sentiment before and during COVID-19. As shown in Fig. 17, investor sentiment is lower on trading days during COVID-19 than before its occurrence but higher during the holiday season. This suggests that the dispositional effect of holidays on investor sentiment is stronger after COVID-19. Fig. 17 shows that the Saturday holiday has a stronger therapeutic effect on investor sentiment and also reflects a more substantial increase in sentiment on Sundays compared to the period before COVID-19. We also measure the comparative movement of intra-day quintile and eight-segment sentiment before and during COVID-19, from which more detailed sentiment shifts can be seen. The relevant figures are presented in Appendices A and B.
")
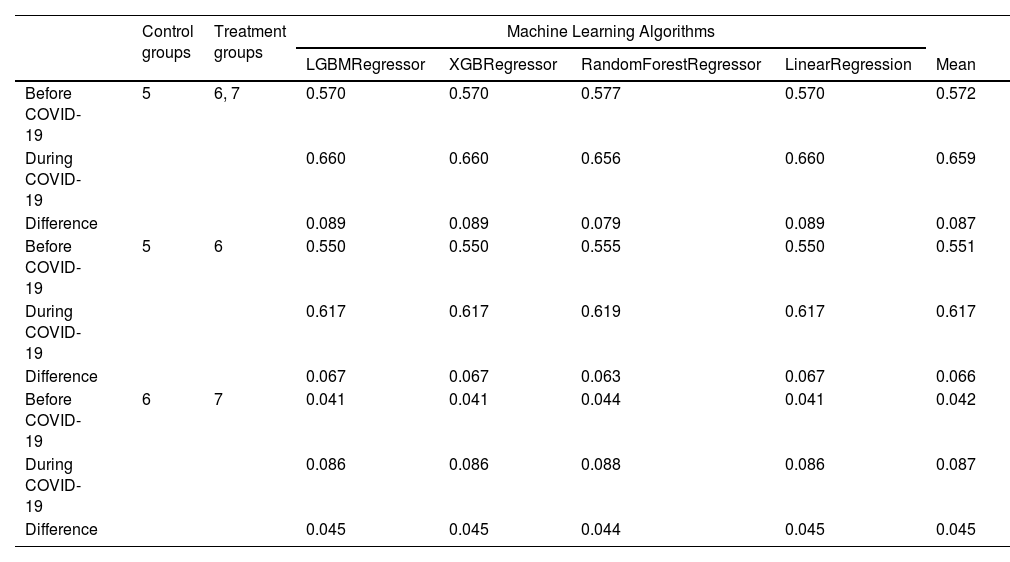
We measure the difference between the dispositional effect of holidays on investor sentiment before and during COVID-19 using causal ML. The statistical results in Table 19 show that the dispositional effect of holidays on investor sentiment is higher during COVID-19 than before COVID-19 (Difference = 0.087), and holidays result in a more substantial sentiment recovery during COVID-19. The treatment effect of Saturday during COVID-19 on investor sentiment is 0.617, which is higher than 0.551 before COVID-19. The dispositional effect of Sunday relative to Saturday before COVID-19 is 0.042, which is less than the threshold α = 0.069. The hygienic effect dominates the dispositional effect of Sundays on investor mood. However, the dispositional effect of Sunday relative to Saturday during COVID-19 is 0.087, which is between α and 2α. Therefore, although the dispositional effect of Sundays on investor mood during COVID-19 is still a mixture of therapeutic and hygienic effects, it contains a larger proportion of therapeutic effects. The above findings validate H5, which states that the occurrence of COVID-19 influences the dispositional effect of holidays on investor sentiment. Holidays during COVID-19 have resulted in higher, more sustained emotional responses, perhaps because people were more anxious and sensitive during the pandemic (Choi et al., 2020; Peteet, 2020).
Comparative analysis of holiday effects before and during COVID-19.
Note: 5 denotes Friday, 6 denotes Saturday, and 7 denotes Sunday.
We focus on the disposition effect of holidays on investor sentiment and draw other conclusions. Tetlock (2007) found that social media pessimism predicts downward pressure on market prices. Liu et al. (2022) showed that investor sentiment rises when stock prices rise and falls when stock prices fall. Kumar and Lee (2006) reported a positive association between social media sentiment and stock market returns. Our findings are consistent with these studies, showing that stock prices, returns, and investor sentiment are correlated.
Whether social media sentiment can be used for stock prices or stock market returns is a popular research topic in behavioral finance. Many studies report that investor sentiment can predict stock prices or returns (Bordino et al., 2012; Chen et al., 2014; Deng et al., 2022; Geva & Zahavi, 2014; Sprenger et al., 2014; Vu et al., 2012). However, some studies report little evidence of the predictive power of social media sentiment on the predictive power of stock prices or returns (Antweiler & Frank, 2004; Brown & Cliff, 2004; Nofer & Hinz, 2015; Oliveira al., 2013; Tumarkin & Whitelaw, 2001). Our study shows a correlation between stock prices, returns, and investor sentiment. In addition, the general increase in investor sentiment driven by rising stock market fundamentals during COVID-19 suggests a significant correlation between stock prices and social media sentiment. Our conclusion assumes that social media sentiment contains information on the stock market's direction.
Fama (1965) first pointed out the anomaly in stock returns on Mondays, initiating a study of the "day-of-the-week effect" on the stock market. The most typical feature is the anomaly of Monday and Friday returns (Gibbons & Hess, 1981). Lakonishok and Levi (1982) suggested that the day-of-the-week effect may be related to holiday weekends. Stambaugh et al. (2012) reported the role of investor sentiment in stock return anomalies. These studies link investor sentiment, holidays, the day-of-the-week effect, and stock market returns. Our study reports the disposition effect of holidays on investor sentiment, with regular stock market openings and closures leading to statistically significant and regular fluctuations in investor sentiment. Therefore, we support the hypothesis of Lakonishok and Levi (1982) that the dispositional effect of holiday weekends on investor sentiment is a potential explanation of the day-of-the-week effect.
Golder and Macy (2011) used data from millions of public Twitter messages to examine individual-level mood changes on social media. They found that people's mood when they wake up deteriorates as the day progresses. In addition, people are happier on weekends. Our study shows that investor sentiment deteriorates rapidly when the stock market opens and improves during holidays. Our findings are quite different from those reported by Golder and Macy (2011) but are consistent. People seem to become anxious when they have to deal with real problems, and this anxiety goes away when they escape reality.
Scholars typically study how to use investor sentiment to predict stock prices, stock market returns, liquidity, and other related issues based on the causal hypothesis of stock prices and investor sentiment. However, the effects of investor sentiment during holidays have rarely been studied. This is the main focus of this study. We show that holidays have positive dispositional effects on therapeutic and hygienic investor sentiment. In addition, we report the impact of COVID-19 prevalence on this dispositional effect. These novel findings have implications for stock market policymaking.
ConclusionThis study measures investor sentiment on social networks based on stock market investors' messages and NLP techniques. The dispositional effect of holidays on investor sentiment is investigated. We examine changes in investor sentiment that occur during holidays on multiple scales, including short-term intra-day holidays, medium-term holidays on weekends, and atypical long-term holidays. We find that investor sentiment significantly increases when entering any form of holiday, demonstrating the therapeutic effect of holidays on investor sentiment. However, this therapeutic effect slows down and diminishes when the length of the holiday exceeds a certain threshold. The dispositional effect of holidays on investor sentiment gradually transforms from therapeutic to hygienic. Under the hygienic effect, investor sentiment does not increase significantly but remains high. We also find that investor sentiment deteriorates rapidly when the stock market enters trading hours. This phenomenon of sentiment degradation during trading hours and the dispositional influence of holidays results in a cyclical investor sentiment pattern across a set trading cycle.
Due to the variability of each investor and vacation, the threshold at which the dispositional effect converts from a therapeutic to a hygienic effect is inconsistent for each holiday. This results in the conversion of the dispositional effect of holidays from a therapeutic to a hygienic effect, which is a continuous rather than a transient process. In addition, we employ recent developments in machine learning and causal inference to provide more evidence of the dispositional effect of holidays on investor sentiment. This study also corroborates the broad impact of COVID-19, where we show that the dispositional effect of holidays on investor sentiment is significantly elevated during COVID-19.
In this study, we examine changes in investor sentiment over holidays from a causal inference perspective. With reference to the two-factor theory, we describe such changes as the therapeutic and hygienic effects. This study provides a new perspective on investor sentiment after the stock market closes, enriching the theory of social media sentiment. It also provides insight into the impact of holidays on the day-of-the-week effect and the relevance of holidays to social media sentiment. This study reports on holidays' therapeutic and hygienic effects on investor sentiment, which has some practical implications for policymaking in financial markets.
This study reports the dispositional effect of holidays on investor sentiment based on Chinese market data. However, it still lacks extensive market validation. Moreover, social media sentiments may be influenced by social media distribution mechanisms and online culture. The dispositional effects of holidays on investor sentiment may vary across cultures. It would be interesting to expand this study by using more data to validate the dispositional effect of holidays on investor sentiment in a broader market. In addition, this study reports on the broad impact of COVID-19, and we show that the dispositional effect of holidays on investor sentiment is significantly elevated after the occurrence of COVID-19. However, the mechanism underlying this elevation remains unclear. This is possibly due to COVID-19 changing the life circumstances, economic environment, or political environment of investors or COVID-19 affecting the lying game on social media, which is again an interesting question.
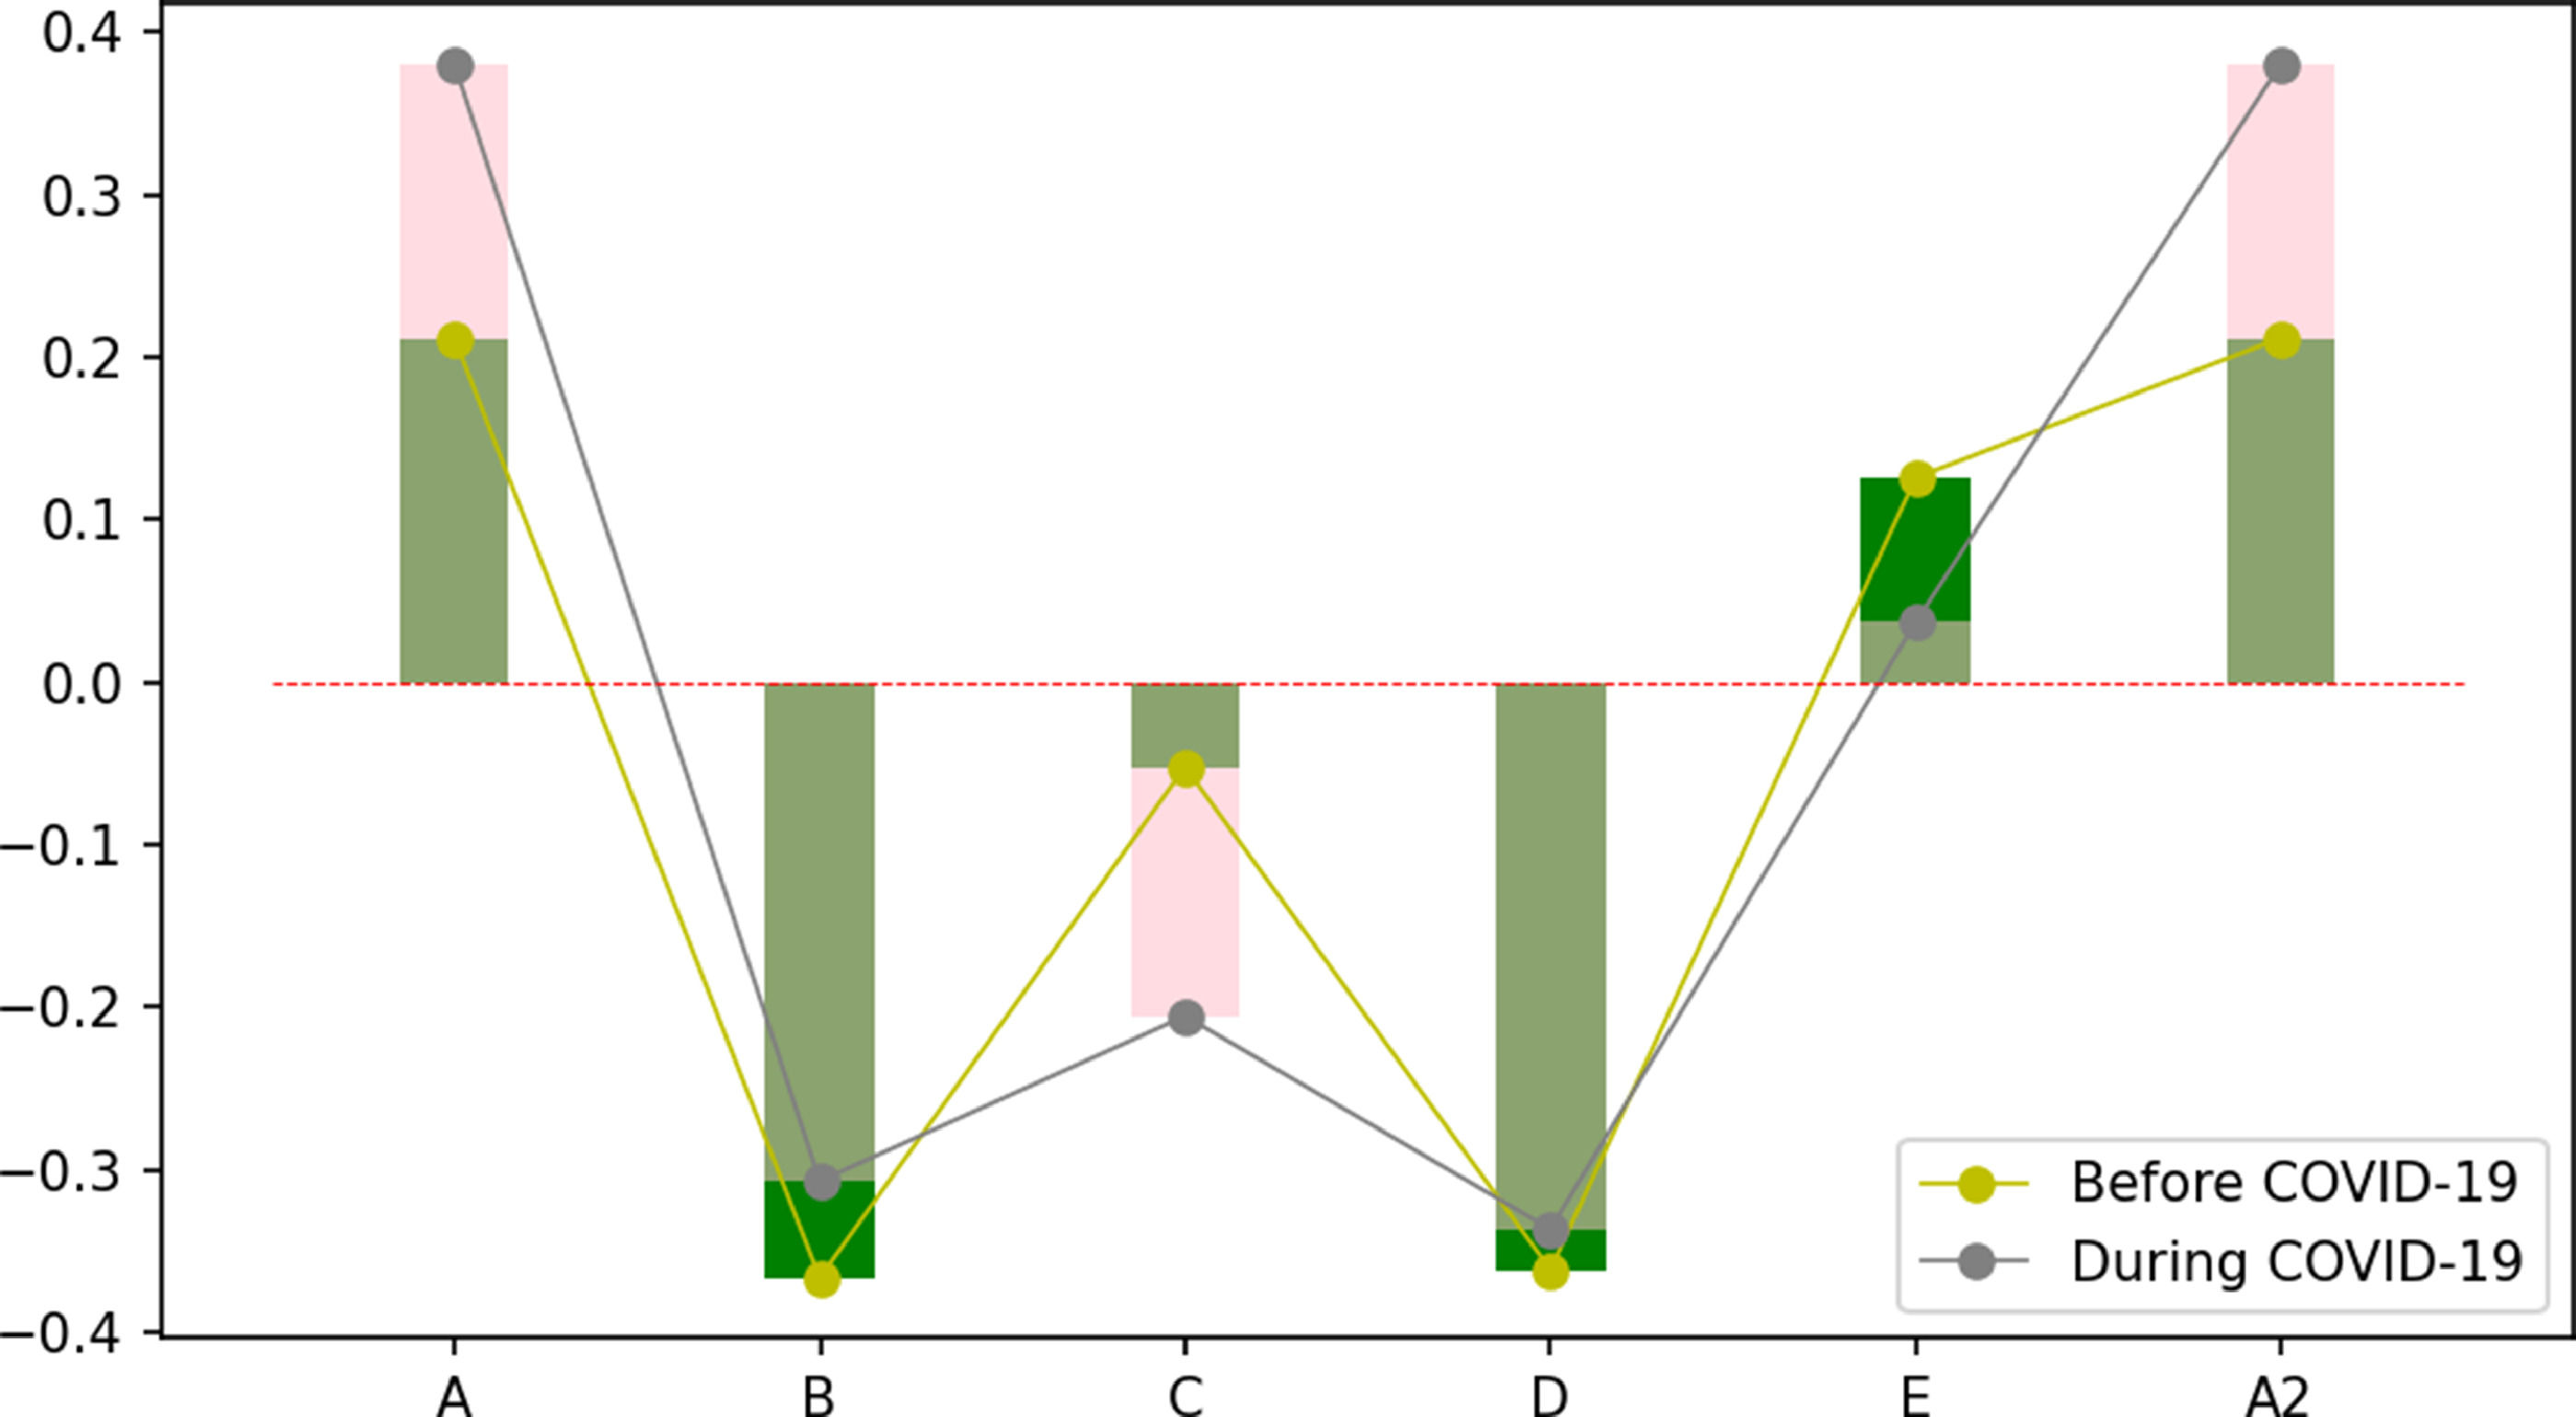
Appendix AThe chart below compares the changes in investor sentiment on the trading day before and during COVID-19. In the figure, B and D represent morning and afternoon trading sessions, respectively. The three periods represented by A, C, and E are before the market opens, during the midday stock market closes, and after the afternoon stock market closes. A2 represents segment A the following day.
Appendix B
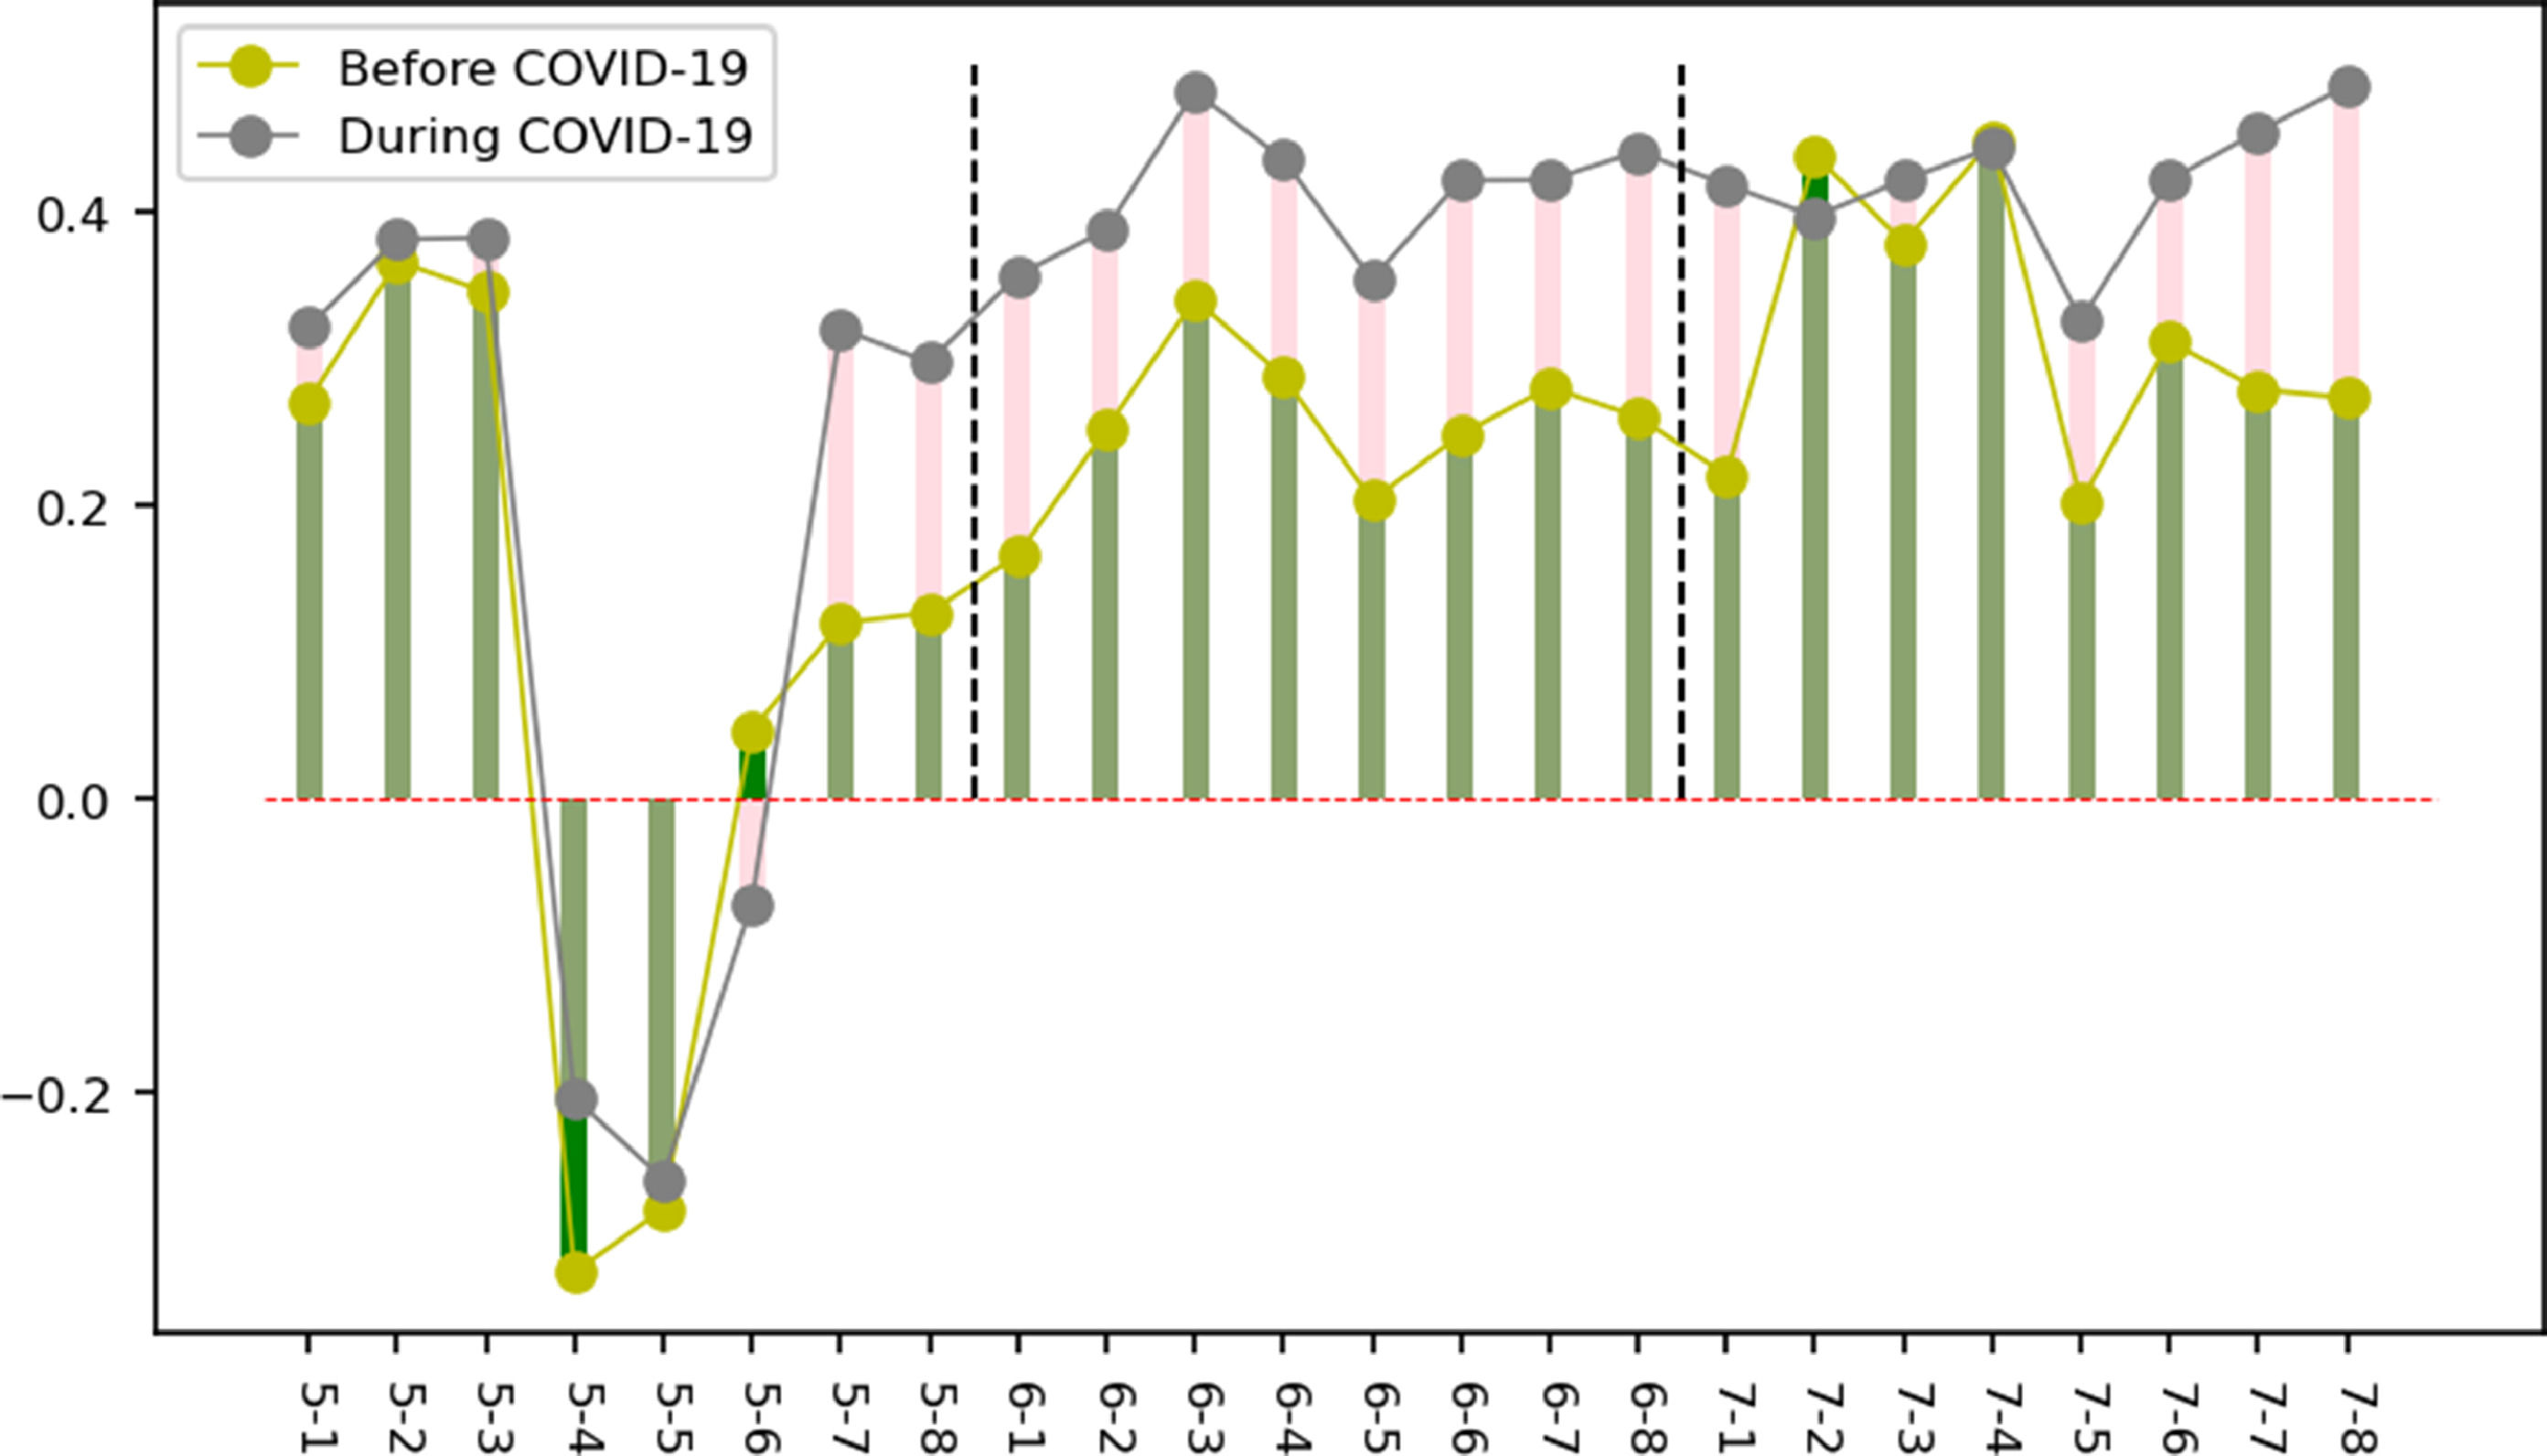
The chart below compares the changes in investor sentiment on Fridays, Saturdays, and Sundays before and during COVID-19. Each day is divided into eight periods of three hours each. 5 denotes Friday, 6 denotes Saturday, and 7 denotes Sunday. 5-1 represents the first period on Friday, while 7-8 represents the last period on Sunday.
Conflict-of-interest disclosure statement
Author Qing Liu
I have nothing to disclose.
Author Minghao Huang
I have nothing to disclose.
Author Lilu Zhao
I have nothing to disclose.
Author Woon-Seek Lee
I have nothing to disclose.
JEL Codes: G40, G40.