


The advent of green energies contributes to their high penetration in the energy sector. It could be guessed from the beginning that societies would so excited about the advantages of these energy sources to deploy in the infrastructure of energy systems even before deep investigation about their possible disadvantages. Unfortunately, the management of these sources has become challenging due to the uncertainty associated with environmental factors which can make social, economic, and technical issues. On the other hand, new emerging technologies such as electric vehicles (EVs) have helped much to reduce air pollution and thus make positive effects on human life. Still, we all accept that new technology can make the problem structure much more complicated. This article proposes an innovative management approach for risk-based optimal bidding strategies of energy aggregators in the energy market considering green sources. Moreover, it proposes a new strategy for the bidding offer strategy for green energy aggregators in the spot electricity market. An innovative bi-level optimization approach is developed for the maximization of the profit of the non-participatory companies considering all the technical and social limitations. The equilibrium market spots in this method are calculated as per the Nash equilibrium rule. In such a system, all producers and consumers are considered market players to propose the EV's behavior and as a result, provide a more competitive environment. The results clearly show the high performance of the proposed model for energy management in a green social and economic framework.
In recent years, electric companies are fundamentally focusing to improve the production industry in consecutive years considering the new emerging technologies such as EV aggregators or new active players in the market. To this end, they have tried for several decades to minimize power generation costs when supplying electric customers, reliably and efficiently. Conceptually it is simple to provide the situation for expanding to the free market with producers preferring bidding offers. In this way, the market starts to let the EV aggregators as consumers participate actively through consumer bidding offers and/or strategies of demand side management (DSM) (Coelho, Iria & Soares, 2021), by introducing demand response in the restricted system. In this way, an economic concept is introduced to the public which is measured as social welfare ((Abou-Zeid and Cheng, 2004); Oghazi, Karlsson, Hellström, Mostaghel & Sattari, 2021). By definition, the combination of the commodity prices, here electricity and the benefit of the commodity in the society, are assumed as the expected payment which is called social welfare (Zheng, Yu, Shao & Jian, 2020).
In the case that electricity demand is supposed to be independent, the electricity demand versus the price shows a non-elastic behavior. So simply, gathering money that is paid for electricity would be a public benefit. In an ideal market, the public benefit would be maximized, although, lower than the realities of the public benefit level (Hyun, Kim & Eom, 2020; (Saunila, 2020)). A criterion for measuring the efficiency of a real market is the dispute between the public benefit of an ideal market and a real market. Any producer in an ideal market has the adequate power to adjust the market price according to its size and power portion in the market. Technically, the optimal bidding offer for a producer in the economic theory is simply considered the marginal bidding offer (Janke et al., 2020; Poplavskaya, Lago & De Vries, 2020; Sharifi, Anvari-Moghaddam, Fathi & Vahidinasab, 2020). Therefore, a strategic bidding offer may be considered as the behavior when a generator due to the non-ideal market proposes a higher price than a marginal bidding offer for increasing its benefit. Such a tool may be called market power when the generator can increase its benefit successfully or decrease its cost with any approach. This means that a generator can increase its benefit by the use of the market power, or the strategic bidding offer, thus new electric markets are not completely competitive.
There are three strategies for optimal bidding offer in the market. The first one is the estimation of the market clearing price (MCP) in the next period ((Alshanty and Emeagwali, 2019); (Wozabal and Rameseder, 2020)). The next strategy is based on the behavior of competing companies bidding offers (Farrokhseresht, Slootweg & Gibescu, 2021; Khaloie et al., 2020; (Kiran and Chandrakala, 2020)). The third one is based on the game theory (Namalomba, Feihu & Shi, 2022). Of course, there are some other methods but are not systematic ones for bidding offers such as market simulation and experimental analysis for strategic cost. According to MCP estimation, it is easy for a powerful producer that suggests its bidding offer simply, in a way that would be a little lower than the MCP. It means that there is a need to forecast electric prices in the electricity market which is the combination of forecast demand with understanding the bidding offer of other companies and transmission system density. Unfortunately, it is difficult to reach fast predictions because of the limited information that exists in most of the markets and because of the fast changes that happen in the EV and electric industry. The implicit assumption is another problem in this way, which means the bidding offer really does not represent a generator MCP. This hypothesis seems unlikely acceptable because the electric market is basically exclusive.
In the optimal bidding offer, this strategy is rarely used. The market is completely competitive if the number of producers and consumers would be high, and thus the exit of one producer or one consumer can not affect the cost severely. In this market, producers and consumers will be deleted if they don't accept marginal bidding offers (Correia, 2002). Therefore, the producer tries to increase the bidding offer and consumers would try to decrease the bidding offer in realistic markets. There are different models introduced in the literature for modeling such behavior. Authors (Janke et al., 2020) propose the slope or width of origin of marginal price multiplied by a coefficient K to show this behavior. Also, in Sharifi et al. (2020) cost curve is multiplied by a coefficient k. This paper expands on the idea of (Tiberius, Schwarzer & Roig-Dobón, 2021) and considers the behavior of consumers. Spot prices and costs for consumers will be decreased in this market, because of the competitive situation that is created. Regarding the producer's coefficient K that is multiplied by the cost function, it should be more than one, and the difference of this cost function is the amount of benefit, which needs to be maximized. The expected profit function for consumers is modeled using a quadratic function. With the involvement of coefficient k that is less than 1, the consumers are allowed to play which means the change of bidding offer of expected cost, and difference of this amount of expected amount of profit consumers amount that would be maximized. Moreover, game theory is used as a powerful tool for solving problems. The high performance and quality of the model are assessed on a test system. The main contributions of the paper are as below:
- •
Proposing an innovative stochastic-based management model for the energy market considering green energy sources
- •
Deploying game theory in a bi-level structure for making a social and economic framework in the market
- •
Introducing a modified BA for solving the problem in a nonlinear model.
The rest of the paper is as follows: section 2 explains the modeling behavior of the market companies based on bidding offers. Section 3 describes the proposed two-level optimization method. Section 4 explains the proposed MBA with the two modifications. The simulation results are depicted and discussed in section 5. Finally, the main outputs and results are given in section 6.
Modeling behavior of market companies bidding offersIn electric markets, producers and consumers try to compete with each other to increase their profit, so the competition of these companies is kind of a game to increase their profit. Therefore, it is tried to get the maximum profit with the use of Nash equilibrium. Every company tries to increase its profits by the hypothesis of fixed behavior (here strategy is bidding offer) of companies. In the case that a fixed bidding offer is achieved for the companies after several repeating of solving the problem, this bidding offers to create dimensions of Nash equilibrium. The main issue in restricted electric markets is the participation behavior of the demand side by consumers bidding offers. To this end, it is tried to improve the formulation of optimal power flow (OPF) and consider the behavior of consumers bidding offers in parallel p the producers. With the use of DC optimal power flow (DCOPF), calculations will be decreased when just active power is considered. The total form of cost of production is calculated as c(sG)=bsG+csG2. Here, b and c are coefficients and sG is the generator production capacity and c(sG)is the cost of production in terms of currency. By considering p=dc(sG)/dsG as the spot cost and deriving from the above formula, and getting power in terms of price, we will have s(p)=12c(p−b)=ms(p−pmin). Here p is spot price and s is power production. In this equation optimal marginal bidding offer is named for a producer. Now we can define expected profit like before:
Here dlis the consumers’ power and c has a negative amount and Bdlis the price of purchase according to the currency. By derivate of the above formula and considering p=dB(dl)/cdl2 as spot price and find demand power according to cost will have d(p)=12c(p−b)=−md(p−pmax) which will result in the demand power as p(d)=−1mdd+pmaX. Here d is the purchasing power or demand power and p is the spot cost for a consumer. Power will be determined when production or supply and high demand for price and quantity in the curve collide with each other. We will have p(s)=ks(1mss+pmin) and p(d)=kd(−1mdd+pmax)when multiply producers bidding offer curves and consumers to ksand kd. In the electricity market, the behavior of producer and consumer optimal bidding offers will be explained by the above formula. The parameters ksand kd should be calculated carefully to maximize producer profit and consumer profit. According to the game theory in the real market with several companies, the market equilibrium spot calculates as Nash equilibrium.Two-level optimization algorithm
In this section, we propose a bidding offer of market companies according to the bat algorithm (BA) which is a two-level optimization solution. In the first level, the bidding offer of ks and kd is calculated in a way that makes profit maximization, which means it is calculated at the level of companies (in the level of generators and consumers). For the calculation of the above parameters, we use the repetitive approach of Guss-Seidel. In every step, all coefficients are assumed constant except the coefficients ksi and kdj that change by the use of the bat algorithm (BA) of the initial value. The final step of this process would determine the level of the Nash equilibrium spot.
In the second step of optimization, an independent operator system (IOS), with the use of DCOPF and BA would try to maximize the total profit of market companies. Now we expand the problem for a system with N buses, n generators and m consumers. The final form of p(si)and p(dj) will turn out to ksi(aisi+bi) and kdj(cjdj+ej), respectively. In the absence of line congestion, spot cost is the same all around the system. Now we would calculate the power production or consumption such as dm(that is all power production and power consumption) as follows:
Ignoring the system losses would result in the balance equation of s1+s2+...+sn=d1+d2+...+dm. For a set of bidding offer coefficientsksiandkdj, we will calculate dm, si(i=1,...,n) and dj(j=1,...,m−1) as described before.

As it can be inferred from the above, the bidding offer ofksi and kdj (coefficient producers of bidding offer) is calculated with a two-level optimization method based on BA. In the first step, the below parameters are calculated in a way that the profit of every company would be maximized. Then, the problem is formulated like this:
whereBsiis ith generator profit function, and Bdj is jth of the consumer profit function. In order to maximize the welfare of both market players, game theory is launched to solve the above problem. Considering the game theory concept, a strategy is finally utilized which would reduce the costs and maximize benefits for both parties.
It is then time to solve the above optimization problem with the BA repetitive multi-step solution. In any step, the bidding offer coefficient (kd)ks are repeatedly updated. The converging solutions for k coefficient are dimensions of the Nash equilibrium spot. In this step would game theory help to reach optimal decision-making based, called knowledge-based management.
In the second step of the optimization, the DCOPF problem is solved with the below optimization. At this level, considering transmission network constraints, ISO tries to maximize all the system profit.
Modified bat algorithm (MBA)This section describes the bat algorithm and a new modification to enhance the search capability of the method:
Original BAAs it could be seen from the above explanations, the proposed model is a nonlinear and non-convex optimization problem. In order to solve this problem without any assumptions, it is necessary to use an evolutionary algorithm. The main features of the evolutionary algorithm are the lack of necessary to make assumptions and the ability to solve discreet and nonlinear problems. This paper makes use of the BA. Technically, BA is an evolutionary algorithm that works based on the simple rules existing among the bats for catching their prays. This algorithm works based on four key rules: 1) each bat Xi has a specific velocity of Vi which emits a signal to the air, 2) the signal has a loudness Ai which decreases as time passes, 3) the bats can distinguish between the food and prey and 4) the signal frequency fi and rate ri may change in an automatic way. BA has special features which make it a very popular and powerful optimizer such as useful local searching tools, and a powerful ability in solving mixed integer linear or nonlinear problems. Similar to the other evolutionary methods, the initial bat population is generated randomly in the feasible domain. Another improvement is made in a random environment by generating a random value β. If this is larger than ri, the new solution would be generated locally with a random parameter ε as Xinew=Xiold+εAmeanold;i=1,…,NBat. By definition, Ameanoldis the average of bats’ signal loudness. In the case that β is lower than ri, a new solution Xinewis produced in a random way. The new one is accepted only if the following two conditions of either β
In order to add up to the algorithm diversity, you need to support its local and global search mechanisms such that it will not trap in either local or global points. This paper proposes two modifications to get to this goal as below:
Modification # 1This modification makes use of the key search operators of the genetic algorithm such as mutation and crossover to enhance the bat population position. Therefore, the first three dissimilar solutions m1≠ m2≠ m3 are chosen to get mutated as below:
Then, new test solutions would be generated using the crossover operators.Modification # 2
The second modification tries to replace the static parameter α with a dynamic formulation αnew=(1/2Iter)1/Iterαold. Such an equation is found by several running of the algorithm experimentally.
Simulation resultsIn this part, the proposed technical and economic model is assessed on a test system to see the performance of the model on the social and economic aspects. The case study of the 9-bus IEEE test system is used to evaluate the performance of the proposed method of case studies. All the system data and components can be found in Correia (2002). Both congested and congestion-free lines are studied in this work. There are 9 generators and 9 consumers assumed in the test system wherein consumer number 5 has a load equal to a typical EV aggregator.
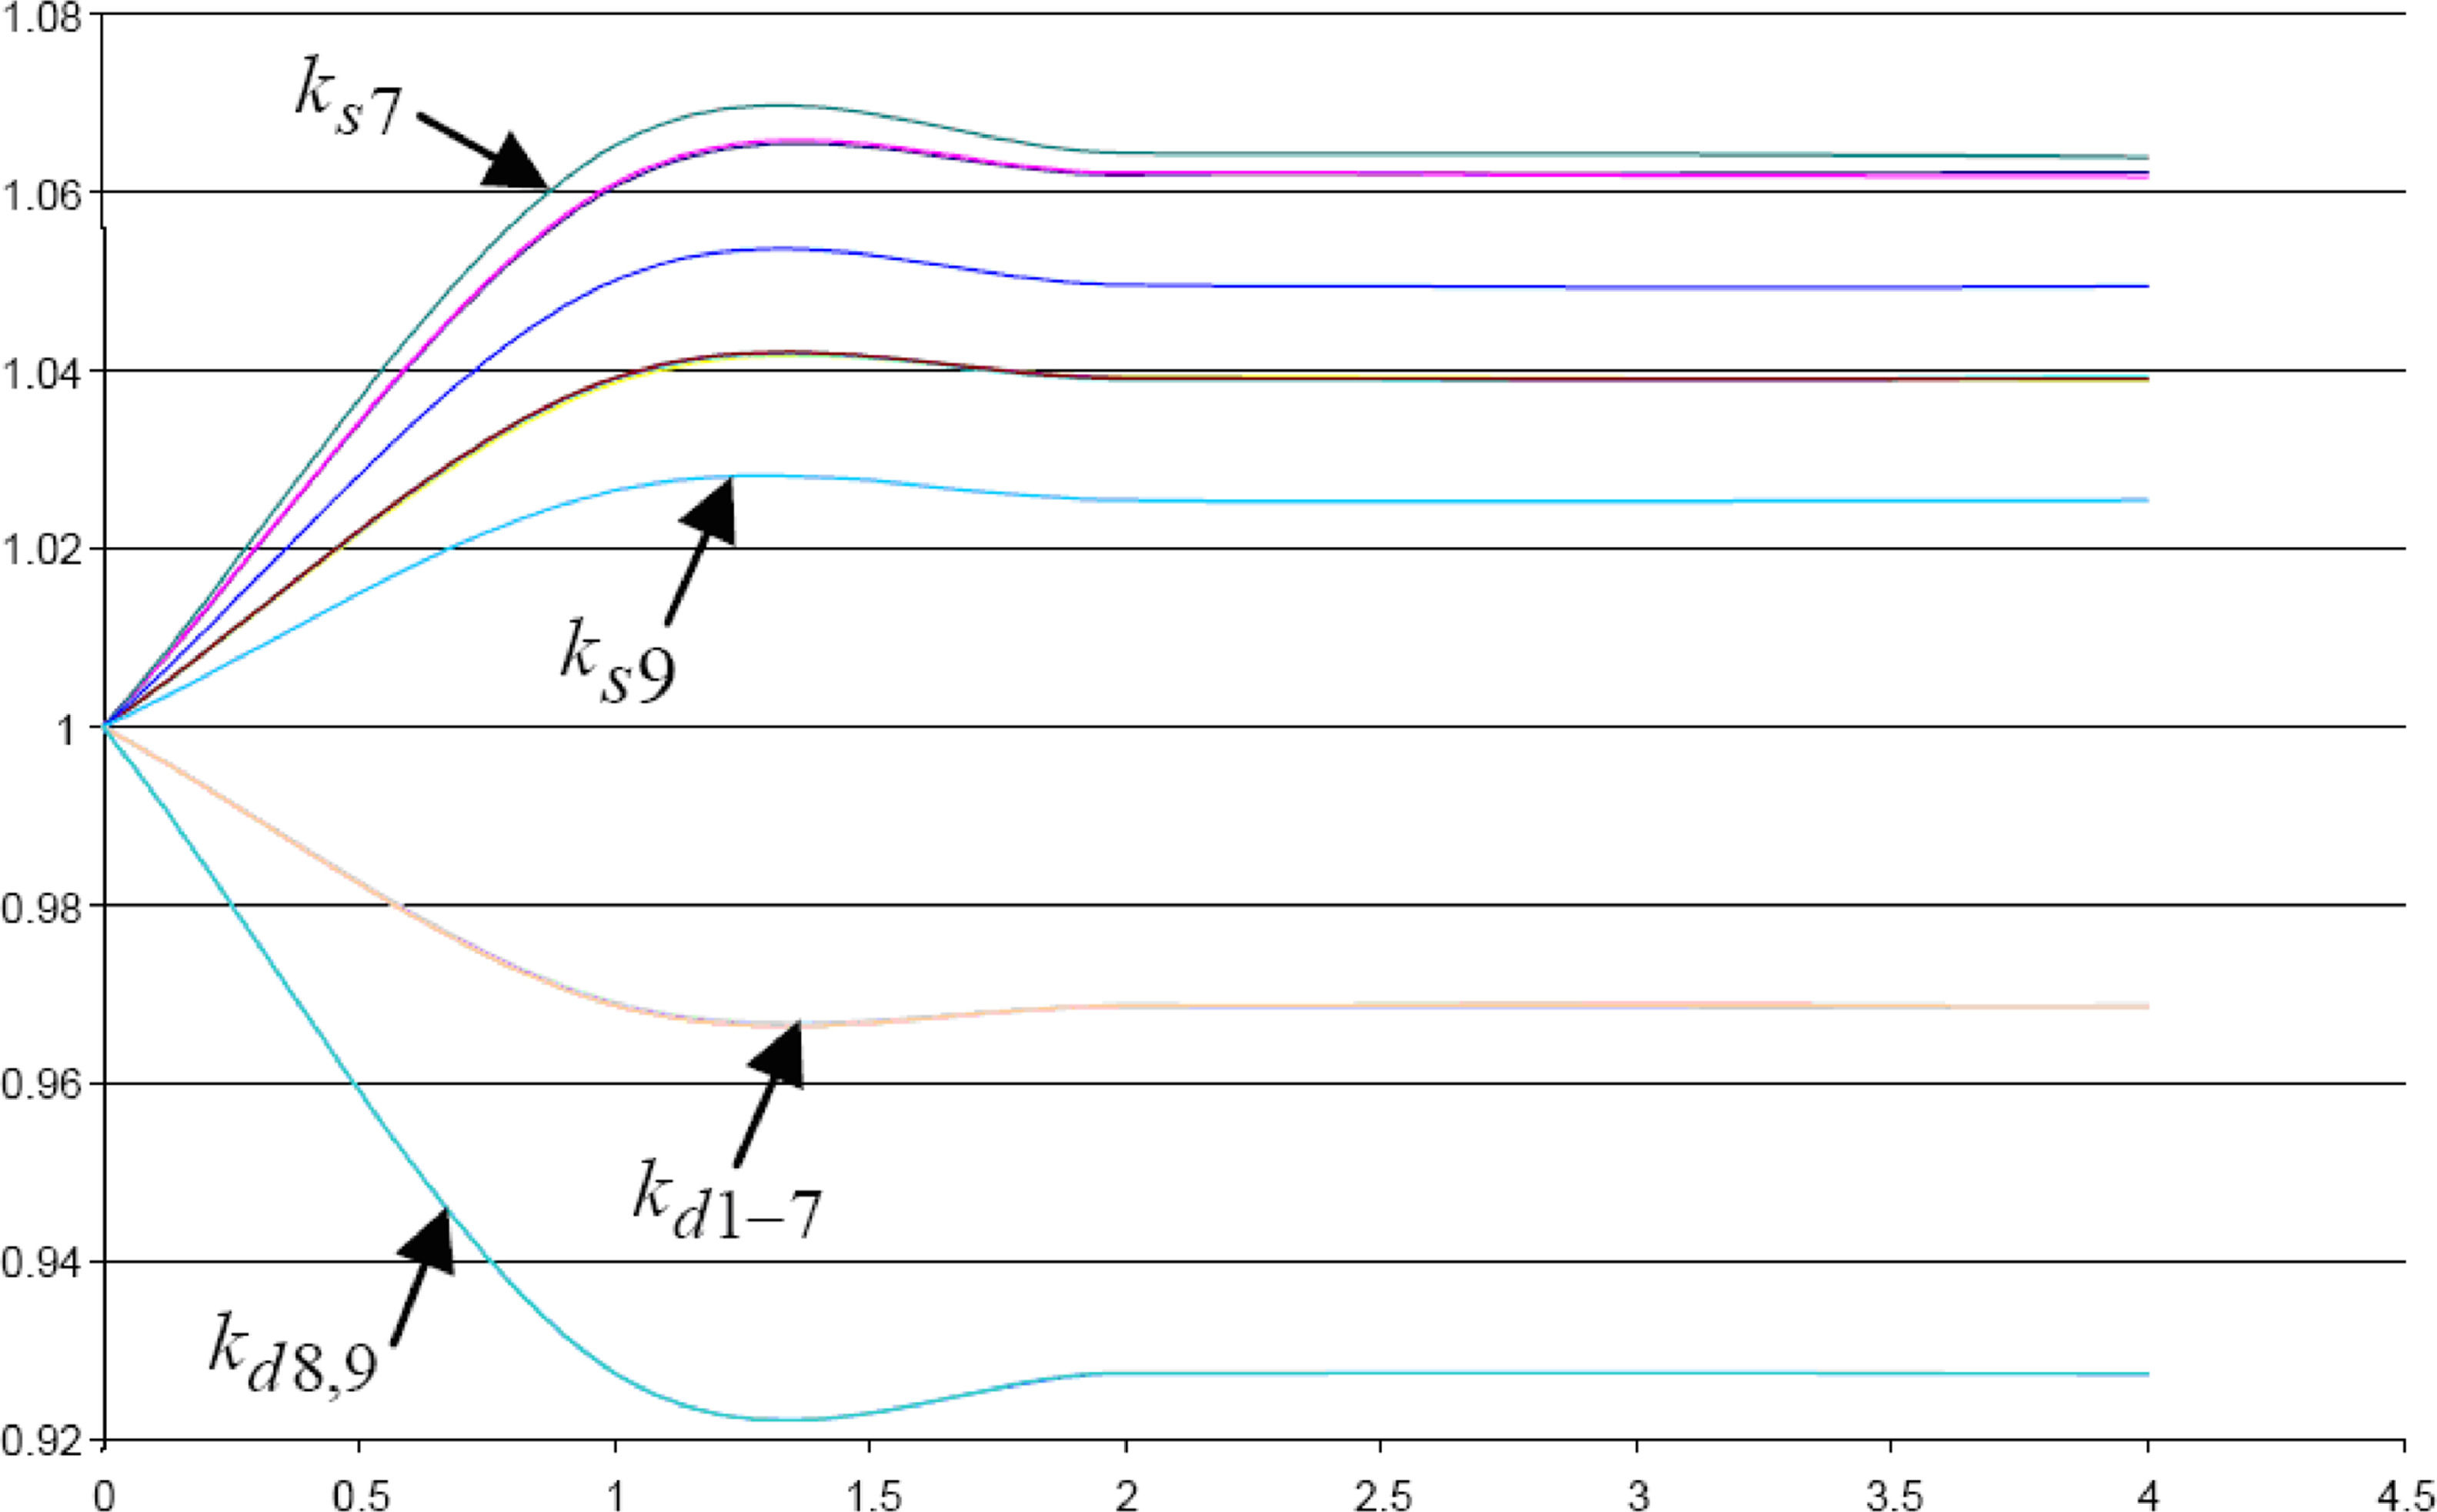
Fig. 1 shows the specifications of convergence of coefficient k as the output of the first level optimization. As it can be seen from the figure, ks7 has the maximum amount and ks9 has the minimum amount, which is because these two generators have maximum and minimum coefficient values in the generation cost curves. Also, because of high and low load coefficients, kd1−7 has the maximum amount and kd8,9has the minimum value.

In Table 1, the power generation and consumption of market companies along with the spot cost are shown. According to Fig. 2, it was predictable that generator number 7 would commit the biggest generation to reduce the total cost and thus give the most economic profit. Spot pricing is the same all around the system because there is no congestion in the network. Table 2 shows the system power flow in the feeders.
powers and calculated spot price in the second level of optimization .

Let us suppose that congestion exists in the lines connecting buses 7 and 8 with a power flow capacity of 150 MW. The numerical results are given in Table 3 and Table 4 for the second level of optimization. As it was expected for different buses, the spot cost has changed in most of the cases, especially for buses 7 and 8.
Computed powers and spot prices in the second level of optimization.
In order to assess the effect of considering the coefficient offer of consumption bidding on the problem modeling, the proposed method is compared with the method in Tiberius et al. (2021).
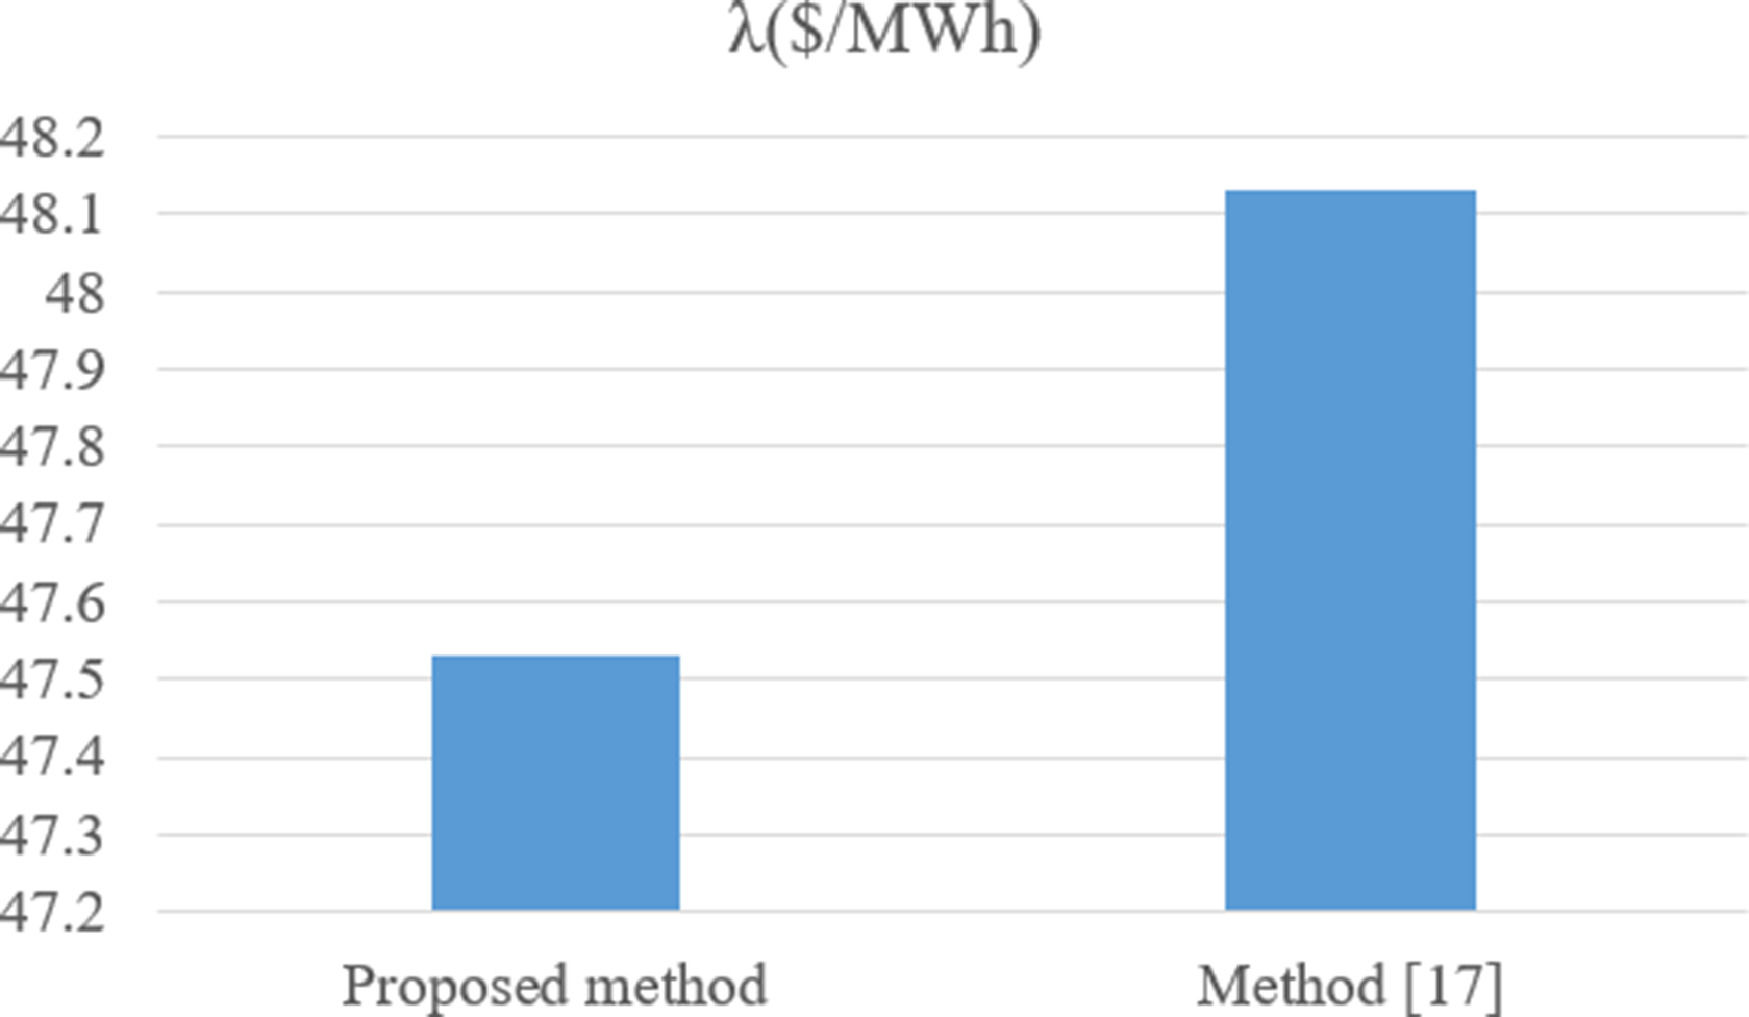
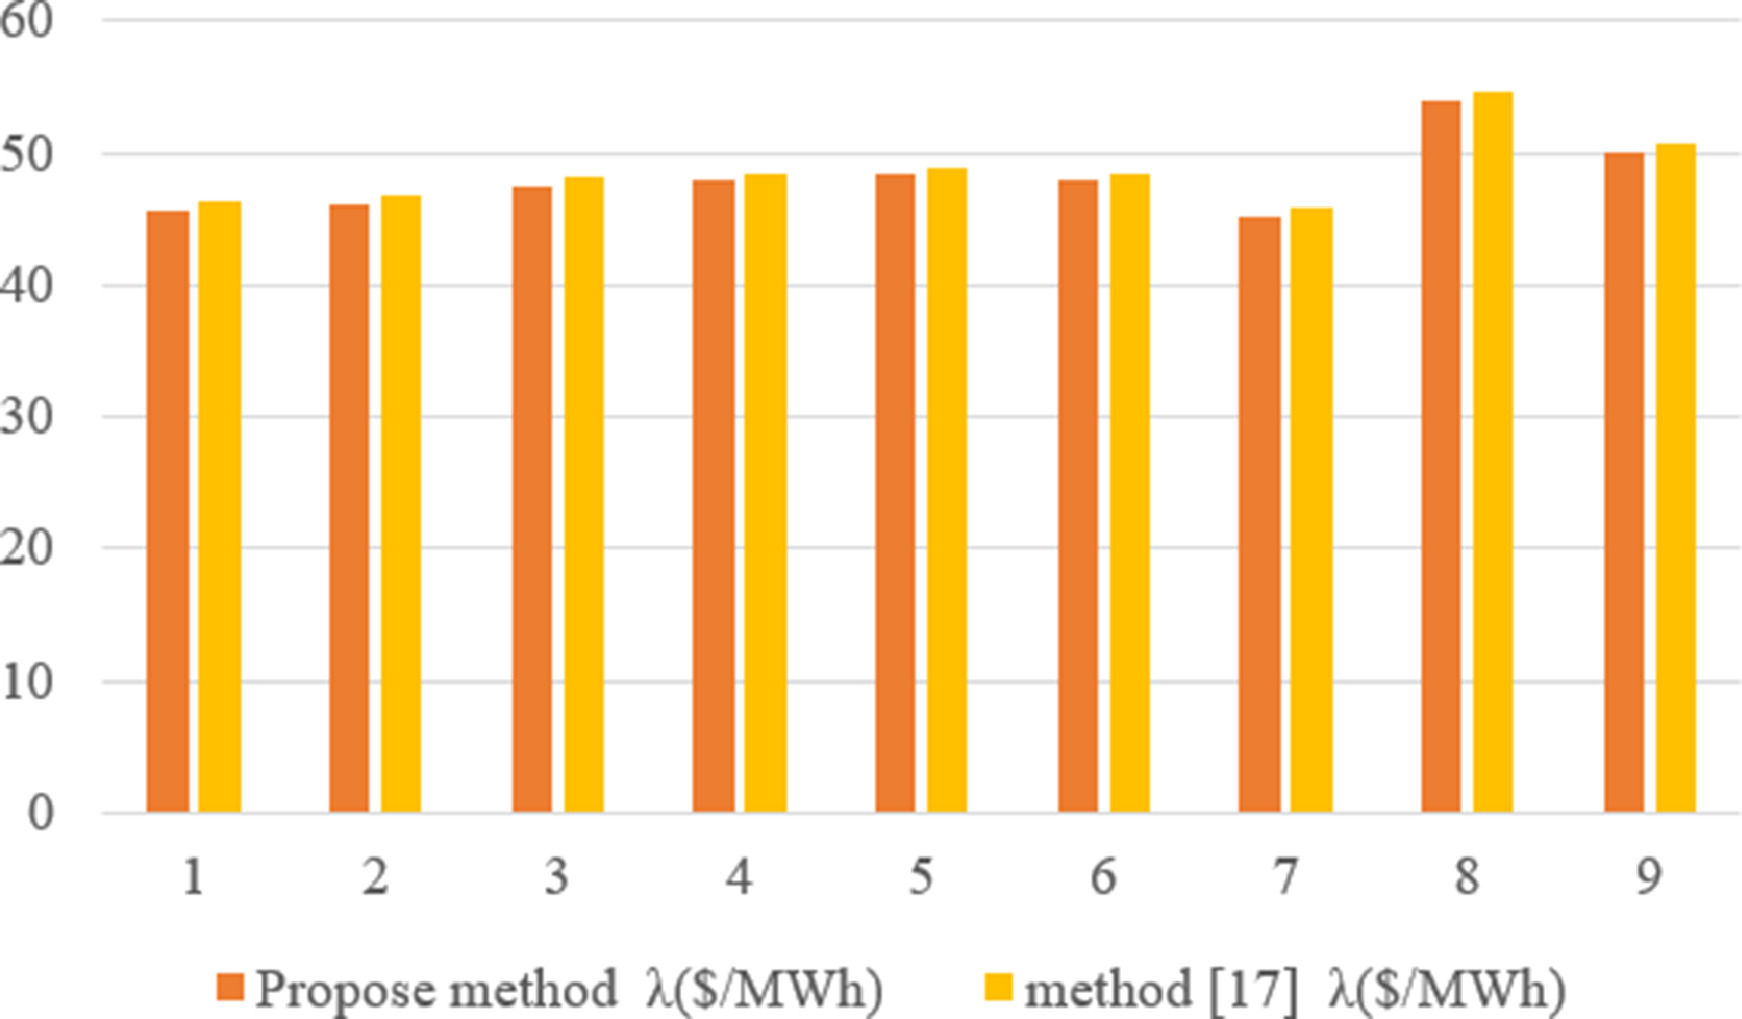
Table 5 shows the simulation results for both methods. As you can see from the result, producers bidding offer ksis less than the same coefficients (Tiberius et al., 2021) when considering consumption bidding offer. Fig. 2 and Fig. 3 show the spot costs for the congestion-free and congested situations, respectively. It is clear that spot costs in the proposed method are less than spot costs for the methods (Tiberius et al., 2021) which is the natural result of having a more competitive electricity market environment because of participating consumption side in the game.

This article proposed a hybrid economic and technical model for optimal bidding offer in the restructured energy market considering the green energy sources and electric vehicle charging demand. Technically, it was seen that letting the demand side attend the game would result in a more competitive environment. The use of the MBA would let the operator make sure that social welfare would be preserved through the absolute optimal solutions. Moreover, the Nash equilibrium is used to achieve the maximum profit for the market companies and thus maximize the social benefits expected from a competitive market. The advantage of the proposed method for maximizing profit is confirmed using the standard IEEE case study. Moreover, the computational effort is much less compared to the other methods mentioned in the literature such as (Tiberius et al., 2021).
This research work is partly supported by the National Natural Science Foundation of China under Grant No. 71988101 and the Fundamental Research Funds for the Central Universities under Grant No. xpt012020022 and No. SK2021007.