


Nanoparticles of CaO2 were synthesized by chemical precipitation method and characterized by X-ray powder diffraction (XRD), scanning electron microscope (HR-FESEM), energy-dispersive X-ray spectroscopy (EDX), transmittance electron microscopy (TEM) and high-resolution TEM (HRTEM). HR-FESEM, TEM, and HRTEM images confirmed the average size of nanoparticles as 10–40nm. Furthermore, application of synthesized CaO2 nanoparticles for the removal of benzeneacetic acid was studied by the Taguchi method. The operating parameters are CaO2 nanoparticles dosage (0.008–0.03g), initial concentration of benzeneacetic acid (6.8–13.47g/L), and contact time (5–60min). The result indicates that the CaO2 nanoparticles adsorbent dosage was the most effective factors as compared to initial concentration of benzeneacetic acid and contact time. The optimum parameters were CaO2 nanoparticles adsorbent dosage=0.03g, initial concentration of benzeneacetic acid=6.8g/L, contact time=30min, and the removal efficiency of benzeneacetic acid=94.49%. ANOVA showed the most significant factors were adsorbent dosage with 93.78% contribution. Regression analysis (R2=0.91) showed a good agreement between the experimental and the predicted values.
Carboxylic acids such as benzeneacetic acid (phenylacetic acid, α-toluic acid, alpha tolylic acid, 2-phenylacetic acid, β-phenylacetic acid) are a found in the active auxin (Wightman & Lighty, 1982). Benzeneacetic acid is a by-product of the enzymatic hydrolysis of penicillin G by penicillin acylase (PA) (Ramchandran, Krishnamurthy, & Subbaraman, 1996). Benzeneacetic acid is also used to treat type II hyperammonemia to help diminish the amount of ammonia in a patient's blood stream by forming phenylacetyl-CoA, which then reacts with nitrogen-rich glutamine to form phenylacetyl glutamine (Hammad et al., 2003; Xie, Pei, Pei, & Cai, 2014). Benzeneacetic acid is produced by catabolic activities of microorganisms from different synthetic and natural aromatic compounds, such as aromatic amino acid and lignin (Mohamed, Ismail, Heider, & Fuchs, 2002). Benzeneacetic acid can be produced by the fermentation of soya beans using BacillusLicheniformis (Kim, Yang, & Song, 1999; Yong, Choi, Hur, & Hong, 2001). Benzeneacetic acid can be employed as a therapeutic agent for treatment of cancer (Athankar, Wasewar, Varma, Shende, & Uslu, 2015). Benzeneacetic acid has lots of versatile biological, medicinal activities, and industrial application. Therefore, it is necessary to remove benzeneacetic acid acids as well as separation of acid in aqueous solution. Because of low cost, ease, and high efficiency, adsorption method has been intensively investigated to remove benzeneacetic acid from aqueous solution.
Recently, nanoparticles have been believed as an alternative adsorbent because high surface area, cost effective, and easy preparation. Calcium peroxide (CaO2) nanoparticles have been used as a novel adsorbent to achieve a high adsorption capacity and greater active sites(Madan, Upwanshi, & Wasewar, 2016b). To our best knowledge, however, literature on optimization of benzeneacetic acid adsorption using CaO2 nanoparticles as an adsorbent by Taguchi is not available.
In 1940s, DrGenichi Taguchi developed Taguchi methodology, Taguchi method is statistical tool used to find out the optimum conditions with less number of experiments (Nian, Yang, & Tarng, 1999). Taguchi is a systematic application of design and analysis of experiments and efficient method of optimization which reduces the cost of experiments. Taguchi method is based on number of steps such as identify the quality of characteristics, design parameters selection, number of factor levels determine, choice of suitable orthogonal array, outcome evaluate using signal-to-noise (S/N) ratios, ANOVA, optimum levels of factors selection, optimum process parameters verify during the confirmation experiment, and calculate the confidence interval (Engin, Özdemir, Turan, & Turan, 2008; Sadrzadeh & Mohammadi, 2008).
In this study, CaO2 nanoparticles were synthesized and the physical, chemical, and structural properties of this nanoparticle were characterized by XRD, HR-FESEM, EDX, TEM, and HR-TEM. The adsorption of benzeneacetic acid on the synthesized CaO2 nanoparticle adsorbent was carried out by batch adsorption experiments. Optimization of parameters such as adsorbent dosage, initial benzeneacetic acid concentration, and contact time using Taguchi's experimental design methodology were carried out.
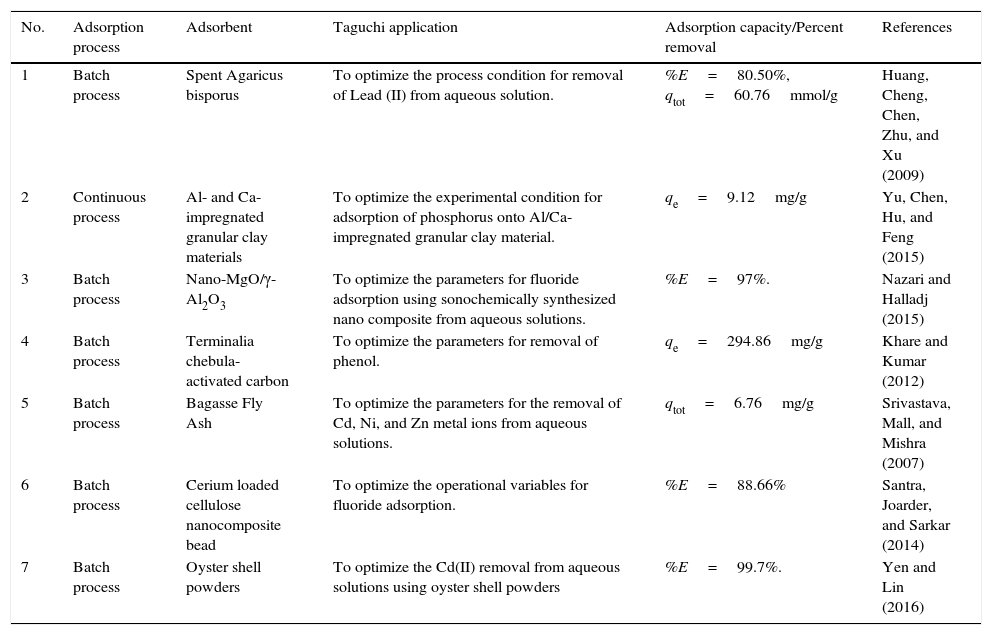
For work on various application of Taguchi in the adsorption process are shown in Table 1.
Summary of Taguchi applications in adsorption processes.
| No. | Adsorption process | Adsorbent | Taguchi application | Adsorption capacity/Percent removal | References |
|---|---|---|---|---|---|
| 1 | Batch process | Spent Agaricus bisporus | To optimize the process condition for removal of Lead (II) from aqueous solution. | %E=80.50%, qtot=60.76mmol/g | Huang, Cheng, Chen, Zhu, and Xu (2009) |
| 2 | Continuous process | Al- and Ca-impregnated granular clay materials | To optimize the experimental condition for adsorption of phosphorus onto Al/Ca-impregnated granular clay material. | qe=9.12mg/g | Yu, Chen, Hu, and Feng (2015) |
| 3 | Batch process | Nano-MgO/γ-Al2O3 | To optimize the parameters for fluoride adsorption using sonochemically synthesized nano composite from aqueous solutions. | %E=97%. | Nazari and Halladj (2015) |
| 4 | Batch process | Terminalia chebula-activated carbon | To optimize the parameters for removal of phenol. | qe=294.86mg/g | Khare and Kumar (2012) |
| 5 | Batch process | Bagasse Fly Ash | To optimize the parameters for the removal of Cd, Ni, and Zn metal ions from aqueous solutions. | qtot=6.76mg/g | Srivastava, Mall, and Mishra (2007) |
| 6 | Batch process | Cerium loaded cellulose nanocomposite bead | To optimize the operational variables for fluoride adsorption. | %E=88.66% | Santra, Joarder, and Sarkar (2014) |
| 7 | Batch process | Oyster shell powders | To optimize the Cd(II) removal from aqueous solutions using oyster shell powders | %E=99.7%. | Yen and Lin (2016) |
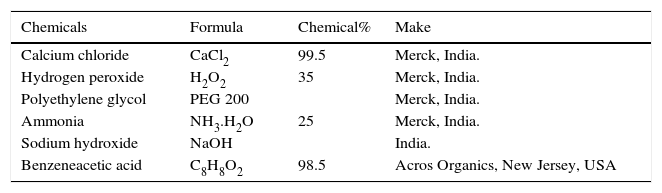
The details of chemicals used in present work are given in Table 2. All the chemicals were used without any treatment and purification. The pH of the solution was adjusted with 0.1M NaOH. All the aqueous solutions were prepared using double distilled water.
Details of chemicals used.
| Chemicals | Formula | Chemical% | Make |
|---|---|---|---|
| Calcium chloride | CaCl2 | 99.5 | Merck, India. |
| Hydrogen peroxide | H2O2 | 35 | Merck, India. |
| Polyethylene glycol | PEG 200 | Merck, India. | |
| Ammonia | NH3.H2O | 25 | Merck, India. |
| Sodium hydroxide | NaOH | India. | |
| Benzeneacetic acid | C8H8O2 | 98.5 | Acros Organics, New Jersey, USA |
A digital pH meter (Spectral Lab Instrumental Pvt. Ltd., India) was use to measure pH. X-ray powder diffraction (XRD) analysis was performed by X-ray diffractometer (PAN analytical X’pert PRO) Using Cu X-ray tube (λ=1.5406Å). Morphologies of samples were observed with a high resolution field emission scanning electron microscope (HR-FESEM) from Zeiss, model name ULTRA Plus. It comes with a GeminiÒ column that proposes a theoretical resolution of 1.0nm at 15kV. Energy dispersive X-ray analysis (EDX) spectrometer was carried out using X Flash 6130 Bruker. Transmission Electron Microscopy (TEM) analysis of particles was performed in PHILIPS-CM 200, operated at 20–200kV. High Resolution transmission electron microscopy (HR-TEM) of particles was carried out using JEOL JEM-2100.
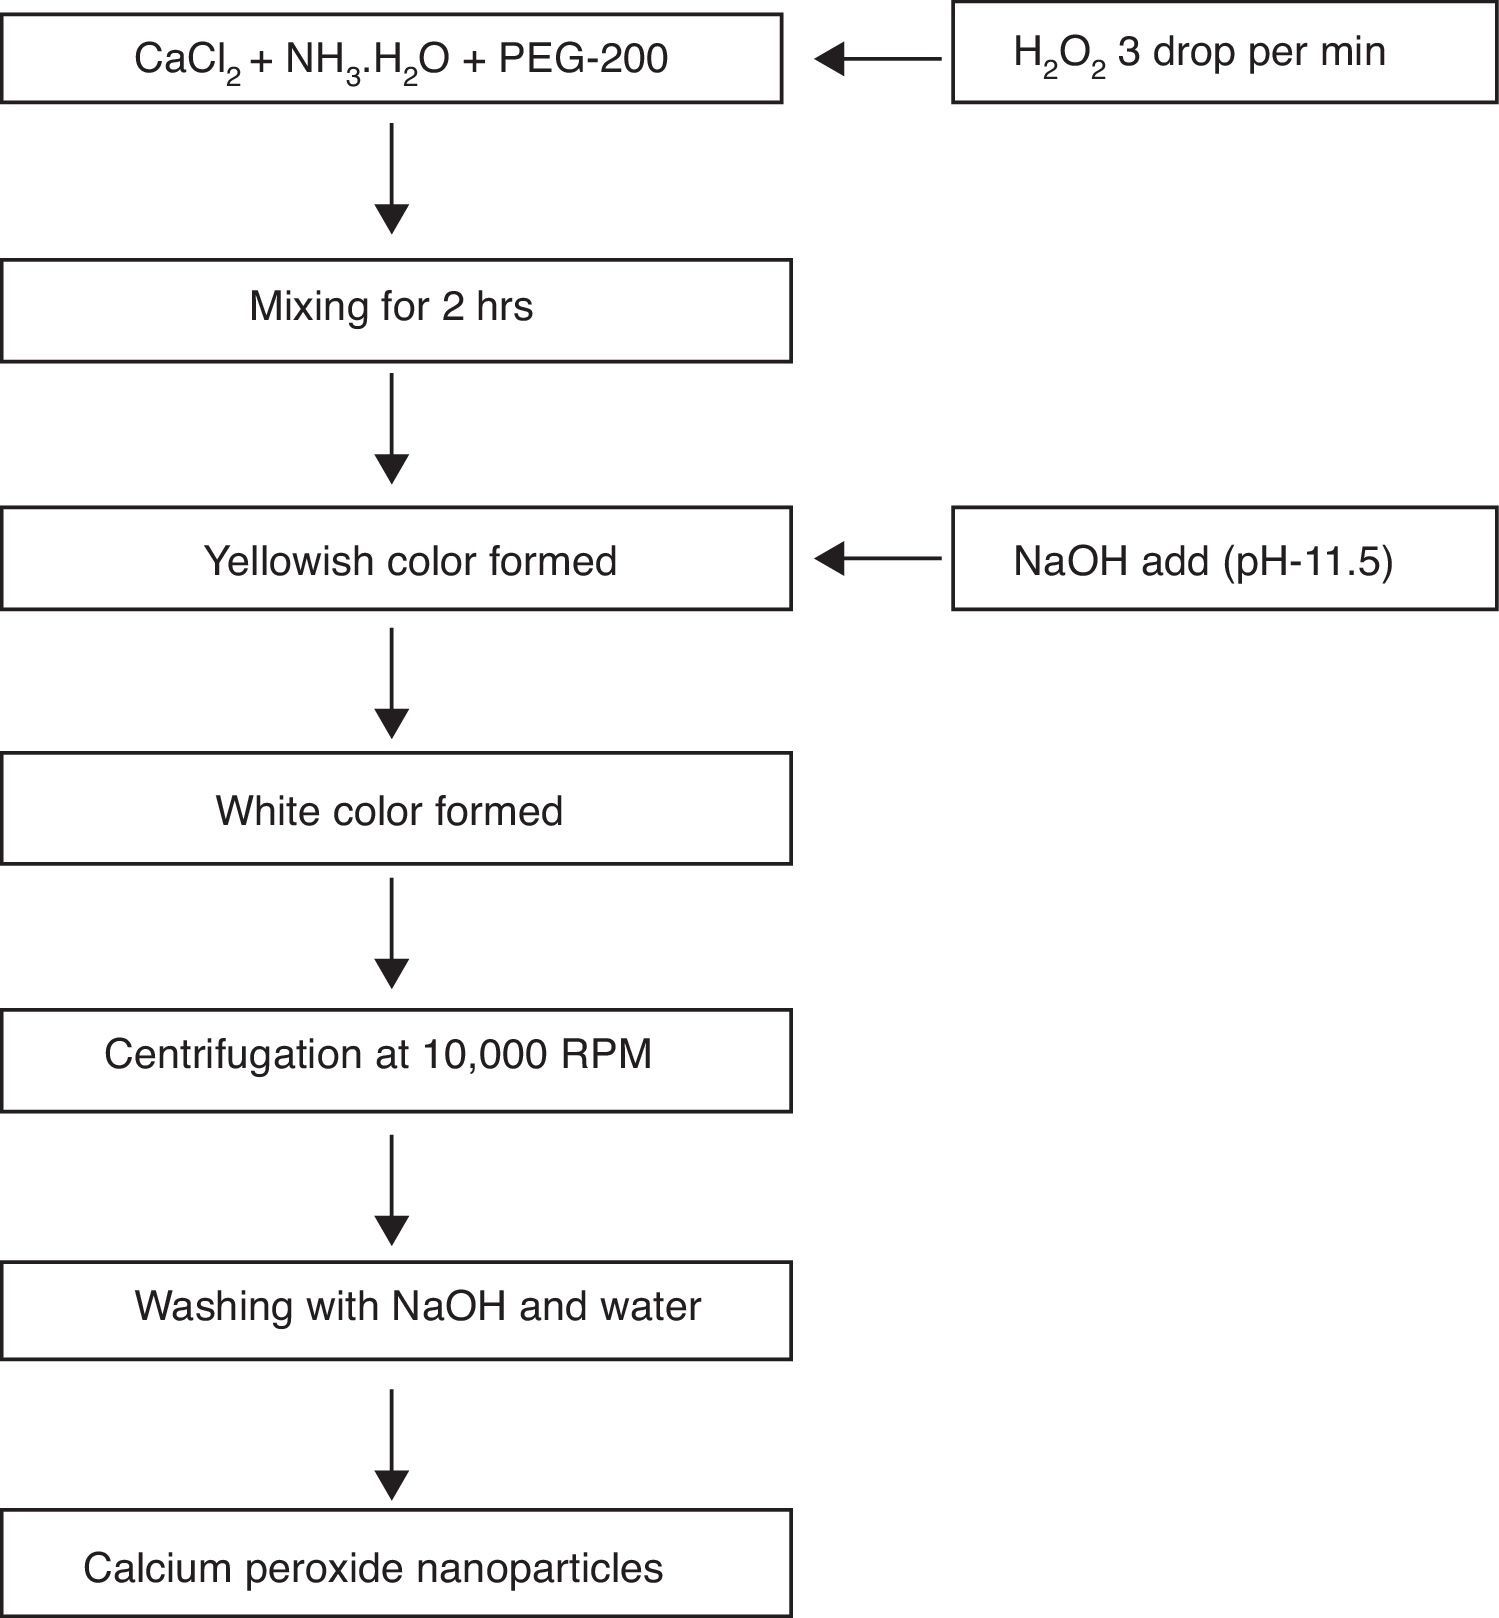
2.3Synthesis of calcium peroxide(CaO2) nanoparticlesThe CaO2 nanoparticles were prepared by the existing method from Khodaveisi et al. with slight modification (Khodaveisi et al., 2011). Briefly, 9g CaCl2 was first dissolved in 90mL water, followed by the addition of 45mL NH3. H2O (1M) and 360mL PEG-200 solution. The mixture was allowed to stir at 400rpm, and 45mL H2O2 was immediately added to it at the rate of three drops per minute for about 2h. The stirring was continued, and pH of the mixture was adjusted to 11.5. The change in color of suspension from yellowish to white indicated the formation of CaO2 nanoparticles. The suspension was centrifuged at 10,000rpm for 5min,and CaO2 nanoparticles were collected. The particles were initially washed thrice using NaOH solution, and then twice with distilled water, and dried at 80°C for 120min in vacuum oven. The dried CaO2 nanoparticles were later used for adsorption experiments. A schematic outline of the synthesis of CaO2 nanoparticles is shown in Figure 1.
2.4Batch adsorption studies
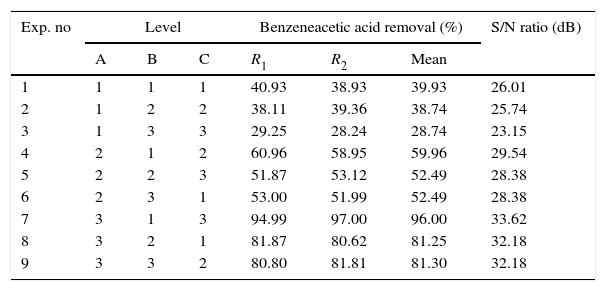
Adsorption batch runs were performed for optimization process according to an orthogonal array L9 (Table 3) and results obtained from each set as are (%E) given in Table 4. In each experimental run, 10mL of aqueous benzeneacetic acid solution of known concentration and the known amount of nanoparticle of CaO2 were taken in 100mL Erlenmeyer flask. The flasks were agitated at a constant shaking rate at 22±2°C in a water bath controlled shaker (REMI, RSB-12, and India). At the end of shaking, the samples were centrifuged and the supernatant used for determination of the benzeneacetic acid concentration.
L9 orthogonal array of the operational variables each at three different variables and calculated S/N ratio and removal efficiencies.
| Exp. no | Level | Benzeneacetic acid removal (%) | S/N ratio (dB) | ||||
|---|---|---|---|---|---|---|---|
| A | B | C | R1 | R2 | Mean | ||
| 1 | 1 | 1 | 1 | 40.93 | 38.93 | 39.93 | 26.01 |
| 2 | 1 | 2 | 2 | 38.11 | 39.36 | 38.74 | 25.74 |
| 3 | 1 | 3 | 3 | 29.25 | 28.24 | 28.74 | 23.15 |
| 4 | 2 | 1 | 2 | 60.96 | 58.95 | 59.96 | 29.54 |
| 5 | 2 | 2 | 3 | 51.87 | 53.12 | 52.49 | 28.38 |
| 6 | 2 | 3 | 1 | 53.00 | 51.99 | 52.49 | 28.38 |
| 7 | 3 | 1 | 3 | 94.99 | 97.00 | 96.00 | 33.62 |
| 8 | 3 | 2 | 1 | 81.87 | 80.62 | 81.25 | 32.18 |
| 9 | 3 | 3 | 2 | 80.80 | 81.81 | 81.30 | 32.18 |
Removal of benzeneacetic acid is given by Eq. (1) as follows:
where C0 is the initial concentration of benzeneacetic acid (g/L) and Ce is the equilibrium concentration of benzeneacetic acid (g/L).2.5Taguchi methodology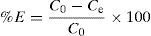
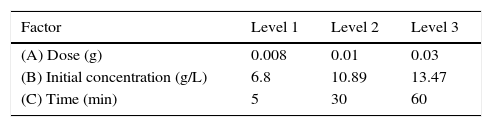
The Taguchi method is a simple and vigorous method involves the different experimental conditions through orthogonal arrays to reduce experimental errors and process variation, enhance the efficiency, optimizing the process parameters and reproducibility of experiments. So, the method reduces work time and cost in the processes(Asiltürk & Neseli, 2012). The important parameters affecting adsorption are initial concentration of the adsorbate (g/L), adsorbent dosage (W) and contact time (t) and each factor at three levels on the adsorption capacity and removal efficiency was studied. The used level setting values of the main factors (A–C). Taguchi's L9 orthogonal array matrix was used which incorporates three parameters and three levels.
In Taguchi methodology, the quality characteristics are employed into three different options: “larger is the better”, “nominal the-best”, and “smaller-the-better. The objective of this study was to remove benzeneacetic acid by CaO2 nanoparticles, the quality characteristic go for “larger is the better” of benzeneacetic acid removal defined by Eq. (2).
where the subscript LB denoted “larger is the better” and n was the number of repetitions under the same experimental conditions and yi showed the measurement results. Each experiment was repeated twice (1st run and 2nd run) and the S/N ratio was determined using Minitab software (version 14). L and 9 mean Latin square and the number of experiments, and also, 3 and 3 indicate the numbers of factors and their levels, respectively.3Results and discussion3.1CaO2 nanoparticles characterization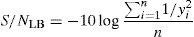
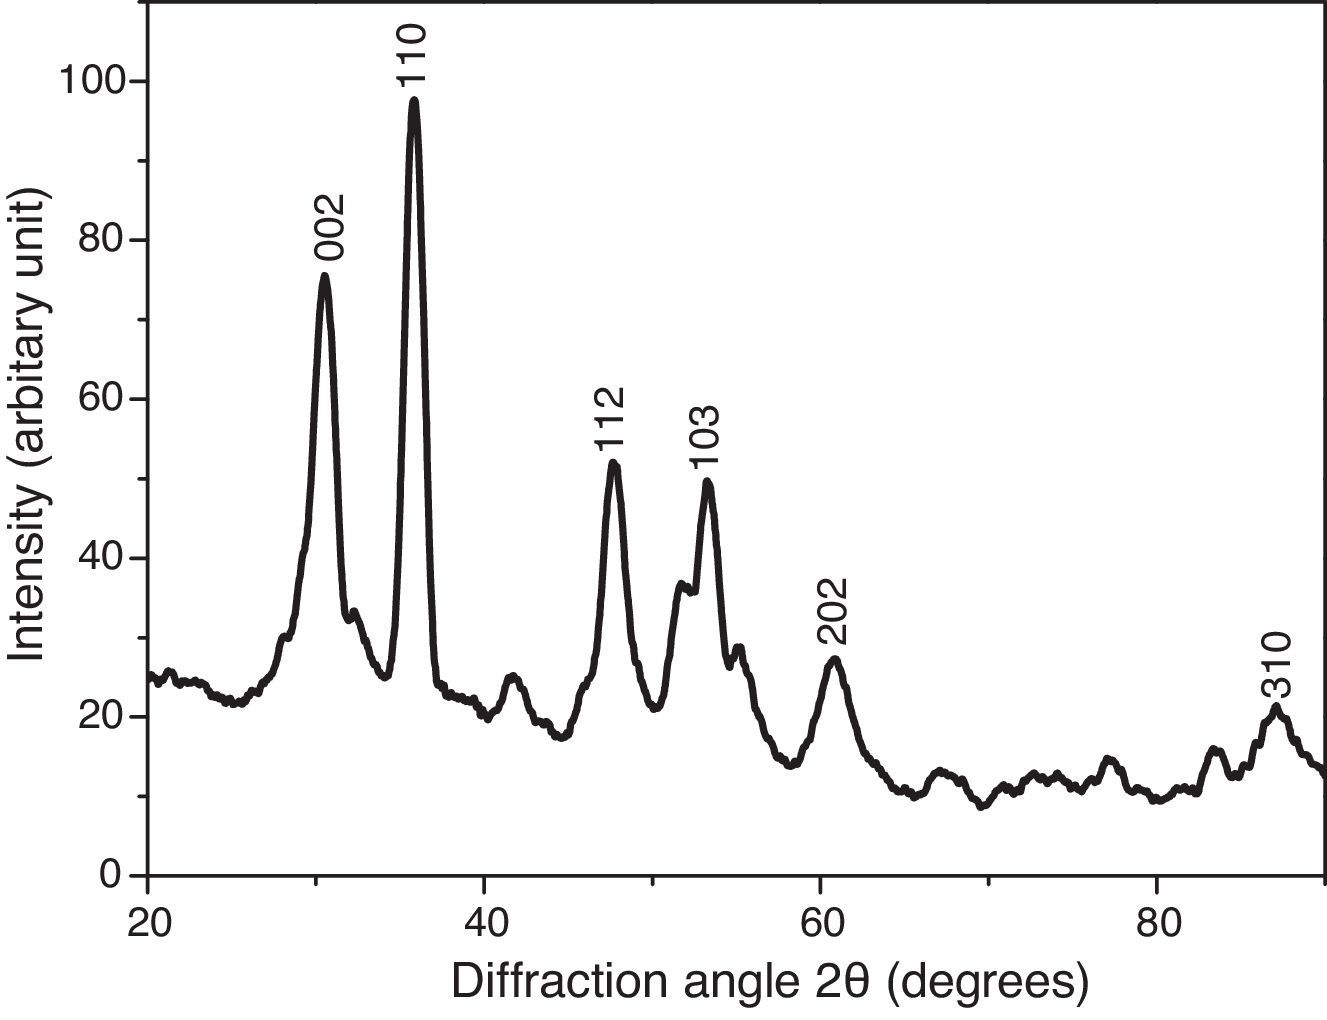
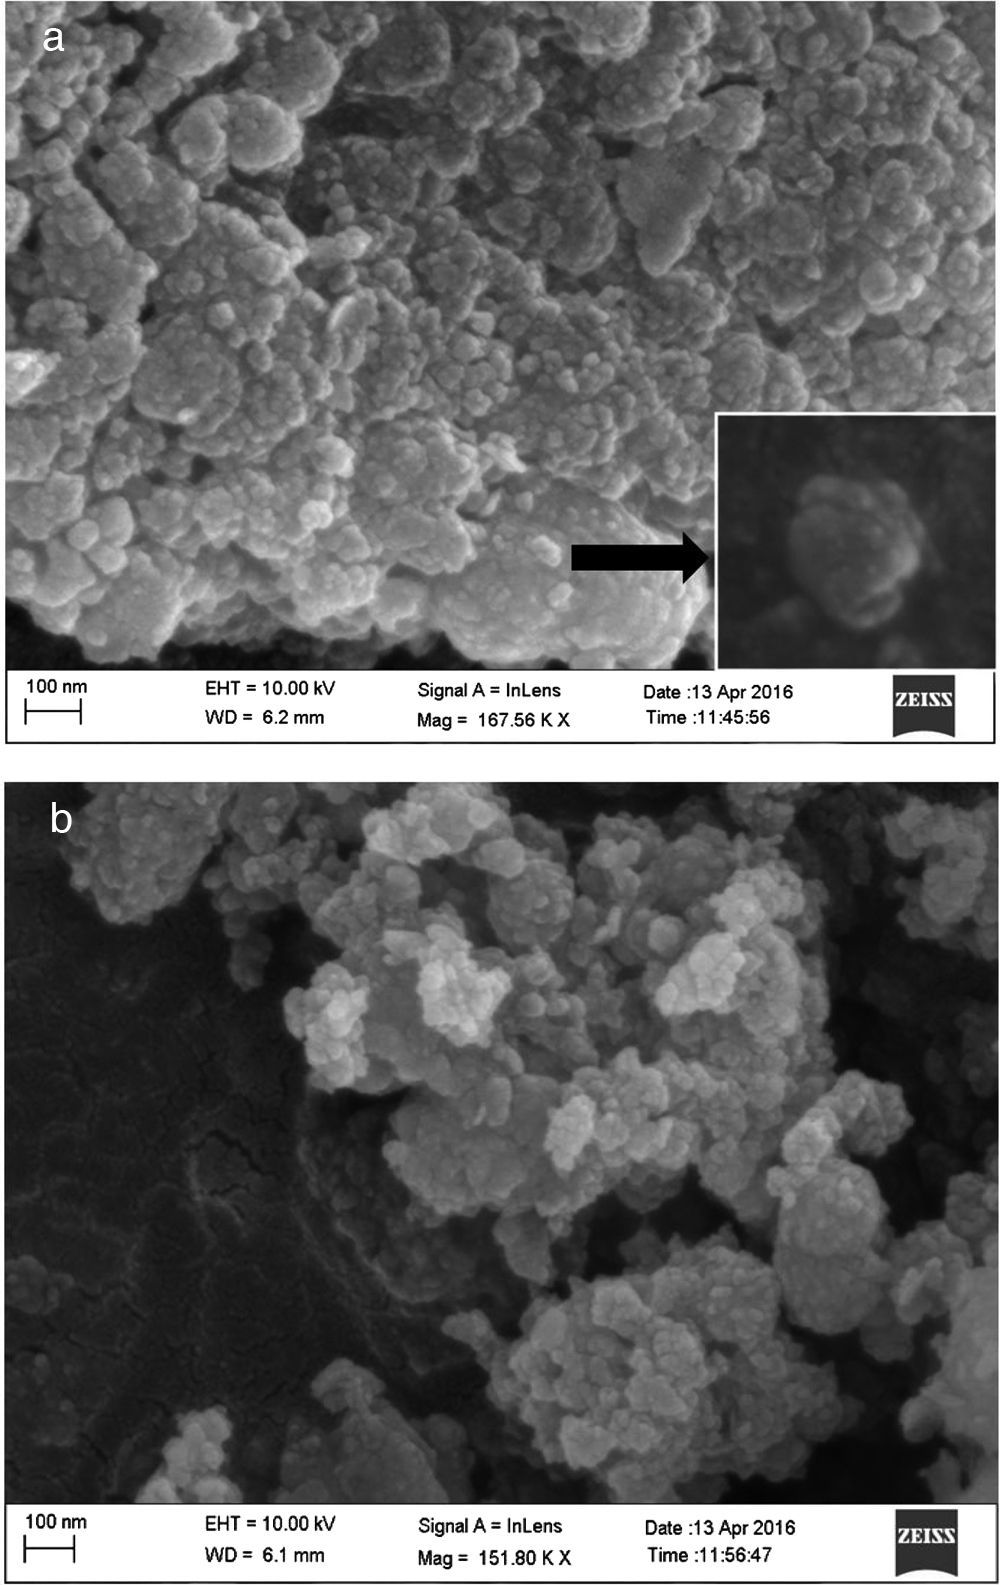
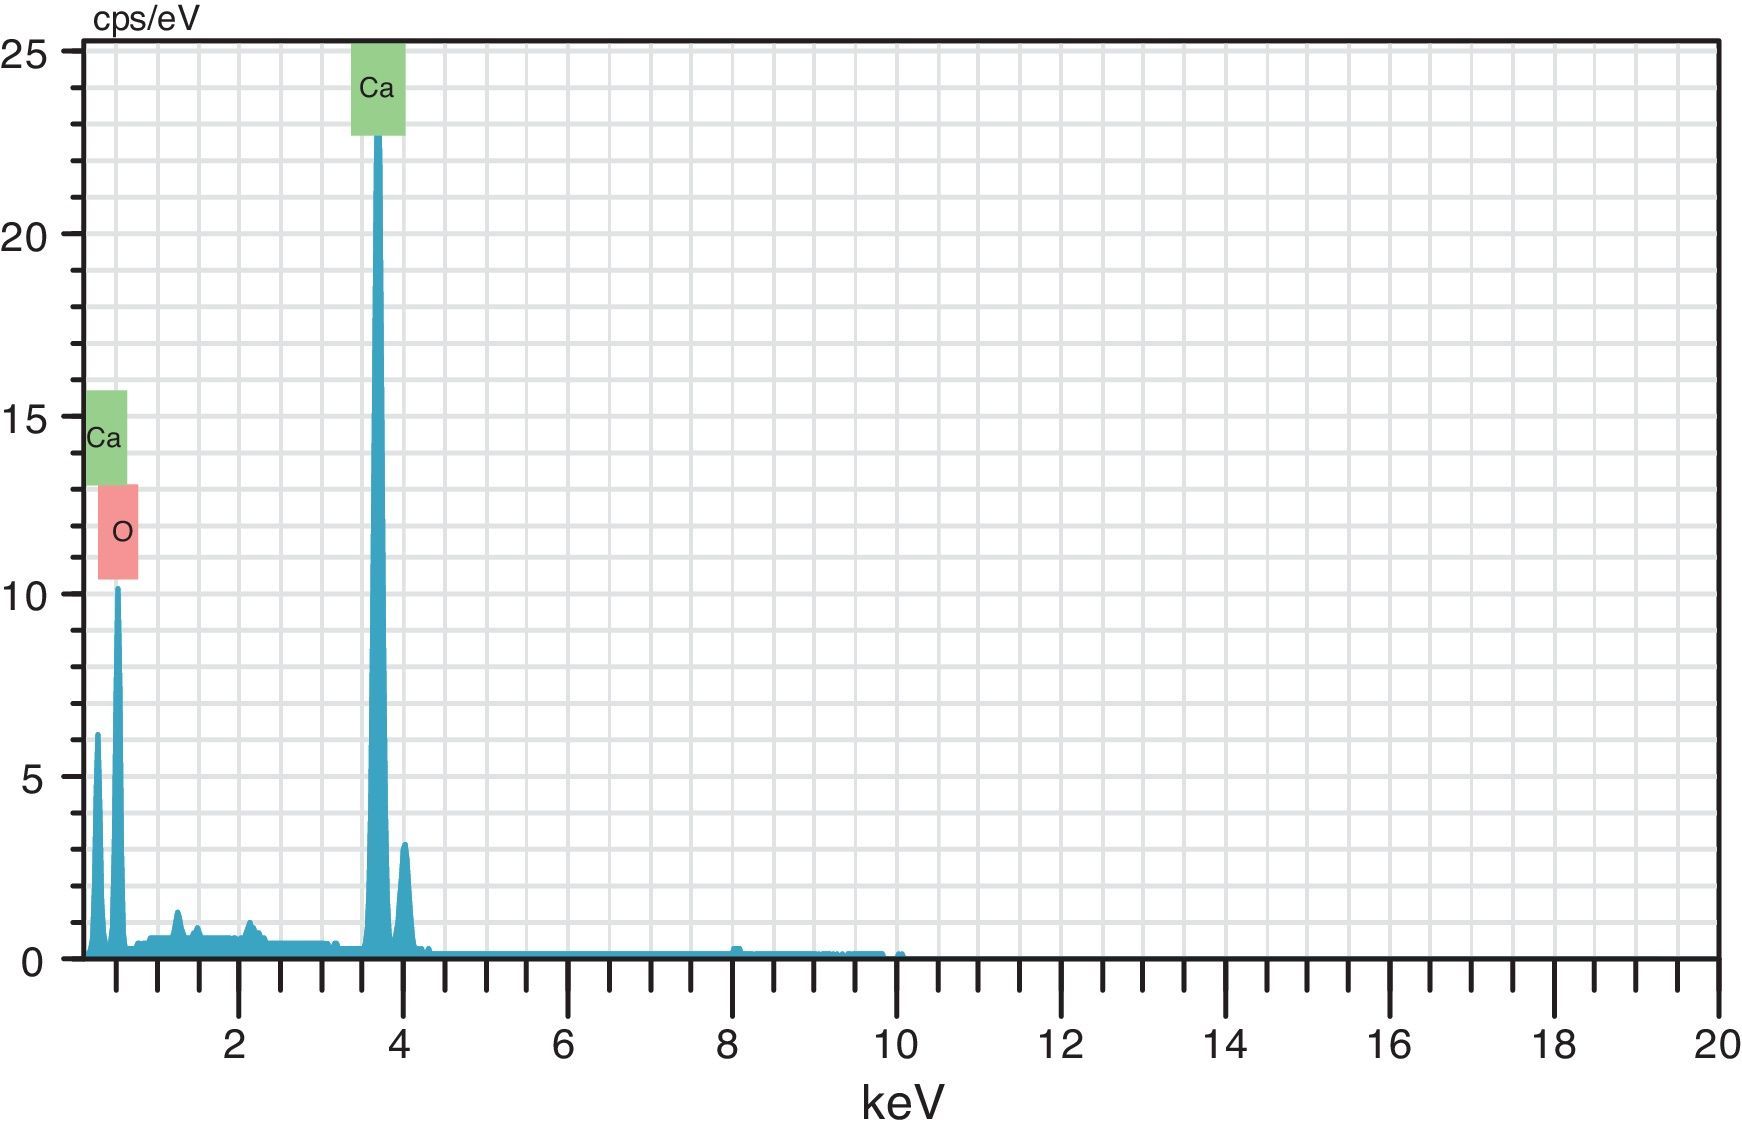
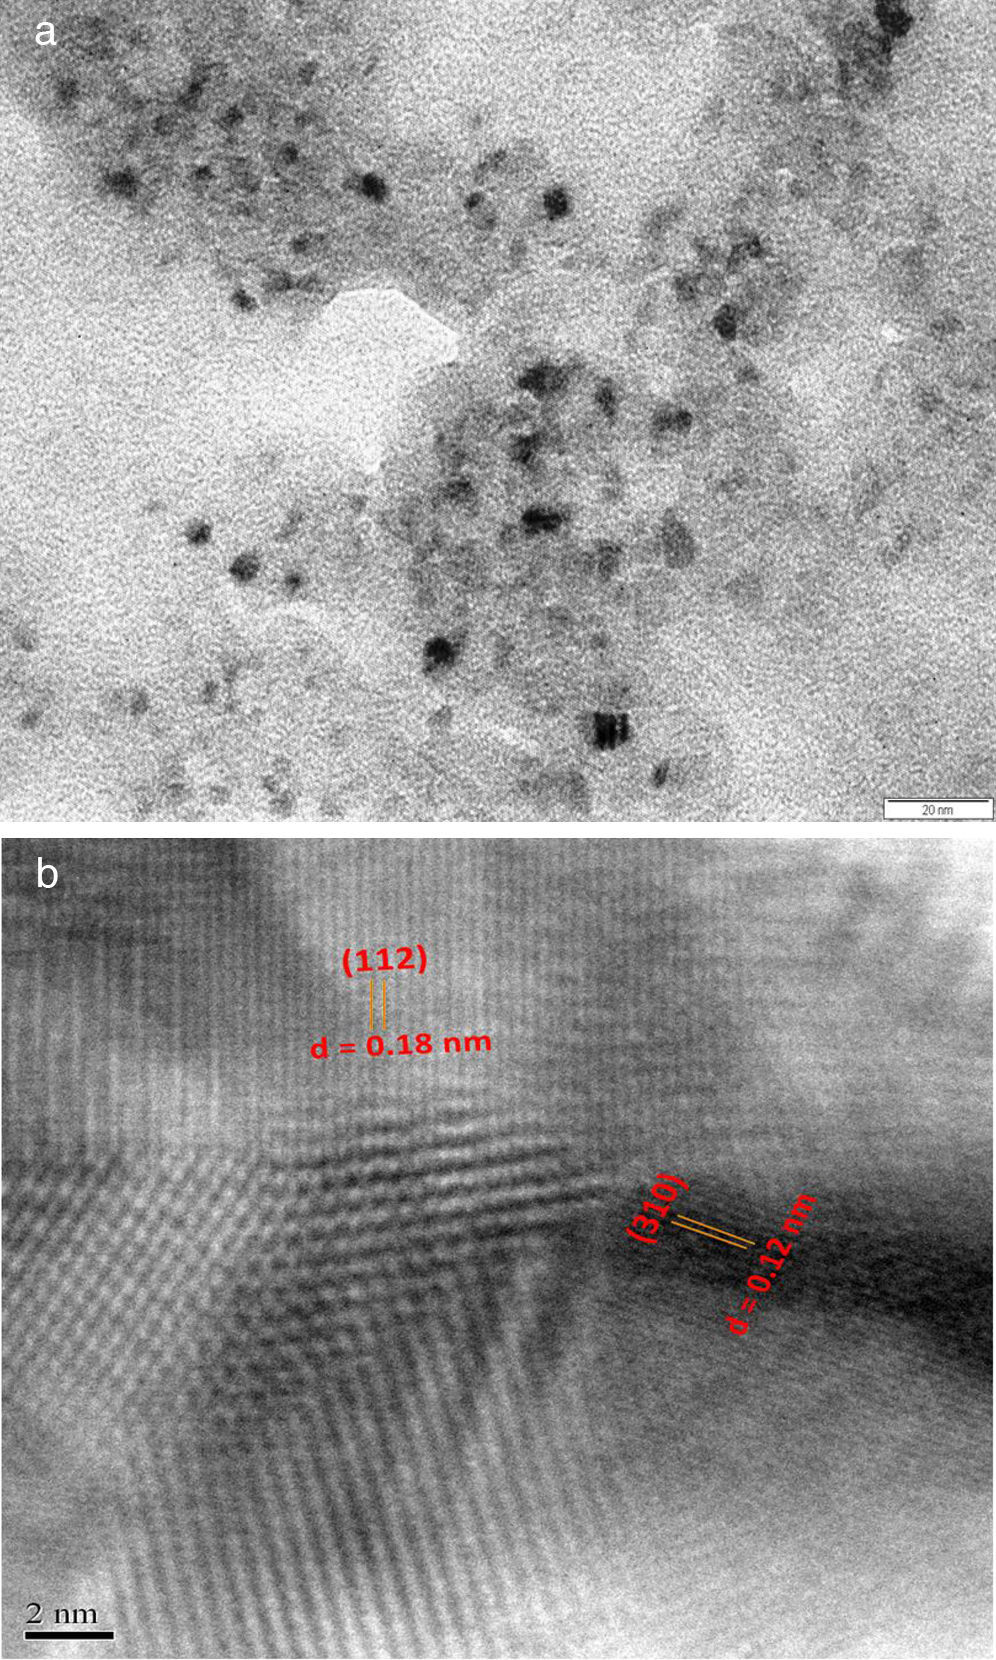
X-ray diffraction patterns of CaO2 are shown in Figure 2. The diffraction peaks at 2θ=30.47°, 35.75°, 47.46°, 53.28°, 60.82° and 87.1°can be respectively indexed to (002), (110), (112), (103), (202) and (310) reflections of CaO2 nanoparticles and match the reference patterns of standard file of CaO2 (Joint Committee for Powder Diffraction Studies (JCPDS) File No. 03-0865). The morphology of prepared CaO2 nanoparticles was studied by the HR-FESEM analysis (Fig. 3a and b). It can be clearly indicated that nanoparticles was looked like the aggregated round shape and are mostly spherical in shape. EDS showed the trace spectrum of CaO2 nanoparticles as shown in Figure 4. The atomic compositions for calcium (Ca) and oxygen (O) were 42.88% and 57.12%, respectively. Figure 5a displays the TEM image of large number of CaO2 nanoparticles with approximately uniform shape and size. It can be clearly seen is near spherical in shape with average particle size of about 10–40nm. Figure 5b shows HR-TEM images of synthesized CaO2 nanoparticles. The HR-TEM images clearly confirms, CaO2 nanoparticles have a lattice structure with an interplanar spacing about 0.18 and 0.12nm, which corresponds to (112) and (310) plane of CaO2 respectively. These results are reliable with the XRD pattern.
3.2OA and the analysis of S/N ratio (Taguchi method)
 HR-FESEM images of CaO2 nanoparticles.")

 TEM and (b) HR-TEM images of CaO2 nanoparticles.")
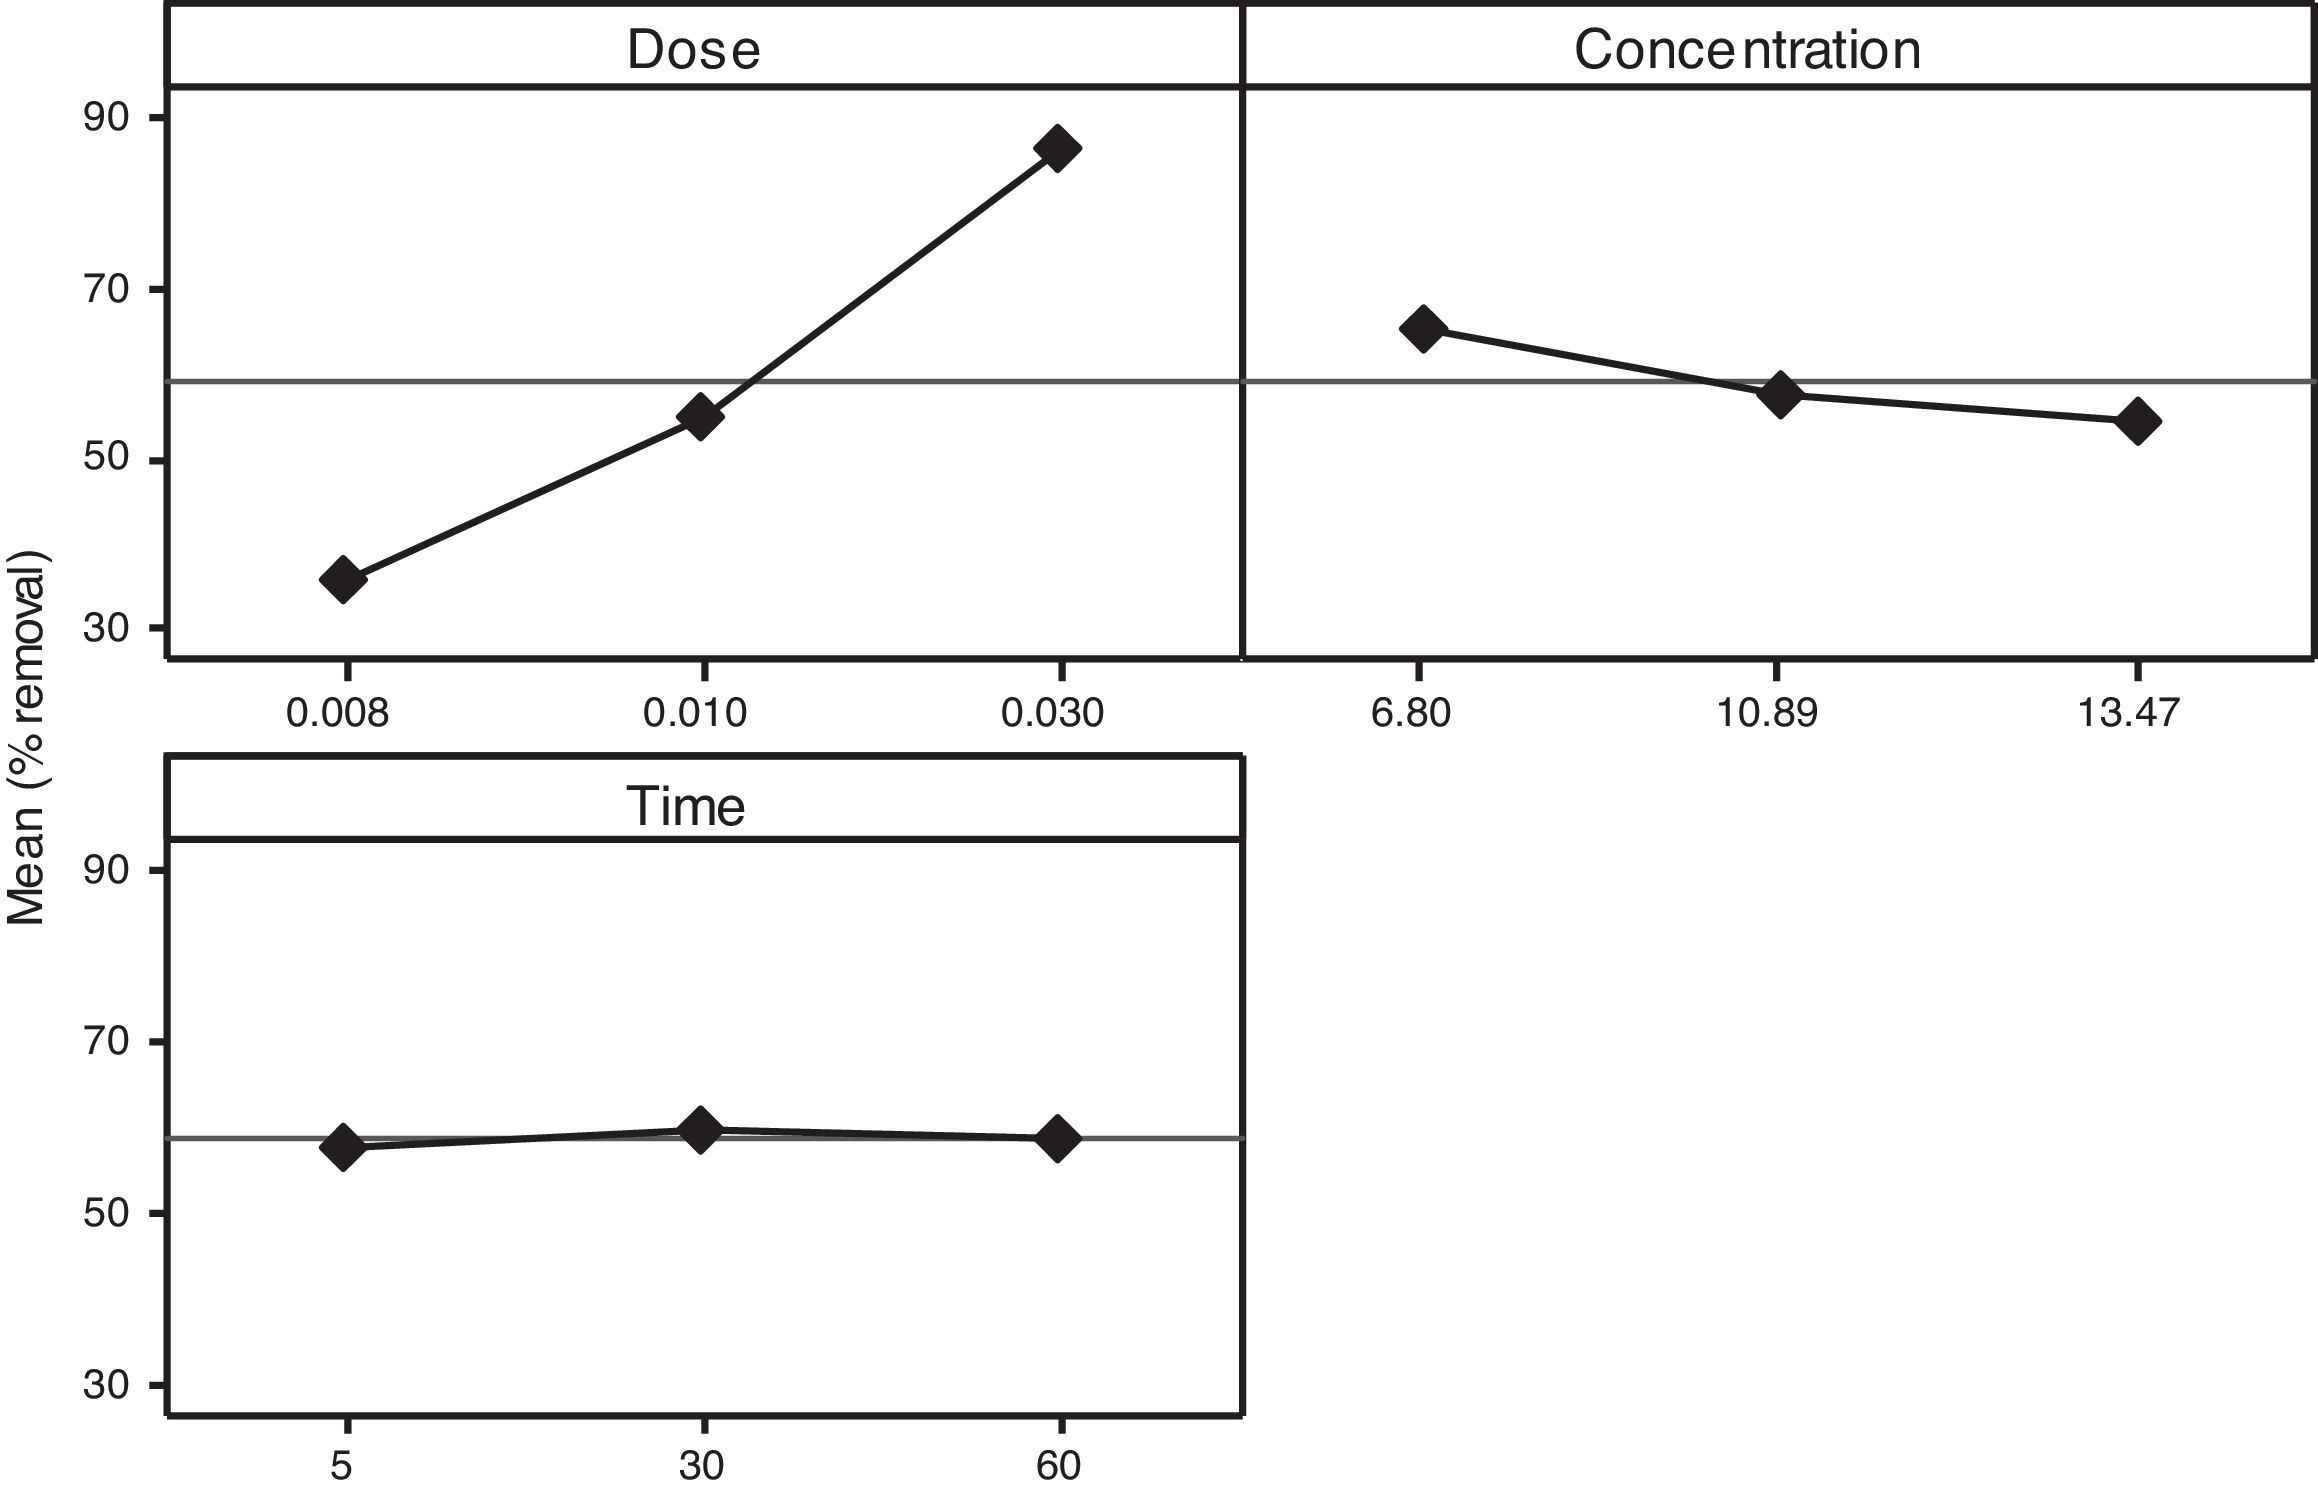
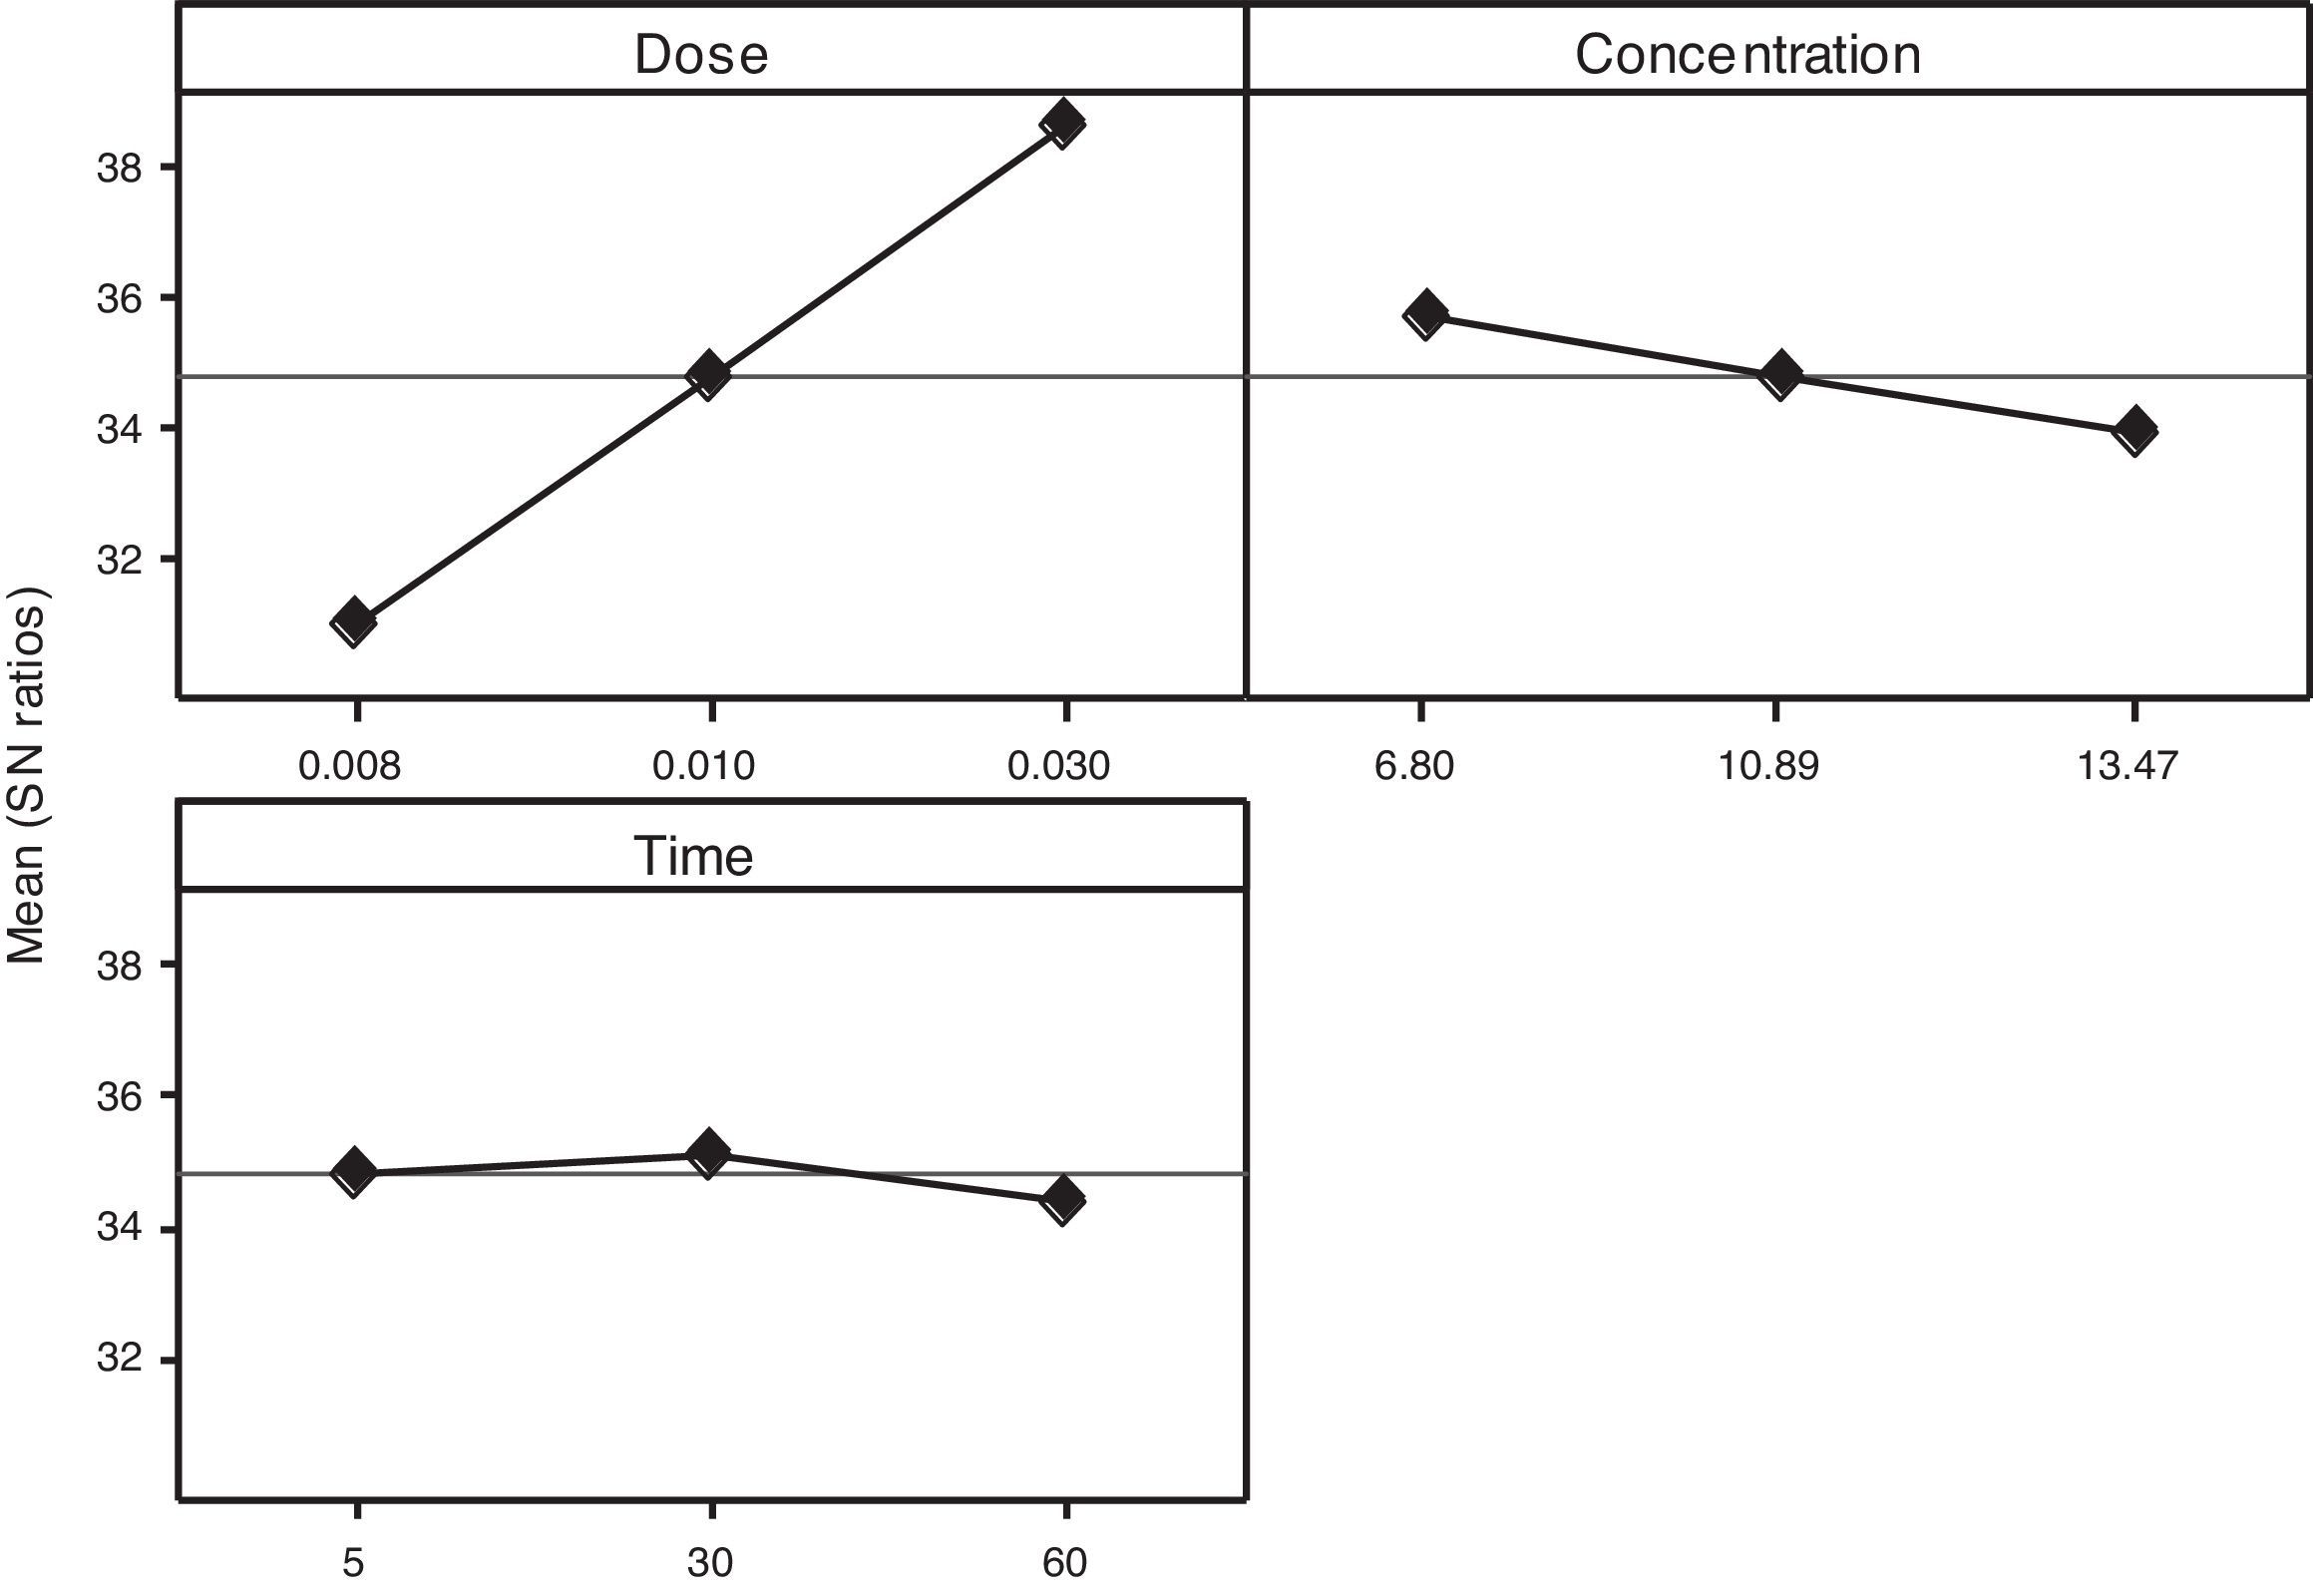
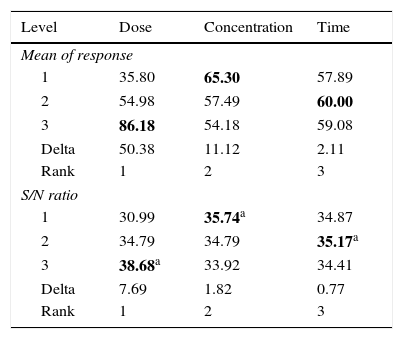
According to the Taguchi L9 (33) OA, nine experiments were performed, and each experiment was repeated twice which were denoted by R1 and R2. The value of the response (removal efficiency) and S/N ratio are illustrated in Table 5. The mean of response and the mean of S/N ratio variable for each factor at a certain level can be determined. The boldfaces refer to the maximum value of the mean of response and the mean of the S/N ratios of a certain factor among four levels as shown in Table 5. The mean response plot for the removal of benzeneacetic acid using CaO2 nanoparticles is shown in the Figure 6. The plot is used to show the relationship between the variables and output response. Adsorbent dosage ‘A’ and contact time ‘C’ increases with increases the removal efficiency of benzeneacetic acid. The effect of initial benzeneacetic acid concentration for removal is shown by factor ‘B’. Removal efficiency increases with decreases in benzeneacetic acid concentration. The optimum level of operational variables is determined from the maximum value. The mean of removal efficiency level ‘3’ is 86.18, level ‘1’ is 65.30, and level ‘2’ is 60.00 and its shows this level gives maximum efficiency. The S/N ratio plot as shown in Figure 7. According to these figures, increasing the adsorbent dose with low concentration of benzeneacetic acid concentration and increase the contact time the removal efficiency is increases and S/N ratio increases. The terms ‘signal’ to ‘noise’ ratio signifies the desirable and undesirable value for the output response, respectively. The S/N ratio of benzeneacetic acid removal was achieved. The process parameters were optimized based on S/N ratio. Lager the S/N ratio higher the benzeneacetic acid removal. The value of the S/N ratio, illustrate in Table 5. The mean of S/N ratios of level ‘3’ is 38.68, level ‘1’ is 35.74 and level ‘2’ is 35.17 and its shows this level gives higher efficiency. The optimum parameters were adsorbent dose (A) of 0.03g, initial benzeneacetic acid concentration (B) of 6.8g/L, and time (C) of 30min. The optimum combination was found to be A3-B1-C2 with corresponding mean of response value 86.18, 65.30, and 60.00and mean of S/N ratio value 38.68, 35.74, and 35.17 respectively.
Calculated mean of response and S/N ratio for data obtained from benzeneacetic acid removal experiments.
| Level | Dose | Concentration | Time |
|---|---|---|---|
| Mean of response | |||
| 1 | 35.80 | 65.30 | 57.89 |
| 2 | 54.98 | 57.49 | 60.00 |
| 3 | 86.18 | 54.18 | 59.08 |
| Delta | 50.38 | 11.12 | 2.11 |
| Rank | 1 | 2 | 3 |
| S/N ratio | |||
| 1 | 30.99 | 35.74a | 34.87 |
| 2 | 34.79 | 34.79 | 35.17a |
| 3 | 38.68a | 33.92 | 34.41 |
| Delta | 7.69 | 1.82 | 0.77 |
| Rank | 1 | 2 | 3 |
Note: The bold values at each column of this table refer to maximum calculated mean of response (benzeneacetic acid removal efficiency).
Difference: maximum−minimum values for each column.
Rank: The order of importance of factors for the removal of benzeneacetic acid.
Note: The bold values at each column of this table refer to maximum calculated S/N ratio according to the “larger is better” criterion.


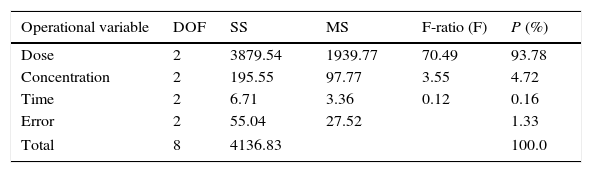
Analysis of variance (ANOVA) was performed to investigate which process parameters significantly affect the process responses and to determine the percent contribution of each operational variable to the response (Engin et al., 2008; Sadrzadeh & Mohammadi, 2008). Table 6 shows the result of ANOVA test for mean response. ANOVA also used for estimate the error variance. The most significant factors that affect benzeneacetic acid removal was found to be adsorbent dose (93.78%) >initial concentration (4.72%) >contact time (0.16%). Percent contribution (P-ratio) is defined as a relation between the parameters’ sum of square to the total sum of square, which indicates the contributions of these parameters (Nik, Sadrzadeh, & Kaliaguine, 2012):
3.4Development of regression model
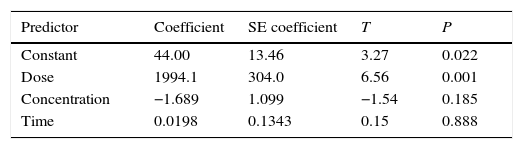
Regression analysis was developed to investigate the relationship between the variables (Deniz, 2013). The mathematical model for benzeneacetic acid removal through the statistical analysis is shown as
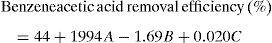
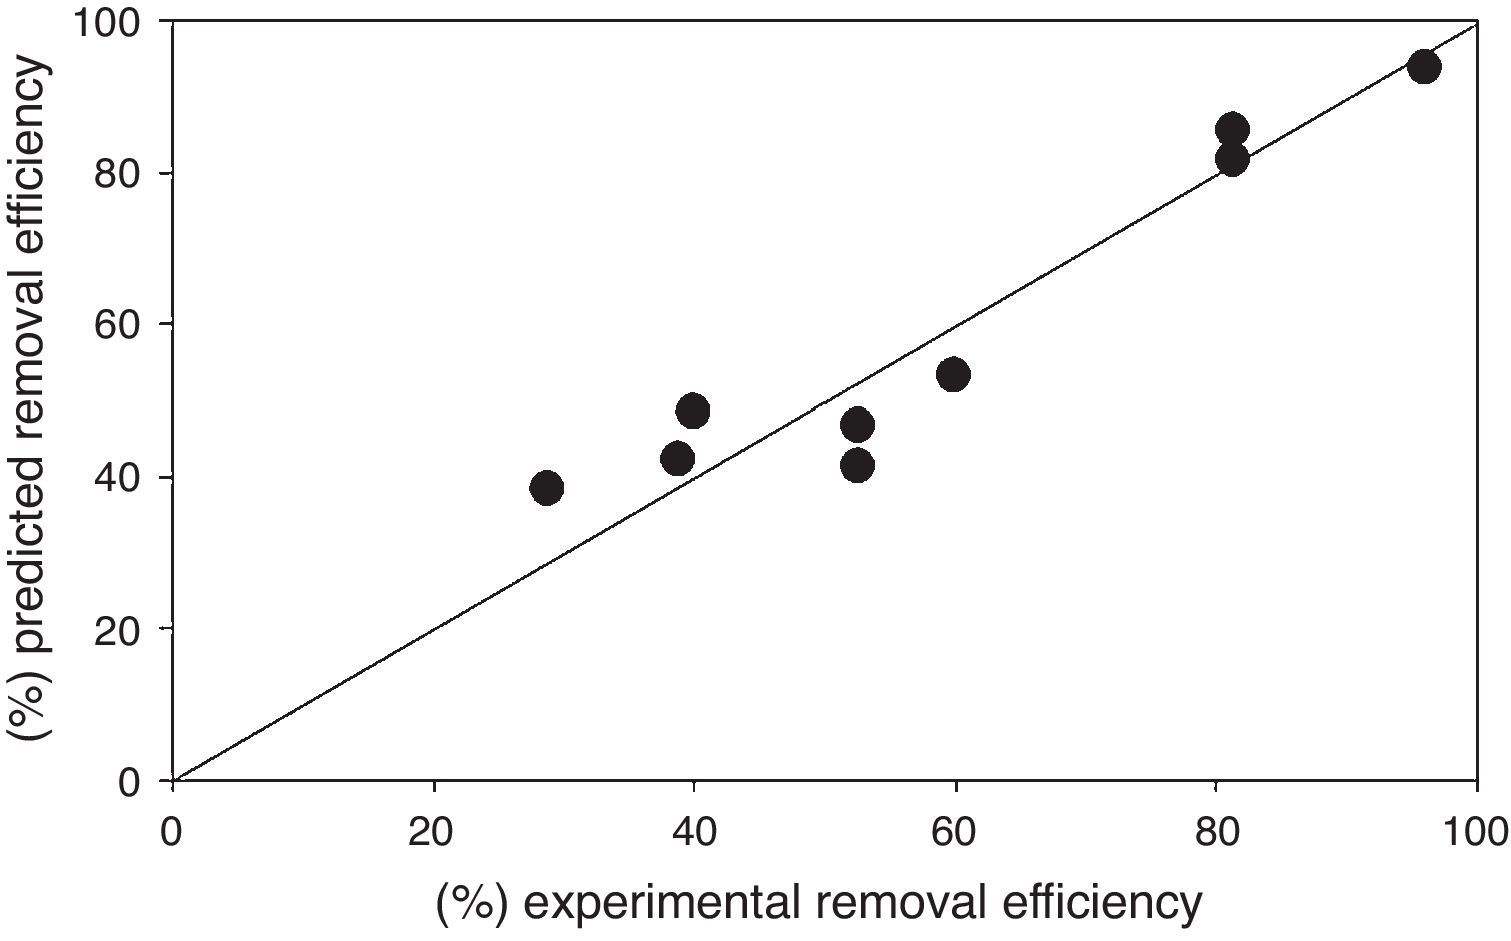
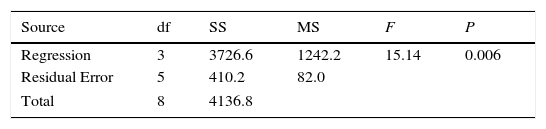
Regression equation provides predicted data from different experimental condition and it's compared with experimental data shown in Figure 8. Table 7 shows the regression analysis. Experimental and predicted values of the removal efficiency of benzeneacetic acid are almost equal. So as to the model tells the interaction of process parameters. ANOVA was derived to observe the null hypothesis for the regression shown in Table 8. A p value less than 0.05 was chosen which show the estimated model is considerable. The predicted and the experimental response (benzeneacetic acid removal) show a very good agreement with each other, and the coefficient determination (R2) of 0.91 implicates a good fitted of the model (Fig. 8).

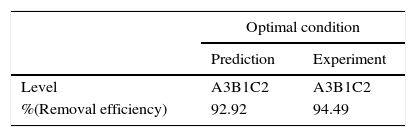
In Taguchi method, confirmation testis a necessary for the optimization study (Santra et al., 2014). The confirmation test is performed with optimum levels and factors. From optimum conditions, to validate the predicted optimal conditions, new experiments were carried out and 94.49% benzeneacetic acid removal efficiency was achieved. Table 9 shows the predicted percent removal and the experimental percent removal (response) at the optimal conditions.
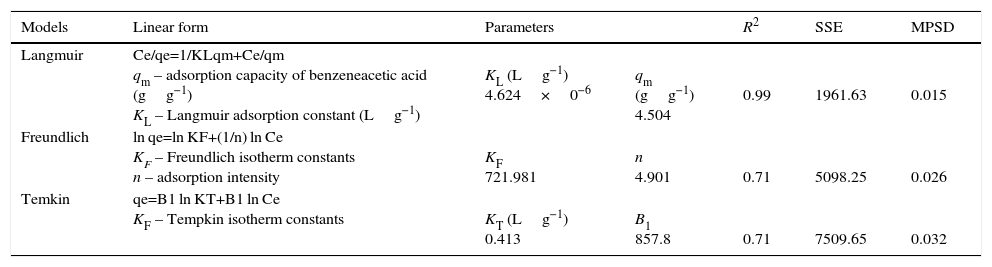
3.6Adsorption IsothermAdsorption isotherm models such as Langmuir isotherm (Langmuir, 1918), Freundlich isotherm (Freundlich, 1906), and Temkin isotherm (Tempkin & Pyzhev, 1940) were tested to explain the equilibrium adsorption of benzeneacetic acid from aqueous solution (Table 10).
Adsorption Isotherms.
| Models | Linear form | Parameters | R2 | SSE | MPSD | |
|---|---|---|---|---|---|---|
| Langmuir | Ce/qe=1/KLqm+Ce/qm qm – adsorption capacity of benzeneacetic acid (gg−1) KL – Langmuir adsorption constant (Lg−1) | KL (Lg−1) 4.624×0−6 | qm (gg−1) 4.504 | 0.99 | 1961.63 | 0.015 |
| Freundlich | ln qe=ln KF+(1/n) ln Ce KF – Freundlich isotherm constants n – adsorption intensity | KF 721.981 | n 4.901 | 0.71 | 5098.25 | 0.026 |
| Temkin | qe=B1 ln KT+B1 ln Ce KF – Tempkin isotherm constants | KT (Lg−1) 0.413 | B1 857.8 | 0.71 | 7509.65 | 0.032 |
The initial benzeneacetic acid concentration (C0) was varied from 4.8 to 13.47g/L, at a constant contact time of 60min, with 1g/L CaO2 nanoparticles at 25°C. The qe values were calculated using
where qe is the equilibrium adsorption capacity of benzeneacetic acid on the adsorbent (mgg−1), C0 is the initial benzeneacetic acid concentration (g/L), Ce is the equilibrium concentration of benzeneacetic acid in solution (g/L), V is the volume of the solution (L), W is the mass of CaO2 nanoparticles (in g).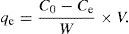
Langmuir isotherm assumes that monolayer adsorption takes place over the homogeneous CaO2nanoparticles adsorbent surface. The Freundlich isotherm considers the heterogeneous surface of an adsorbent and is used to describe the adsorption data. Temkin isotherm based on heat of adsorption of all the molecules in the layer would decrease linearly with coverage.
The best fit of data was evaluated from the correlation coefficient (R2), sum of the squares of errors (SSE), and Marquardt's percent standard deviation (MPSD) values. The value of R2 is higher and the value of SSE and MPSD shows the lower for the most favored situation. From the Table 10, it clearly shows that the Langmuir isotherm has high R2 value and low SSE and MPSD as compared to Freundlich and Temkin isotherm. Thus, this study confirms that adsorption of benzeneacetic acid takes place on the CaO2 nanoparticles, and follows the Langmuir model(Madan, Ravikumar, & Wasewar, 2016a).
4ConclusionIn present study, nanoparticles of CaO2 were synthesized by chemical precipitation method. This was confirmed by a characterization XRD, HR-FESEM, EDX, TEM and HRTEM. Taguchi method has been applied to optimize the process parameters for adsorption of benzeneacetic acid on CaO2 nanoparticles. A set of orthogonal array L9 (33) follows the “large is better” category and it shows only 9 experiments are sufficient for design of experiments. ANOVA indicated that the most significant factors were adsorbent dosage with 93.78% contribution. The removal efficiency of benzeneacetic acid (%E=94.49) was obtained by using adsorbent dosage=0.03g, initial concentration of benzeneacetic acid=6.8g/L, and contact time=30min. The experimental optimum conditions confirmed by the confirmation test which shows the value of %E is in permissible limit.
Conflict of interestThe authors have no conflicts of interest to declare.
Ministry of Human Resource and Development (MHRD), Government of India, for the financial support.
Peer Review under the responsibility of Universidad Nacional Autónoma de México.