


At the same altitude, people with greater hypoxemia would have higher hemoglobin (Hb) levels than less hypoxemic patients. It is not known whether higher hypoxemia levels (as measured by higher Hb values) affect basal glucose and lipid profile at an altitude of 4100mg (Carhuamayo and Junln).
Materials and methodsGlucose, lipid, and hemoglobin levels and body mass index (BMI) were assessed in 158 males and 348 females aged 35–75 years. Association of lipid and glucose levels with systolic and diastolic blood pressure (SBP and DBP) was also assessed. Results were analyzed using Student's t test, Chi-square test, analysis of variance, correlations, and linear multivariate analyses were adjusted for age, sex, BMI, smoking, and education.
ResultsHigher hemoglobin levels were directly associated to higher levels of total cholesterol (p<0.001), low density lipoprotein cholesterol (p<0.002), non-high density lipoprotein cholesterol (non-HDL) (p<0.01), and triglycerides (p<0.01). No association was found between hemoglobin and glucose (p>0.05). Levels of total cholesterol, high-density lipoprotein cholesterol, triglycerides, low density lipoprotein cholesterol, and blood glucose were directly associated to DBP.
ConclusionsIn people living at high altitude (4100m), the non-HDL cholesterol fraction and triglycerides are directly associated to hemoglobin value, and increases in them are in turn associated to higher DBP.
A una misma altitud, las personas con mayor hipoxemia tendrían mayores niveles de hemoglobina (Hb) que aquellos menos hipoxémicos. No se conoce si los mayores grados de hipoxemia (medidos por mayores niveles de Hb) afectan la glucemia basal y perfil lipídico a una altura 4.100m (Carhuamayo y Junín).
Materiales y métodosSe evaluaron las concentraciones de glucosa, perfil lipídico, hemoglobina, y el índice de masa corporal (IMC) en 158 varones y 348 mujeres de 35 a 75 años de edad. Se evaluó también la asociación entre las concentraciones de lípidos y de glucosa con la presión arterial sistólica y diastólica (PAD). Los resultados se analizaron con la prueba t de student, prueba del chi cuadrado, análisis de varianza, correlaciones y análisis multivariados lineales ajustados por edad, sexo, IMC, hábito de fumar y educación.
ResultadosLos mayores niveles de hemoglobina estuvieron asociados directamente con mayores concentraciones de colesterol total (P<0,001), colesterol de las lipoproteínas de baja densidad (P<0,002), colesterol–no de las lipoproteínas de alta densidad (no-HDL) (P<0,01) y triglicéridos (P<0,01). No se observó asociación de hemoglobina con la glucemia (P>0,05). Las concentraciones del colesterol total, colesterol de lipoproteínas de alta densidad, triglicéridos, y de lipoproteínas de muy baja densidad y glucemia estuvieron asociados directamente con la PAD.
ConclusionesEn las habitantes de altura (4.100m), la fracción de colesterol no-HDL y los triglicéridos se asocian directamente con el valor de hemoglobina, y los incrementos en estos se asocian a su vez con mayor PAD.
Living at high altitude (>3000m) implies a greater energy demand than the energy that appears to be compensated for by morphological and functional differences as compared to people living at sea level.1
Living at altitude is an associated with lower environmental oxygen partial pressure that leads to hypoxemia (decreased arterial oxygen partial pressure). This hypoxemia leads to tissue hypoxia, which is in turn a potent stimulator of erythropoiesis. With higher hypoxemia grades, erythropoiesis may become excessive (hemoglobin concentrations more than two standard deviations above the mean) and thus pathological, contributing to the occurrence of chronic mountain sickness, or lack of adaptation to altitude.2 The populations best adapted to altitude have lower hemoglobin concentrations than other populations.2,3 Thus, in the same population, and based on hemoglobin measurements, we may find people who have different degrees of hypoxemia, and therefore different grades of adaptation to altitude.
It has been known for a long time that prevalence rates of arterial hypertension,4 diabetes mellitus,5 and dyslipidemia6 are low at high altitude. It should be noted that dyslipidemia and high glucose levels are risk factors associated with hypertension.7 However, patterns of lipid and glucose levels appear to be modified, because recent studies have reported higher rates of dyslipidemia8 and metabolic syndrome9 in Peruvian populations living at high altitude as compared to those reported in the past.5,6 This occurs in different populations, and high prevalence rates of hypertriglyceridemia, hypercholesterolemia, and low levels of high density lipoproteins (HDL) are also seen at high altitude in Tibet (in Lhasa).10 Tibetans are considered to be adapted to altitude because they have lived there for more than 25,000 years.11 These high rates of dyslipidemia in Tibet have been associated with high values of the abdominal/hip circumference ratio,10 which would suggest that dietary pattern may modify the effects of altitude on lipid levels.
In Peruvian populations living at altitudes higher than 3000m, slightly lower rates of hypercholesterolemia, hypertriglyceridemia, low HDL, and hyperglycemia (≥126mg/dL) have been reported as compared to low-altitude populations.12 These data show that although altitude is still protective, differences from values seen at low altitudes and reported in previous studies are decreasing.4–6
It is still unknown whether in a same high-altitude population, subjects with different degrees of hypoxemia have different patterns of blood glucose and lipid levels, and, if so, how they are affected by body mass index (BMI). It is therefore important to understand how different hemoglobin values at high altitude are related to lipid profile and blood glucose levels. This study was designed to assess the impact of hypoxemia in males and females from two regions of the central Peruvian Andes. For this, hemoglobin level was used as a marker of hypoxemia.13
Subjects and methodsThis was a cross-sectional study in the districts of Carhuamayo (at an altitude of 4100m) in the second half of 2009 and Junín (at an altitude of 4100m) in the second half of 2010. Both districts are part of the province of Junín (Meseta del Bombón) in Peru. According to the most recent population census in Peru (2007), Carhuamayo has a population of 8386 inhabitants (4048 men and 4338 women), while Junín has a population of 12,088 inhabitants (5593 men and 6495 women). The study was approved by the ethics committee of Universidad Peruana Cayetano Heredia.
Simple random sampling was used. Sample size was estimated by assuming the hypothesis that the higher the hemoglobin concentrations in altitude, the greater would be the levels of serum lipids and blood glucose. The results of a prior study comparing populations living at different altitudes were used to estimate sample size.12 The sample size formula for two means was used: No.=2*[Zα/2+Zβ)2*S2]/e2, where Zα/2=95%=1.96 and Zβ=20%=0.84 (S=standard deviation, and e=value of the difference [2mg/dL] between the groups to be detected). Data for sample estimation were taken from a prior study which compared three altitudes.12 Triglycerides were the variable that required the greatest sample size. Assuming that the first quartile of hemoglobin was similar to the low-altitude population (Hb value), cholesterol, HDL cholesterol, LDL (low density lipoprotein) cholesterol, triglyceride, and blood glucose data were used. The minimum sample size required for the study using triglycerides as a primary variable was 157 subjects of each sex. Women have double the rate of low HDL as compared to men,12 and the number of women was therefore doubled. The final sample to meet these requirements consisted of 158 men and 348 women aged 35–75 years, born in these high-altitude areas and living there for at least 10 years.
Recruitment of study subjectsThe sampling framework was based on all the housing blocks of the area. Blocks and domiciles (sampling units) were randomly and systematically selected (k, k+3, etc.). If the interview could not be performed at the selected domicile because it was vacant or no adult was found, the next selected domicile was visited. Domiciles with two or more families were considered as a single family, and the man or woman found there at the time of the study was interviewed. Whenever possible, a man and/or a woman aged 35–75 years was evaluated in each domicile. The subjects selected were invited to participate in the research, and all who volunteered signed an informed consent.
Each volunteer answered a questionnaire consisting of predefined questions about sociodemographic characteristics. The data collected included place of birth, time living in the area, age, educational level, occupation, height, weight, smoking, and alcohol consumption.
Blood glucose measurementA 15mL venous blood sample was taken from each subject after fasting for at least 12h. The sample was taken between 07:00 and 09:00h. Hemoglobin was measured using a portable HemoCue system (HemoCue Hb 201 analyzer, HemoCue, Angelholm, Sweden). This test had already been successfully used for populations at altitudes over 4000m. In addition, a correlation coefficient of 0.999 had been found between hemoglobin measurement using HemoCue and hematocrit measurement by the microhematocrit method in a male population from Cerro del Pasco, located at an altitude of 4340m and close to our study area.14
With the patient under fasting conditions, a capillary puncture was performed in a finger of the left hand and a drop of blood was placed on the reactive strip attached to an Accu-Chek glucometer (Roche, USA). This method is based on the activity of the enzyme glucose oxidase. Values ≤126mg/dL were considered normal. Glucose levels found with this glucometer at moderate altitudes were no different from those seen with the reference method at the laboratory.15 Glucose measurement in capillary blood has been shown to be as efficient as measurements in whole blood or plasma.16 Capillary blood glucose levels tend to be 8% higher than plasma levels,17 which should be taken into account when different studies are compared.
The remaining blood sample was centrifuged at 3000rpm and serum was stored at −20°C until processed.
Cholesterol and triglyceridesTotal and HDL cholesterol and triglyceride levels were measured in serum using a dry slide procedure or solid phase chemical technology (Vitros 250; Johnson & Johnson, Clinical Diagnostics). LDL cholesterol was calculated using the Friedewald equation. When triglyceride levels were higher than 400mg/dL, the test method to measure LDL cholesterol levels was used. Very low density lipoprotein (VLDL) cholesterol was defined as serum triglyceride levels/5. Non-HDL cholesterol was defined as total cholesterol level minus HDL cholesterol level.18
Normal and abnormal ranges were defined using ATP III (Adult Treatment Panel III) guidelines.18 For total cholesterol, levels <200mg/dL were considered as desirable, 200–239mg/dL as borderline high levels, and ≥240mg/dL as high levels (hypercholesterolemia). The rate of total cholesterol ≥200mg/dL was calculated in this study. As regards LDL cholesterol, levels <100mg/dL were considered optimum, while values of 100–129mg/dL were considered close to optimum, and levels of 130–159mg/dL were the upper limit. Levels ranging from 160–189mg/dL were rated as high, and LDL cholesterol levels ≥190mg/dL were rated as very high. The rate of LDL cholesterol ≥160mg/dL was calculated in this study. According to ATP III guidelines, HDL cholesterol levels >40mg/dL are considered to be low, while values ≥60mg/dL are considered high. Triglyceride levels <150mg/dL were considered normal. The rate of hypertriglyceridemia (triglyceride levels ≥150mg/dL) was calculated.
Blood pressureBlood pressure was measured using a sphygmomanometer (APLK2, Tokyo, Japan). Measurements were taken in the left arm with the patients sitting. A systolic blood pressure (SBP) <140mmHg and a diastolic blood pressure (DBP) <90mmHg were considered normal values.19
Abdominal circumferenceAbdominal circumference was measured using a metric tape (Butterfly BRAND, China). Measurements were made with no shirt or blouse covering the abdomen, and any belt worn was loosened. The metric tape was placed exactly at umbilical level, and the measurement was taken while the subject was breathing out. Abdominal circumference was used as a marker of visceral obesity.20
Body mass indexWeight and height were measured with the subjects wearing light clothes, using a calibrated scale with stadiometer (SOES, Peru). Data collected were used to calculate BMI as weight in kilograms/squared height in meters. Based on the results, subjects were classified as thin (BMI <18.5kg/m2), normal weight (BMI ≥18.5 to <25kg/m2), overweight (BMI ≥25 to <30kg/m2), and obese (BMI ≥30kg/m2).
Arterial oxygen saturationArterial oxygen saturation was measured in the second finger of the left hand using a pulse oximeter (Nellcor N-20, Pleasanton, USA). This device also provided the heart rate. Results were given as percent saturation (%). All the measurements were taken in the laboratory setting.
Statistical analysisData were entered into an Excel database and processed using software STATA version 10 (Stata, College Station, USA). Data are given as mean±standard deviation and as rates or prevalence. A Student's t test was used to compare the means of variables assessed between men and women. A homogeneity of variance test (Bartlett's test) was previously performed; if the variable was not normally distributed, it was transformed. As a reference, lipid profile results in high-altitude men and women were compared to those reported in the CARMELA study for a population living at sea level (in Lima, Peru).21 A Chi-square test was used to compare rates. Hemoglobin was correlated to each lipid parameter and to blood glucose levels in both men and women. Multiple regression analyses were also performed to find factors associated with levels of cholesterol and its fractions, triglycerides, and glucose. Since BMI is a variable that is also associated with blood glucose and lipid profile, the effect of BMI was controlled in the analysis. A value of p<0.05 was considered statistically significant.
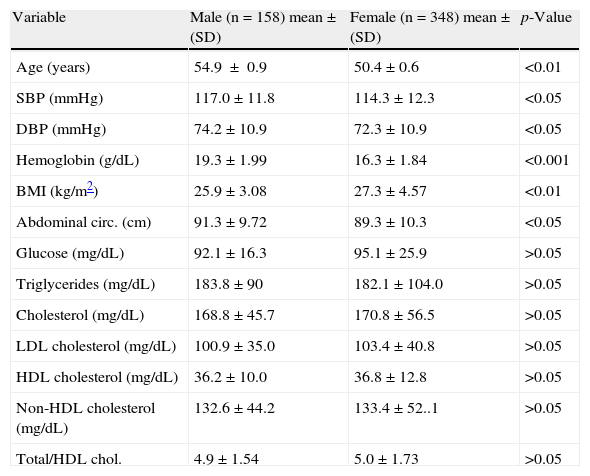
ResultsTable 1 shows the characteristics of the study population. Values of age, SBP, DBP, hemoglobin, weight, height, and abdominal circumference were higher in men as compared to women. BMI was significantly greater in women as compared to men (p<0.01). No differences due to sex were seen in arterial oxygen saturation (p<0.05) and heart rate. Blood glucose and lipid levels in the province of Junín were similar in both sexes (p<0.05). Mean triglyceride levels in men and women exceeded the normal cut-off value (150mg/dL). Mean HDL cholesterol levels were lower in both sexes than the normal cut-off value (40mg/dL). The proportion of smokers was 6.72%.
Characteristics by sex of the study population from Carhuamayo and Junín (4100m), in the central Peruvian Andes.
| Variable | Male (n=158) mean±(SD) | Female (n=348) mean±(SD) | p-Value |
| Age (years) | 54.9±0.9 | 50.4±0.6 | <0.01 |
| SBP (mmHg) | 117.0±11.8 | 114.3±12.3 | <0.05 |
| DBP (mmHg) | 74.2±10.9 | 72.3±10.9 | <0.05 |
| Hemoglobin (g/dL) | 19.3±1.99 | 16.3±1.84 | <0.001 |
| BMI (kg/m2) | 25.9±3.08 | 27.3±4.57 | <0.01 |
| Abdominal circ. (cm) | 91.3±9.72 | 89.3±10.3 | <0.05 |
| Glucose (mg/dL) | 92.1±16.3 | 95.1±25.9 | >0.05 |
| Triglycerides (mg/dL) | 183.8±90 | 182.1±104.0 | >0.05 |
| Cholesterol (mg/dL) | 168.8±45.7 | 170.8±56.5 | >0.05 |
| LDL cholesterol (mg/dL) | 100.9±35.0 | 103.4±40.8 | >0.05 |
| HDL cholesterol (mg/dL) | 36.2±10.0 | 36.8±12.8 | >0.05 |
| Non-HDL cholesterol (mg/dL) | 132.6±44.2 | 133.4±52..1 | >0.05 |
| Total/HDL chol. | 4.9±1.54 | 5.0±1.73 | >0.05 |
Data are given as mean±standard deviation (SD). Chol.: cholesterol; HDL: high density lipoprotein; BMI: body mass index; LDL: low density lipoprotein; abdominal circ.: abdominal circumference; DBP: diastolic blood pressure; SBP: systolic blood pressure.
As compared to data collected at sea level21, high-altitude men had higher levels of triglycerides, non-HDL cholesterol, and HDL cholesterol, while women had higher levels of total, LDL, and HDL cholesterol.
As compared to data from a Peruvian population of 1652 subjects living at sea level reported in the multicenter CARMELA study,21 total, LDL, and non-HDL cholesterol levels were lower in both sexes at high altitude as compared to sea level. By contrast, triglyceride levels were higher at high altitude in both sexes. HDL cholesterol levels did not differ between men living in Lima and at high altitude (p<0.05), while they were lower in high-altitude women (p<0.01). In high-altitude subjects, HDL cholesterol levels were lower in men and higher in women (p<0.05). Lower HDL cholesterol levels in high-altitude women were inversely related to BMI (r=−0.12; p<0.05). The lower HDL cholesterol levels in high-altitude women were associated with higher BMIs. In fact, HDL cholesterol levels were lower in overweight women (BMI >25kg/m2) than in those with normal BMI. Overweight women also had higher levels of LDL cholesterol, triglycerides, and non-HDL cholesterol (p<0.05) (data not shown).
A direct correlation was found between chronological age, BMI, abdominal circumference, systolic blood pressure, diastolic blood pressure and hemoglobin, and total cholesterol. Total cholesterol was not found to be associated with sex (male or female), smoking or alcohol consumption, education, and capillary blood glucose level (p>0.05) (data not shown).
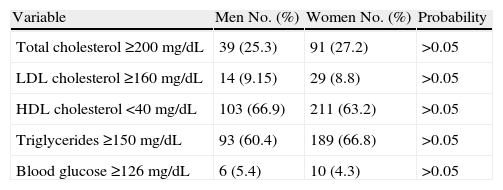
Table 2 reports the subjects with high levels of total and HDL cholesterol, serum triglycerides, and capillary blood glucose and low HDL cholesterol levels. There were no significant differences due to sex in any of these variables.
Distribution of men and women from Carhuamayo and Junín by high levels of total cholesterol (≥200mg/dL), LDL cholesterol (≥160mg/dL), triglycerides (≥150mg/dL) and blood glucose (≥126mg/dL) and low HDL cholesterol levels (<40mg/dL).
| Variable | Men No. (%) | Women No. (%) | Probability |
| Total cholesterol ≥200mg/dL | 39 (25.3) | 91 (27.2) | >0.05 |
| LDL cholesterol ≥160mg/dL | 14 (9.15) | 29 (8.8) | >0.05 |
| HDL cholesterol <40mg/dL | 103 (66.9) | 211 (63.2) | >0.05 |
| Triglycerides ≥150mg/dL | 93 (60.4) | 189 (66.8) | >0.05 |
| Blood glucose ≥126mg/dL | 6 (5.4) | 10 (4.3) | >0.05 |
HDL: high density lipoprotein; LDL: low density lipoprotein; No.: number of subjects with the characteristic evaluated. Percent value is given in brackets (%).
Chi-square test p>0.05 between men and women for each variable tested.
Cholesterol levels ≥200mg/dL were found in 26.6% of subjects, LDL cholesterol levels ≥160mg/dL in 9%, HDL levels <40mg/dL in 64.3%, triglyceride levels ≥150mg/dL in 67.9%, and blood glucose levels ≥126mg/dL in 4.6% of subjects.
Since high hemoglobin values are a characteristic of natives not adapted to altitude, the correlation of hemoglobin with each component of the lipid profile and with blood glucose was analyzed before the multivariate analysis was performed. High total, VLDL, LDL, and non-HDL cholesterol levels were associated with high hemoglobin values. HDL cholesterol, total/HDL cholesterol ratio, and blood glucose levels were not correlated to hemoglobin values (p>0.05).
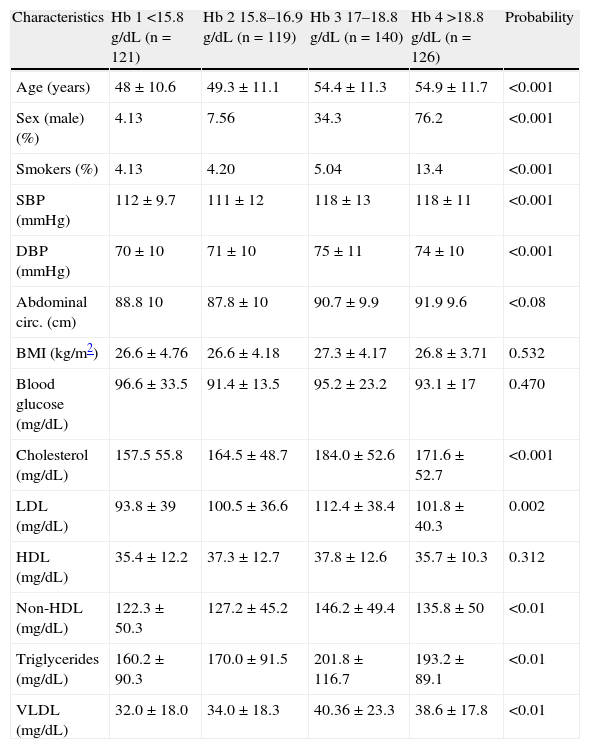
Table 3 shows the different variables assessed as a function of the quartile of hemoglobin value in the high-altitude population. A significant association was found between higher hemoglobin quartiles (third and fourth hemoglobin quartiles) and older chronological age, a higher proportion of males, a higher proportion of smokers, higher systolic and diastolic blood pressure, and higher levels of total, LDL, non-HDL, and VLDL cholesterol and triglycerides.
Characteristics by sex of the study population from Carhuamayo and Junín (4100m) depending on hemoglobin quartiles.
| Characteristics | Hb 1 <15.8g/dL (n=121) | Hb 2 15.8–16.9g/dL (n=119) | Hb 3 17–18.8g/dL (n=140) | Hb 4 >18.8g/dL (n=126) | Probability |
| Age (years) | 48±10.6 | 49.3±11.1 | 54.4±11.3 | 54.9±11.7 | <0.001 |
| Sex (male) (%) | 4.13 | 7.56 | 34.3 | 76.2 | <0.001 |
| Smokers (%) | 4.13 | 4.20 | 5.04 | 13.4 | <0.001 |
| SBP (mmHg) | 112±9.7 | 111±12 | 118±13 | 118±11 | <0.001 |
| DBP (mmHg) | 70±10 | 71±10 | 75±11 | 74±10 | <0.001 |
| Abdominal circ. (cm) | 88.8 10 | 87.8±10 | 90.7±9.9 | 91.9 9.6 | <0.08 |
| BMI (kg/m2) | 26.6±4.76 | 26.6±4.18 | 27.3±4.17 | 26.8±3.71 | 0.532 |
| Blood glucose (mg/dL) | 96.6±33.5 | 91.4±13.5 | 95.2±23.2 | 93.1±17 | 0.470 |
| Cholesterol (mg/dL) | 157.5 55.8 | 164.5±48.7 | 184.0±52.6 | 171.6±52.7 | <0.001 |
| LDL (mg/dL) | 93.8±39 | 100.5±36.6 | 112.4±38.4 | 101.8±40.3 | 0.002 |
| HDL (mg/dL) | 35.4±12.2 | 37.3±12.7 | 37.8±12.6 | 35.7±10.3 | 0.312 |
| Non-HDL (mg/dL) | 122.3±50.3 | 127.2±45.2 | 146.2±49.4 | 135.8±50 | <0.01 |
| Triglycerides (mg/dL) | 160.2±90.3 | 170.0±91.5 | 201.8±116.7 | 193.2±89.1 | <0.01 |
| VLDL (mg/dL) | 32.0±18.0 | 34.0±18.3 | 40.36±23.3 | 38.6±17.8 | <0.01 |
Hb: hemoglobin; HDL: high density lipoprotein; BMI: body mass index; LDL: low density lipoprotein; Non-HDL: non-high density lipoprotein; Abdominal circ.: abdominal circumference; DBP: diastolic blood pressure; SBP: systolic blood pressure: p value: statistical significance in the analysis of variance (ANOVA).
Hemoglobin values are distributed into quartiles.
Values of triglycerides, blood glucose, and VLDL were transformed.
Age, SBP, DBP, p<0.001 between Hb1 vs Hb3; Hb1 vs Hb4.
Abdominal circ. p<0.01 Hb2 vs Hb4.
Cholesterol, LDL, triglycerides, VLDL, p<0.01 in Hb1 vs Hb3.
Non-HDL p<0.01 in Hb1 vs Hb3, and in Hb2 vs Hb3.
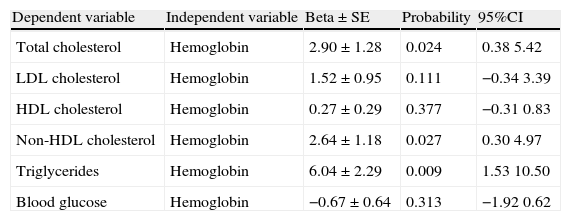
Table 4 shows the results of six multivariate analysis models which related hemoglobin to serum levels of cholesterol (model 1), LDL cholesterol (model 2), HDL cholesterol (model 3), non-HDL cholesterol (model 4), to triglycerides (model 5) and to blood glucose (model 6) after the adjustment of each model for educational level, age, sex, BMI, and smoking. Hemoglobin levels were directly associated with total cholesterol, non-HDL cholesterol, and triglyceride levels. Hemoglobin was not associated with blood glucose in the multivariate analysis. To sum up, hemoglobin levels were directly associated with total cholesterol, non-HDL cholesterol, and triglyceride levels.
Multiple regression analysis to assess the association of hemoglobin and body mass index values (independent variables) with levels of total cholesterol (mg/dL), LDL cholesterol (mg/dL), HDL cholesterol (mg/dL), non-HDL cholesterol (mg/dL), triglycerides (mg/dL), and blood glucose (mg/dL) in men and women from Junín and Carhuamayo in the central Peruvian Andes.
| Dependent variable | Independent variable | Beta±SE | Probability | 95%CI |
| Total cholesterol | Hemoglobin | 2.90±1.28 | 0.024 | 0.38 5.42 |
| LDL cholesterol | Hemoglobin | 1.52±0.95 | 0.111 | −0.34 3.39 |
| HDL cholesterol | Hemoglobin | 0.27±0.29 | 0.377 | −0.31 0.83 |
| Non-HDL cholesterol | Hemoglobin | 2.64±1.18 | 0.027 | 0.30 4.97 |
| Triglycerides | Hemoglobin | 6.04±2.29 | 0.009 | 1.53 10.50 |
| Blood glucose | Hemoglobin | −0.67±0.64 | 0.313 | −1.92 0.62 |
Beta: regression coefficient; SE: standard error; HDL: high density lipoprotein; CI: confidence interval; BMI: body mass index; LDL: low density lipoprotein. Each line in the table represents a multiple regression model where age, sex, BMI, and education have been controlled. Total cholesterol, LDL cholesterol, HDL cholesterol, non-HDL cholesterol, and triglycerides represent the dependent variables in each model. The independent variables, hemoglobin and BMI, are continuous variables.
Neither the lipid profile variables nor the blood glucose levels, were associated with systolic blood pressure (p>0.05) (data not shown). Age and BMI were found to be significantly associated with systolic blood pressure (p=0.0001).
To sum up, HDL, and non-HDL cholesterol levels were significantly and directly associated with diastolic blood pressure (p<0.05) (data not shown). Blood glucose levels, but not VLDL or triglyceride levels, were directly associated with diastolic blood pressure (data not shown).
DiscussionStudy results show that higher hemoglobin levels, seen in subjects less adapted to altitude,2,3,13,14 are associated with higher serum total and non-HDL cholesterol and triglyceride levels. This has been shown by controlling confounding variables such as BMI, a marker of anthropometric nutritional status. This would suggest that hypoxemia itself has an impact on lipid profile, particularly on the non-HDL fraction, as opposed to suggestions by other authors that hypercholesterolemia could not be related to altitude hypoxemia.12,22
Smoking also causes hypoxemia, which may in turn increase hemoglobin concentration.23 This study has indeed shown that higher hemoglobin quartiles are associated with a greater percentage of smokers, and smoking at altitude should therefore be contraindicated, particularly in people with higher hemoglobin levels.
In Junín, at an altitude of 4100m, data were seen showing that the lipid pattern (total, LDL, and non-HDL cholesterol) was different at altitude as compared to data at sea levels collected in the CARMELA study.21 However, triglyceride levels would appear to be higher, and HDL cholesterol levels similar or lower, than at sea level. This is in contrast to prior studies showing that HDL cholesterol levels are higher at altitude than at sea level6. It should be noted that HDL cholesterol levels in Junín are similar in men and women, despite the fact that such levels are known to be higher in women at sea level.21 This may be due to the fact that BMI was significantly greater in women from Junín as compared to men, which is unusual in other populations. To demonstrate these differences, populations at altitude and at sea level will have to be analyzed in the same time framework and using the same methods.
A review of the literature shows that high rates of low HDL cholesterol are more commonly seen at high altitude.8,10,24 This study showed no association between the highest hemoglobin quartile and HDL cholesterol levels, which rules out the hypothesis that high-altitude hypoxia promotes higher HDL levels. Our study rather shows that the greater the BMI, the lower the HDL cholesterol levels. This means that the lower HDL cholesterol levels seen in populations living at high altitude in Carhuamayo/Junín would be due to the effect of weight, measured as BMI, rather than to the effect of hypoxemia. This supports prior findings at high altitude8,25 and at sea level.26 One may also wonder whether race has some influence on the differences. In the CARMELA study on dyslipidemia in Latin America, the population from Lima (Peru), living at sea level, had lower HDL cholesterol levels as compared to the other six cities studied.21
The high-altitude population analyzed in Peru shows a unique dyslipidemia pattern in which the high frequency of HDL levels <40mg/dL is associated with low rates of LDL levels ≥160mg/dL and high triglyceride levels. Medina et al.27 also found a high prevalence of hypertriglyceridemia and a low proportion of subjects with LDL cholesterol levels ≥160mg/dL. The finding of a high frequency of elevated triglyceride levels in different altitude populations both in Peru and the Himalayas8–10 and in seven high-altitude cities of Latin America (Bogotá, 23.2%; Quito, 23,8%; Mexico DF, 32.5%), as compared to 9.8% in Buenos Aires and 19.5% in Lima,21 suggests that high triglyceride levels appear to be a characteristic of people living at high altitude areas.
This is an important study because it shows that the higher the hemoglobin concentration, the higher the lipid levels. An association of hemoglobin with cholesterol levels is also found in sea-level populations.28 As regards the mechanisms of action of hemoglobin, microcirculation is known to be regulated by oxygen gradients and endothelial release of nitric oxide, which may react with hemoglobin to form S-nitroso derivatives. Hemoglobin is inversely related to nitric oxide, and is its main transporter and buffer.29 Endothelial function is also inversely associated with hemoglobin values in diabetes mellitus.30 Hemoglobin, which is related to iron metabolism, is an extremely active oxidant, and methemoglobin exerts its oxidative activity on LDL through the transfer of heme, which acts as a vehicle for iron insertion into LDL.31 Similarly, hemoglobin is a determinant factor in levels of CD40L, a pro-inflammatory cytokine.32 Subjects with high hemoglobin concentrations show low HDL cholesterol levels and high values of systolic and diastolic blood pressure associated with high CD40L levels.32
When compared to mean sea-level values of 188.4mg/dL for total cholesterol, 121.5mg/dL for LDL cholesterol, 49.2mg/dL for HDL cholesterol, and 140.3mg/dL for triglycerides,21 the present results show that while total and LDL cholesterol levels are lower at high altitude as compared to sea level, HDL and triglyceride levels have experienced a substantial change, so that HDL levels are currently lower and triglyceride levels higher at high altitude than at sea level.
Since higher hemoglobin values are associated with greater changes in lipid levels in blood, the data suggest that the populations less adapted to altitude, and thus with higher hemoglobin values, are more prone to diastolic hypertension.
In conclusion, in the populations from the central Andes, the non-HDL cholesterol–cholesterol fraction and triglycerides are directly associated with hemoglobin levels, and thus to the degree of hypoxemia, and increases in these are in turn associated with higher diastolic blood pressure. The high prevalence of dyslipidemia in people living at 4100m, requiring an increased need for the adoption of public health measures, should be stressed.
FundingThe work is funded from NIH research Grant # 5-D43TW005746-04 from the Fogarty International Center, the National Institutes for Environmental Health Services, the National Institute for Occupational Safety and Health and the Agency for Toxic Substances and the Disease Registry.
Conflicts of interestThe authors state that they have no conflicts of interest.
We thank the generous support received from Manuel Gasco, Ana Lucía Chirinos, Narda Malpartida, Carmen Maldonado, Jessica Nieto, Ana Huambachano, and the staff from the primary care centers and hospitals during the different visits to Carhuamayo and Junín.
Please cite this article as: Gonzales GF, Tapia V. Asociación de los diferentes niveles de hipoxemia en la altura con el perfil lipídico y la glucemia en varones y mujeres a 4.100 m de altitud en los Andes Centrales del Perú. Endocrinol Nutr. 2013;60:79–86.