


Diffusion weighted imaging (DWI) in magnetic resonance imaging (MRI) is currently an important tool for detecting and characterising hepatic lesions, as well as for monitoring and evaluating the response to the treatment of the tumour disease. The use of this technique is also being assessed for the study of diffuse liver disease.
Among the additional advantages of DWI-MRI, is the absence of emission of ionising radiation and not having to use paramagnetic contrasts, which means it can be used in the study of patients with renal failure. Another advantage is the short duration of the diffusion sequence, which means that the examination time in abdominal MRI is scarcely increased.
Therefore, it is important that the physician is aware of this diagnostic technique, since DWI is a sequence that should be routinely included in the liver MRI study protocol.
Actualmente la imagen potenciada en difusión (DWI diffusion weighted image) en resonancia magnética (RM) constituye una importante herramienta para la detección y caracterización de lesiones hepáticas, así como para la monitorización y evaluación de la respuesta al tratamiento de la patología tumoral. Por otro lado se está estudiando también la utilidad de esta técnica para el estudio de la patología hepática difusa.
Entre las ventajas adicionales de la DWI-RM, destaca la ausencia de emisión de radiaciones ionizantes y la ausencia de necesidad de utilizar contraste paramagnético, por lo que se puede realizar el estudio en pacientes con insuficiencia renal. Otra ventaja es la corta duración de la secuencia de difusión por lo que apenas incrementa el tiempo de exploración de la RM abdominal.
Por lo tanto, es importante que el médico conozca esta técnica diagnóstica, ya que la DWI es una secuencia que debería ser incluida de forma rutinaria en el protocolo de estudio de la RM hepática.
Diffusion-weighted imaging MRI (DW-MRI) is a technique that was originally developed for the diagnosis of acute cerebral infarction. Stejskal and Tanner were the first to apply the diffusion property to MRI sequences in 1965.1 In 1986, Le Bihan et al. developed the first diffusion image in an MRI of the brain2 and Warach et al. were the first to apply this technique to the study of strokes in 1992.3
However, the application of this technique to the study of abdominal disease is relatively recent, because initially it was not possible due to a low signal-to-noise ratio and low spatial resolution of the image. Technical developments including fast sequences with fat suppression have significantly improved the quality of the image.
It should be noted that one of the classic limitations of DWI in the abdomen in the past was image degradation due to respiratory movements, and the possibility of carrying out sequences that are synchronised with breathing has enabled higher quality and higher resolution images to be obtained. In addition, images with cardiac gating can be useful in avoiding cardiac motion artefacts when studying the left hepatic lobe.
These major technological advances in MRI have enabled DW-MRI to be applied to the study of abdominal diseases, particularly for the diagnosis of liver lesions.4
Physical Principles of DiffusionDiffusion is the physical property that traces the random Brownian motion or random motion of water molecules in a tissue, in response to thermal energy.5 The human body composition is 75% water, which is localised in three compartments: the intravascular, intracellular and extracellular compartments. The diffusion sequence is sensitive to the detection of water molecule motion in these compartments at a microscopic level, but it is water molecule motion in the extracellular space which is most relevant in the study of solid tumours.
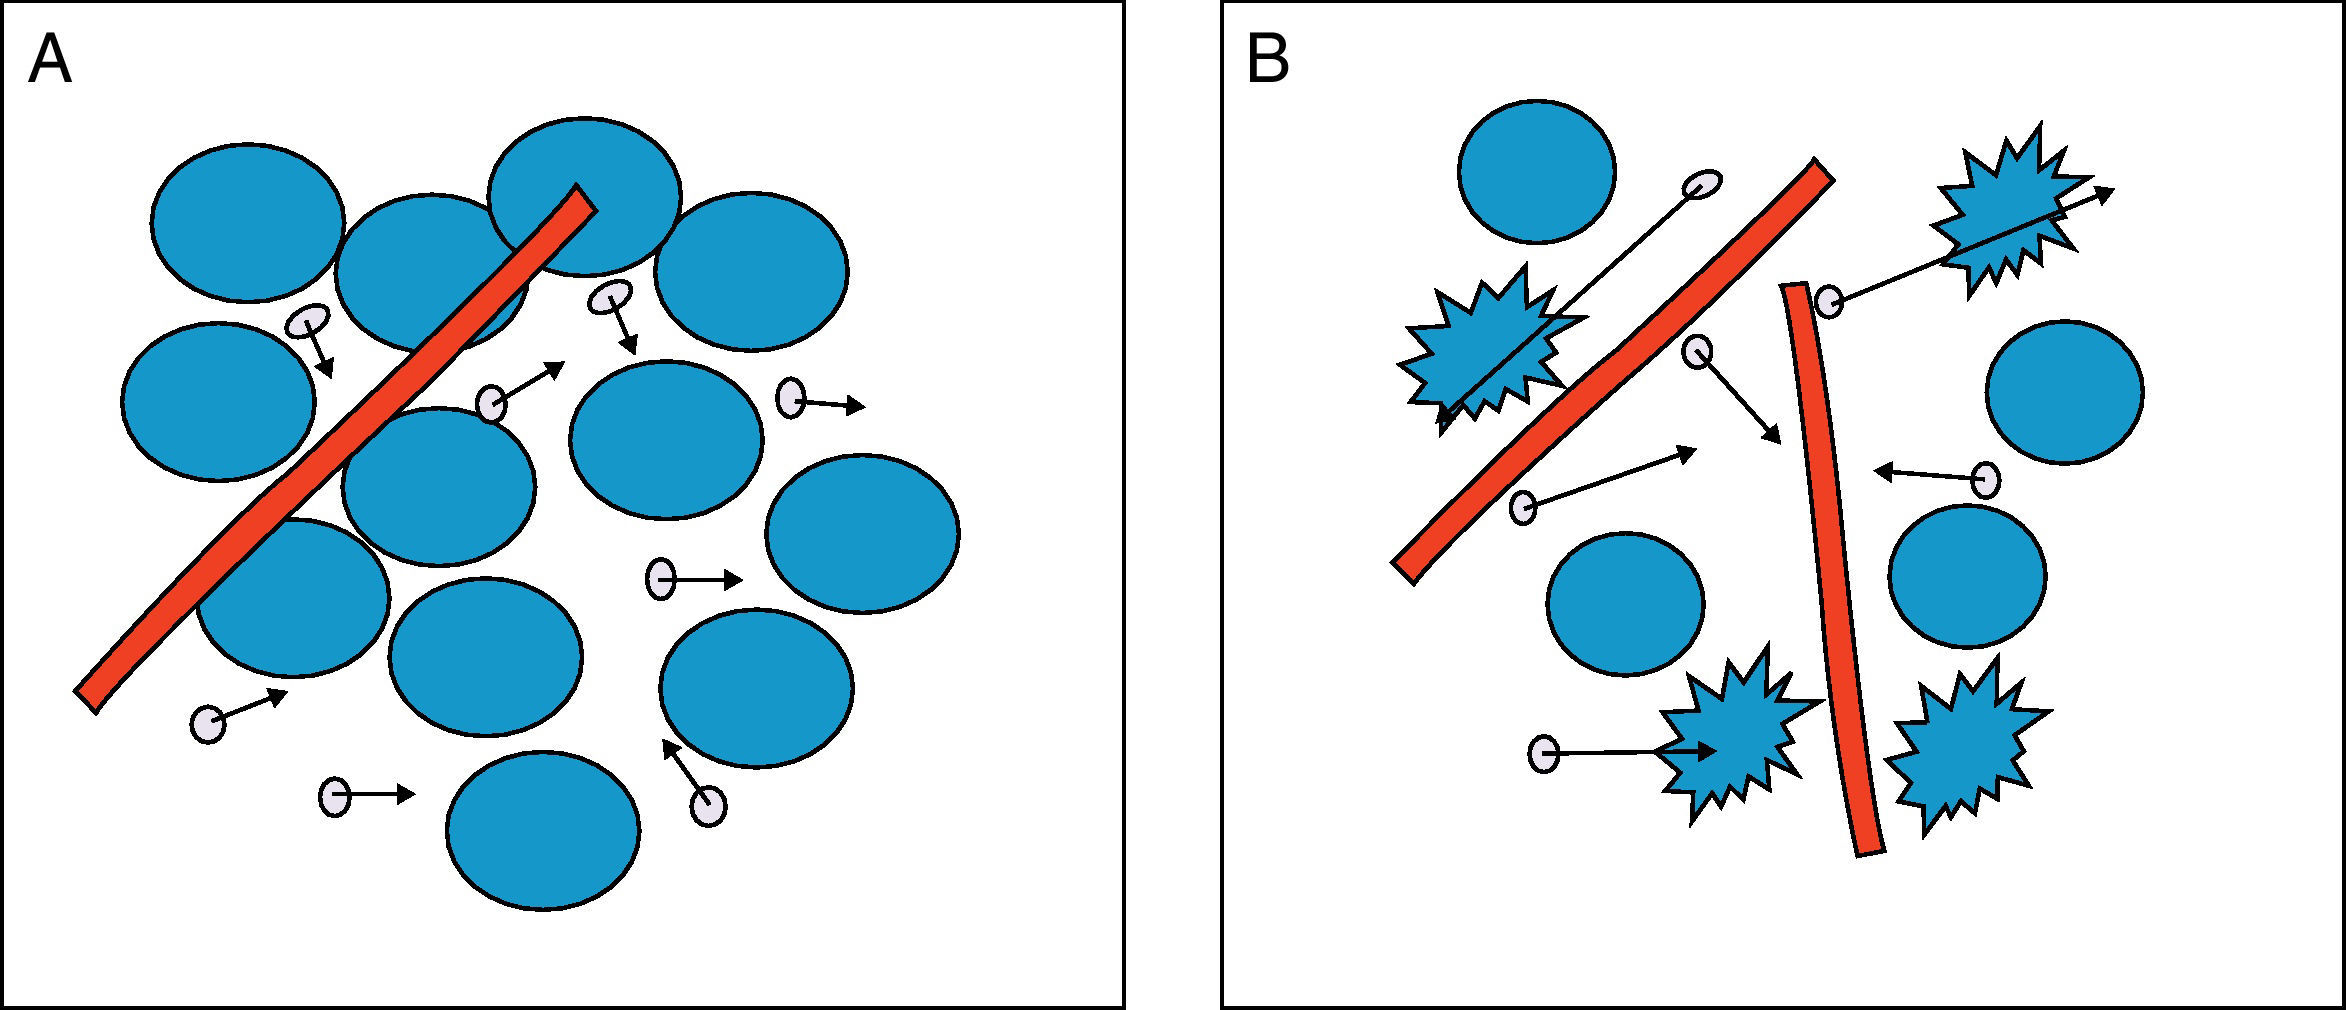
The greater or lesser degree of water molecule motion in the extracellular environment will be primarily dependent on the number of cells (cell density), membrane integrity and tissue viscosity. Therefore, in tissues with low cellularity such as benign tumours, or tissues with ruptured membranes, such as tumours with necrosis, the water molecules move easily, in what is known as free diffusion. This is in contrast with high tissue cellularity, as in malignant tumours, where water molecule motion is limited and diffusion is therefore restricted. Similarly, in the abscesses formed by inflammatory cells, proteins, cell debridement and highly viscous bacteria and pus, diffusion is also restricted, and water molecules bind to amino acids on macromolecule surfaces, restricting motion further. Fig. 1 shows the greater or lesser degree of mobility of water molecules depending on tissue cellularity and membrane integrity.
 Restricted diffusion in the extracellular space due to cellularity and membrane integrity. The water molecules (circles with arrows) show difficulty in mobility. (B) Free diffusion in the extracellular space due to low cellularity and ruptured membranes. Water molecules move freely between cells and pass between cells with ruptured membranes.")
Diffusion of water molecules. (A) Restricted diffusion in the extracellular space due to cellularity and membrane integrity. The water molecules (circles with arrows) show difficulty in mobility. (B) Free diffusion in the extracellular space due to low cellularity and ruptured membranes. Water molecules move freely between cells and pass between cells with ruptured membranes.
The diffusion sequences used are modified T2-weighted sequences, to which a bipolar diffusion gradient is applied. In the DW-MRI, tissue restricting diffusion appears with high intensity signals (hyperintense) and in tissue where diffusion is facilitated, lower intensity signals (hypointense) are observed. That is, the degree of water molecule's mobility is proportional to the degree of signal attenuation. Therefore, with the diffusion sequence, unique information is obtained on tissue cellularity and cell membrane integrity.6
However, the intensity of the signal obtained from the different tissues is not only dependent on water molecule motion, but it also varies on modification of the amplitude, duration or interval of the gradient applied.7 The parameter known as the b-value is proportional to these three factors, especially to the square of the gradient amplitude, and by changing the b-value, diffusion sensitivity also varies and the signal is modified.
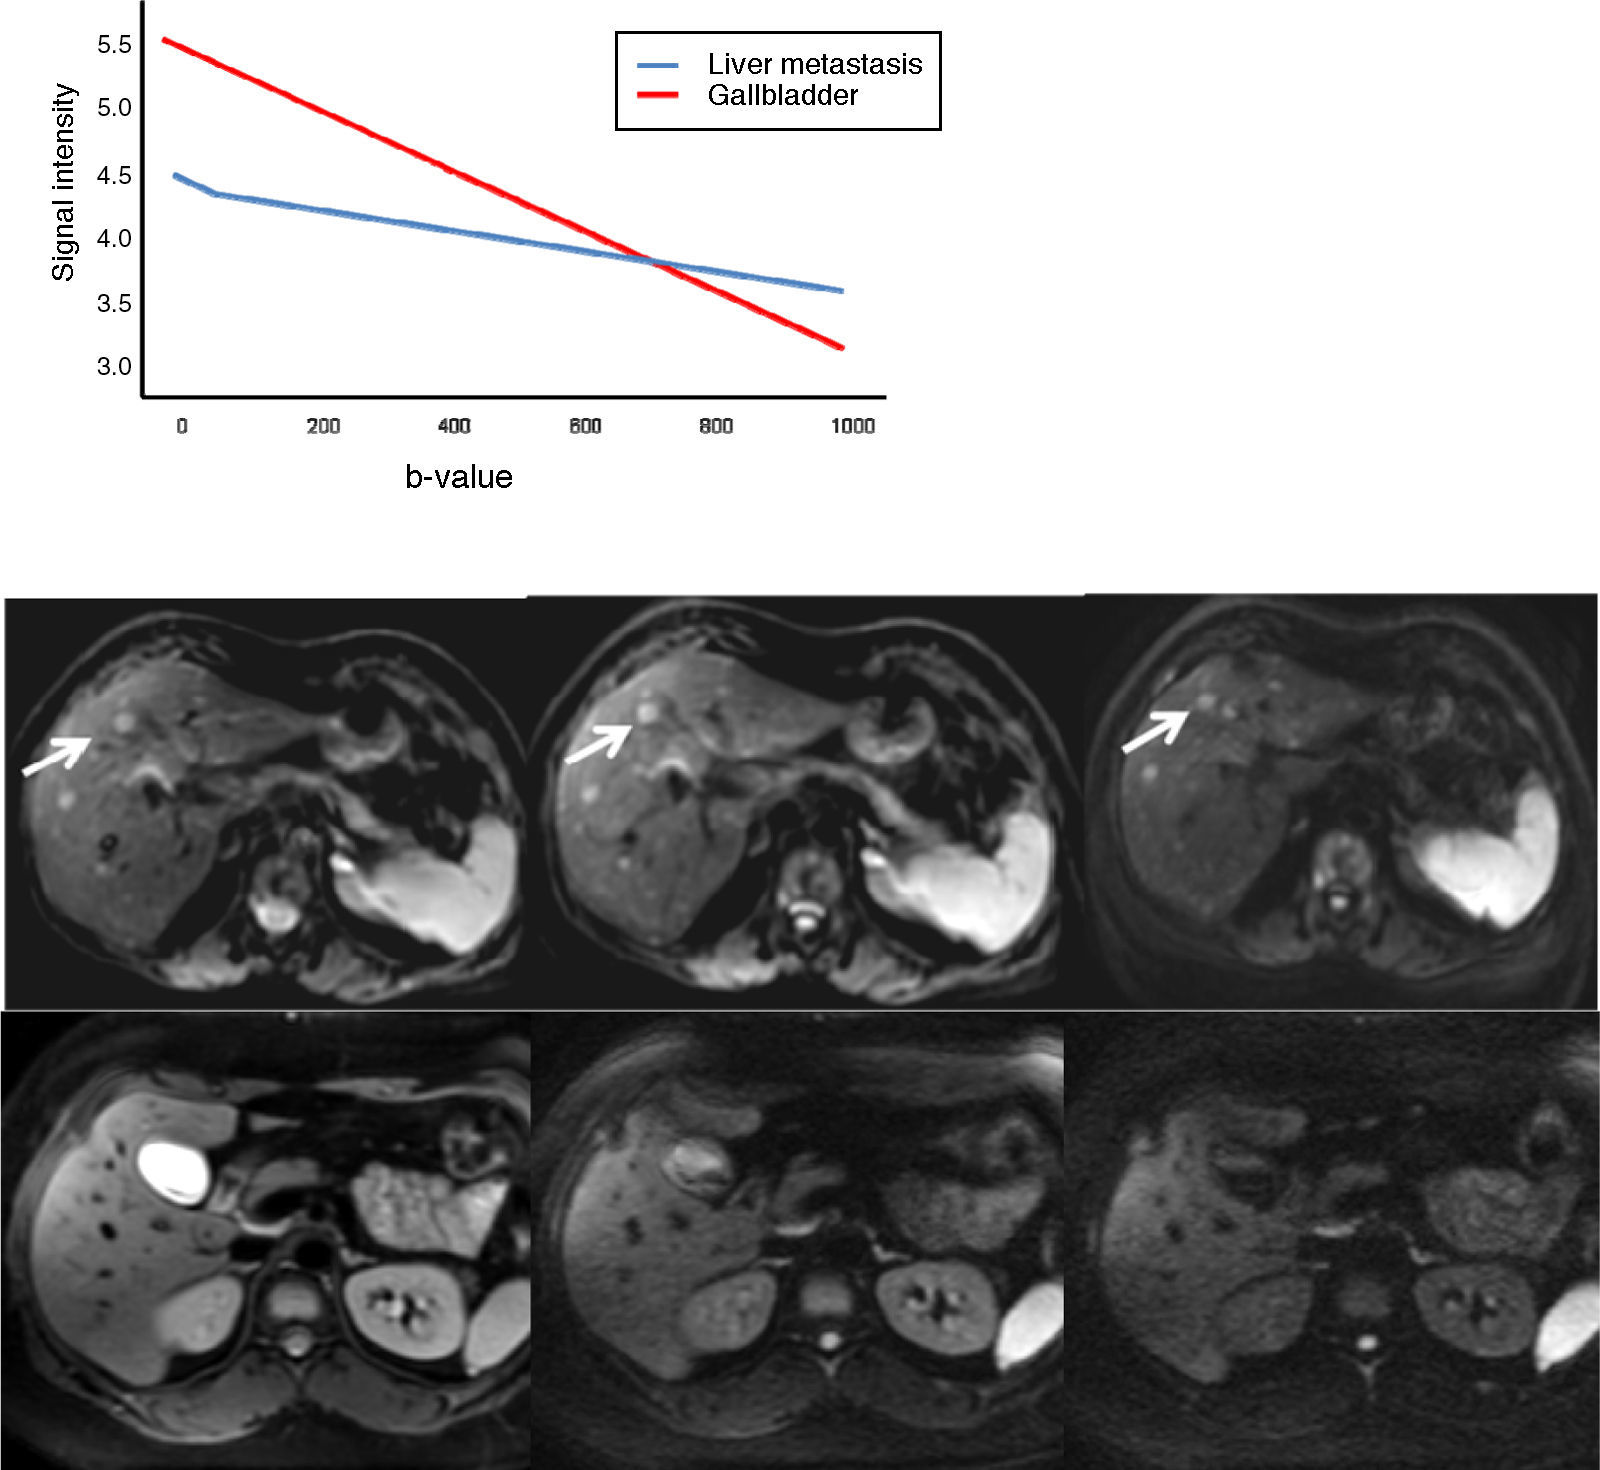
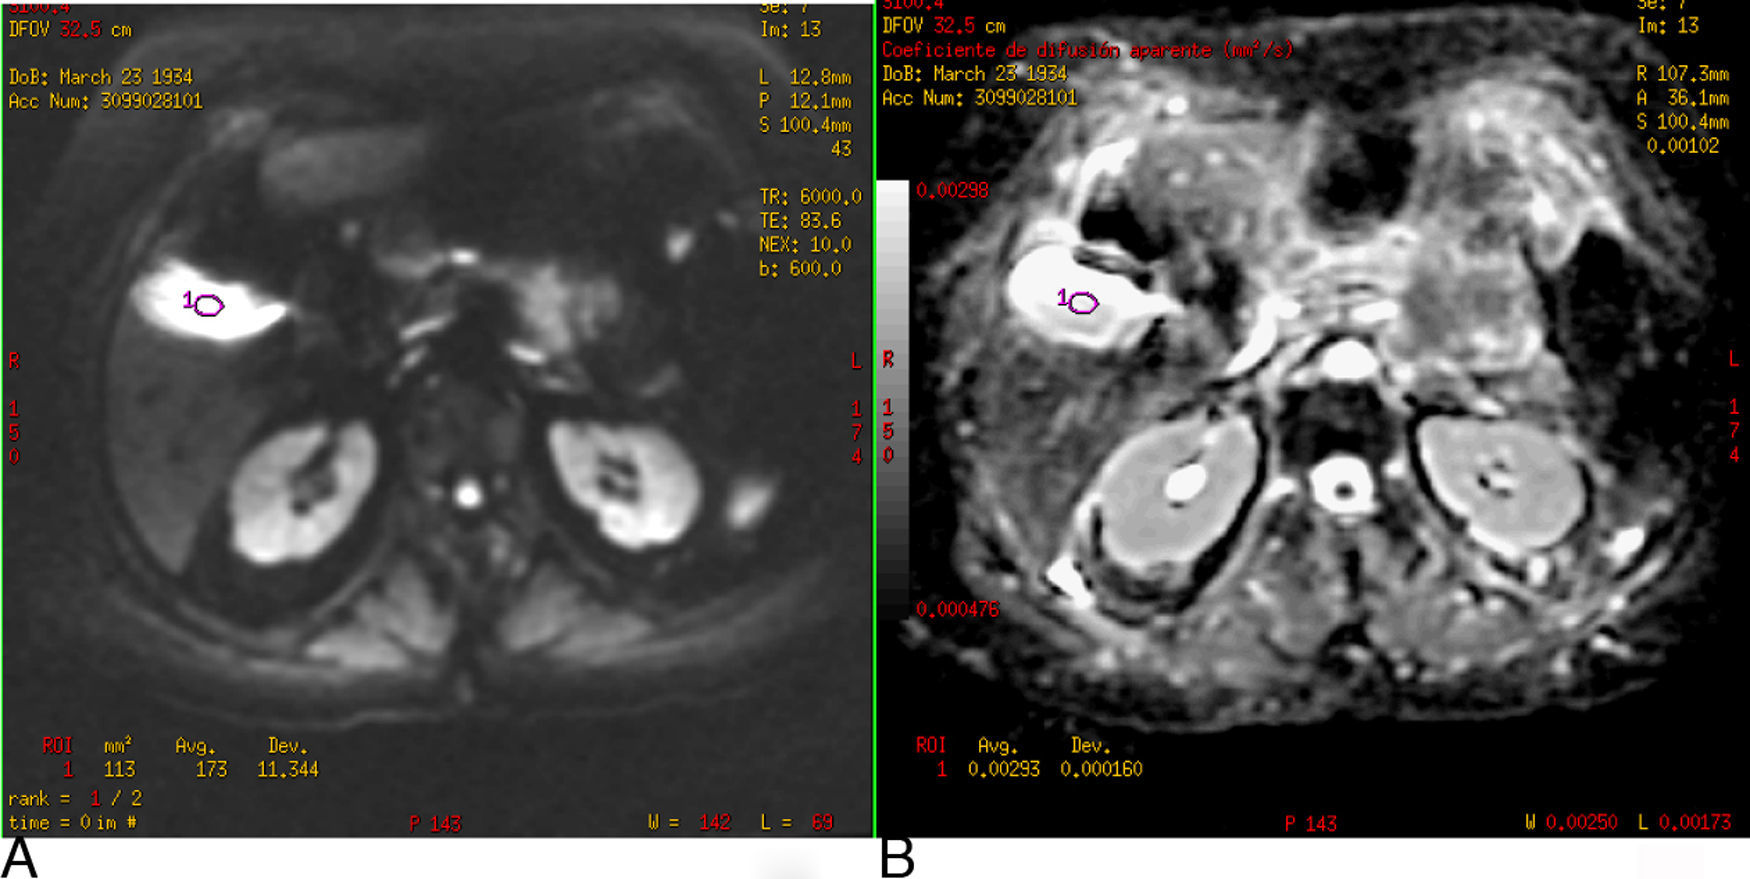
The b-value is measured in s/mm2, and as this value increases, the lesion's signal intensity decreases. This signal loss will be greater in those lesions where diffusion is facilitated, but the lesions that restrict diffusion lose less signal. Fig. 2 represents signal loss in the gall bladder and liver metastasis in several DWI with different b-values, and in the signal loss graph, by increasing b-values, the gall bladder loses a high amount of signal while the metastasis loses little. Therefore, the slope of the gall bladder graph is steep and the metastasis graph is not steep. This slope can be calculated by a mathematical operation to obtain a numerical value known as the apparent diffusion coefficient (ADC).8
. In the bottom images the gallbladder loses much signal in the diffusion images upon increasing the b-values (b=0, b=600, b=1000s/mm2). SI: signal intensity.")
Loss of intensity of a liver metastasis and gallbladder signals upon increasing the b-value. The graph represents this loss of signal intensity. The gallbladder loses a high amount of signal, and the metastasis, little. In the top images, a breast cancer liver metastasis is shown as it loses almost no signal in the diffusion images upon increasing b-values (b=0, b=50, b=600s/mm2). In the bottom images the gallbladder loses much signal in the diffusion images upon increasing the b-values (b=0, b=600, b=1000s/mm2). SI: signal intensity.
The ADC provides a quantitative measure, independent of the magnetic field, which measures microscopic displacement of water molecules in 10−3mm2/s, reflecting the specific diffusion capacity of a tissue. Highly cellular tissues, with restricted diffusion, display low ADC values, because they lose little signal with the increase of the b-value, while areas with lower cell density which lose more signal with an increase in the b-value, have higher ADC values.
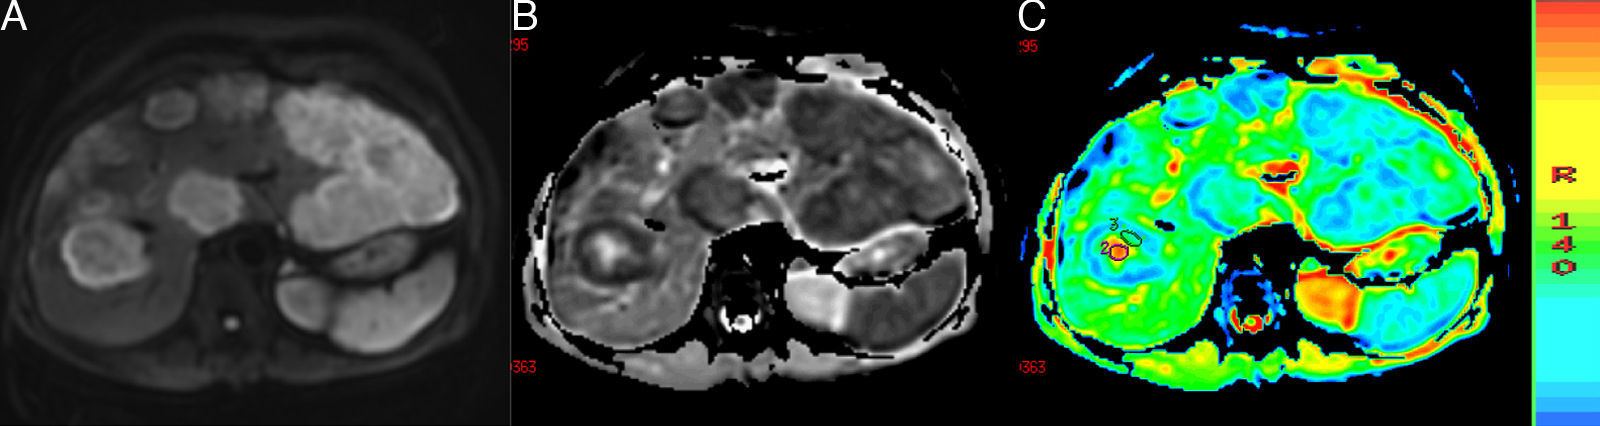
ADC can be calculated for each pixel of the image, and a parametric map (ADC map) can be obtained in black and white or colour, in which the areas that restrict diffusion appear hypointense or blue and those that have free diffusion appear hyperintense or red. It is possible to determine the ADC value of a particular region by selecting a region of interest (ROI). In Fig. 3, we can see a DWI and black and white and colour ADC maps of liver metastasis, where two ROIs were placed in a metastasis, one in the central necrotic area and other in the solid peripheral area.
 Diffusion-weighted image. (B) and (C) ADC maps. Liver metastases of colorectal cancer. One with a necrotic centre is studied, which is hypointense in DWI and hyperintense or red in ADC maps with a value of 2.34×10⁻³mm2/s. The peripheral solid portion restricts diffusion, is hyperintense in DWI and hypointense and blue in ADC maps with a value of 1.09×10⁻³mm2/s.")
(A) Diffusion-weighted image. (B) and (C) ADC maps. Liver metastases of colorectal cancer. One with a necrotic centre is studied, which is hypointense in DWI and hyperintense or red in ADC maps with a value of 2.34×10⁻³mm2/s. The peripheral solid portion restricts diffusion, is hyperintense in DWI and hypointense and blue in ADC maps with a value of 1.09×10⁻³mm2/s.
Therefore, with the DW-MRI, two types of information are obtained, qualitative and quantitative information:
Qualitative InformationImages with individual b-values provide qualitative information on the lesion, based on signal intensity; for example, in solid, hypercellular tumours where diffusion is restricted, the image appears hyperintense; and on the contrary, in lesions where diffusion is free, the image appears hypointense.
Quantitative InformationImages are acquired using two or more b-values, one of which is always 0 and the other less than 1000s/mm2 in order to assess the loss of signal, which is related to diffusion capacity. On the ADC map, we can calculate the diffusion capacity of specific areas of a tissue. If diffusion is restricted, the ADC value is low and if diffusion is facilitated, the ADC value is high.
One problem of qualitative analysis is that the signal observed depends not only on the diffusion of water but also on T2 relaxation time. When b-values are low, the image is more T2-weighted and when high b-values are used, the sequence is more diffusion-weighted. However, lesions with a high liquid component (such as cysts or liquid in the gallbladder) which have a very long T2 relaxation time, may appear hyperintense in diffusion images, even at very high b-value sequences, simulating restricted diffusion. This is what is known as the T2 shine through effect. This paradoxical effect is easily identified by performing an ADC map; the signal is hyperintense, which indicates that diffusion is not restricted. In addition, the ADC value will be high when measured. So the DWI should be interpreted in conjunction with the ADC map.
Fig. 4 shows the gallbladder on DWI with a b-value of 600s/mm2 hyperintense due to the T2 effect; however, it also appears hyperintense on the ADC map and the value of ADC is high (2.9×10⁻³mm2/s).
 Diffusion-weighted image (b: 600s/mm2). (B) ADC map. Gallbladder T2 effect. In the DWI, the gallbladder is hyperintense, not because it restricts diffusion but because it has a long T2 relaxation time. It is verified with the ADC map where it is also hyperintense and the value is 2.9×10⁻³mm2/s.")
(A) Diffusion-weighted image (b: 600s/mm2). (B) ADC map. Gallbladder T2 effect. In the DWI, the gallbladder is hyperintense, not because it restricts diffusion but because it has a long T2 relaxation time. It is verified with the ADC map where it is also hyperintense and the value is 2.9×10⁻³mm2/s.
The main clinical applications of DW-MRI in the liver are the detection and characterisation of focal liver lesions and the monitoring and evaluation of response to treatment in neoplastic diseases. The usefulness of this technique is also being examined for the study of diffuse liver disease.
In the Hospital Quirón de Madrid, this technique has been systematically used in all liver MRIs since the end of 2006. In total, over 3000 liver diffusion studies have been performed and were particularly useful for detecting and characterising lesions and evaluating the response to treatment in malignant tumoural disease.
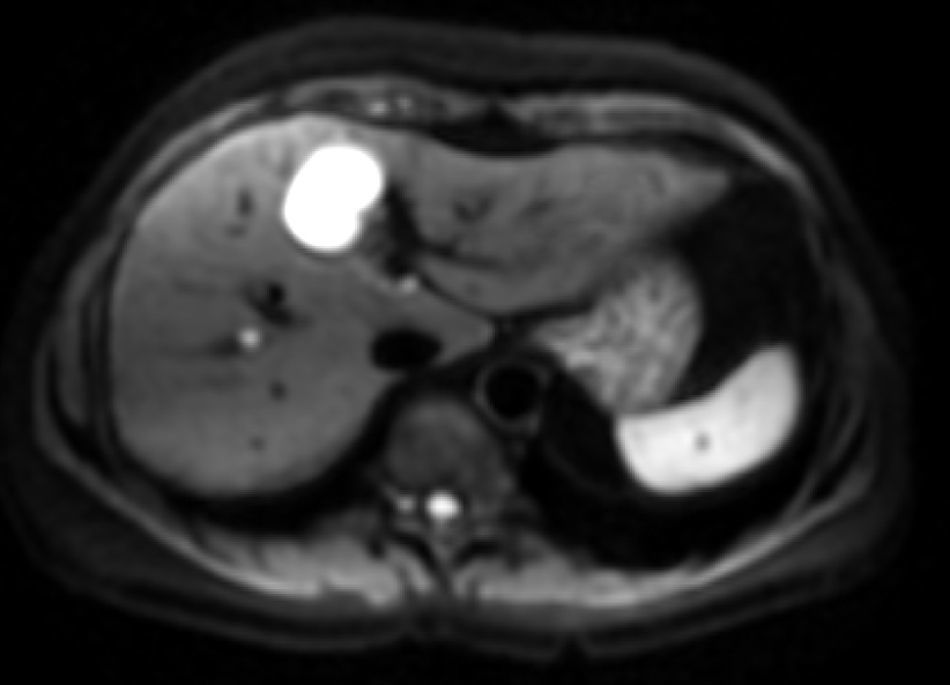
Detection of LesionsOne of the main applications of liver DW-MRI is the detection of lesions. The use of sequences with low b-values (between 50 and 150s/mm2) has several advantages. On the one hand, the lower the b-value, the higher the signal/noise ratio and the better the image resolution. On the other hand, from b-values >50s/mm2, only very small water molecule motion is observed, the high signal of hepatic vessels is suppressed and they appear hypointense. These are known as black blood images and they improve lesion detection (Fig. 5).

Several authors have published studies showing that diffusion images with low b-values (50–150s/mm2) have greater sensitivity in detecting liver lesions than those obtained with conventional T2-weighted sequences.9–13
In the study by Zech et al.11 diffusion images (b=50s/mm2) were compared with T2 and fat suppression-weighted images, with a sensitivity of 83% with diffusion in detecting hepatic lesions, against a sensitivity of 61% with T2 sequences. Parikh et al.12 also obtained a higher sensitivity (87.7%) in detecting hepatic lesions with diffusion sequences (b=50s/mm2) than with T2 sequences (70%). This difference was even greater when only malignant lesions were detected: 86.4% versus 62.9%. Bruegel's10 research team compared the sensitivity of these two sequences for the detection of liver metastases, with sensitivity in the diffusion technique varying between 91% and 92% and with the T2-weighted sequences between 47% and 67%. These differences were even more pronounced in metastases under 1cm in size.
Similarly, other authors have compared the effectiveness of the diffusion technique in detecting liver lesions with contrast-enhanced MRI sequences.14–18
Nasu et al.14 showed that diffusion images are more sensitive than studies with superparamagnetic iron oxide (SPIO) contrast in detecting metastases smaller than 1cm. However, they were less sensitive in detecting metastases located in the left hepatic lobe, due to cardiac motion artefacts. In the study by Koh et al.17 very similar results were obtained. The diffusion sequence capacity was compared with contrast-enhanced sequences which use mangafodipir trisodium for the detection of liver metastases in colorectal cancer and these studies demonstrated that it was easier for lesions <1cm or lesions near the edge of the liver to go undetected in contrast-enhanced studies. Low et al.18 also observed greater sensitivity in the detection of hepatic lesions with diffusion sequences than with unenhanced MRI sequences or after gadolinium administration.
In any case, all these sequences are not mutually exclusive techniques and a maximum efficiency in diagnosis is achieved by combining diffusion-weighted sequences with conventional sequences, including T2-weighted sequences and sequences following contrast administration.4
Characterisation of LesionsWith DWI, qualitative information is obtained on the basis of signal intensity, which helps to distinguish between solid and cystic lesions; this information will be more discerning when high b-values are used. However, occasionally, cystic lesions may display hyperintense behaviour in images obtained with high b-value sequences due to the T2 shine-through effect. Therefore, to differentiate between malignant and benign lesions, ADC maps, with which quantitative information is obtained, are more useful. Benign lesions generally have a higher ADC value than malignant lesions.
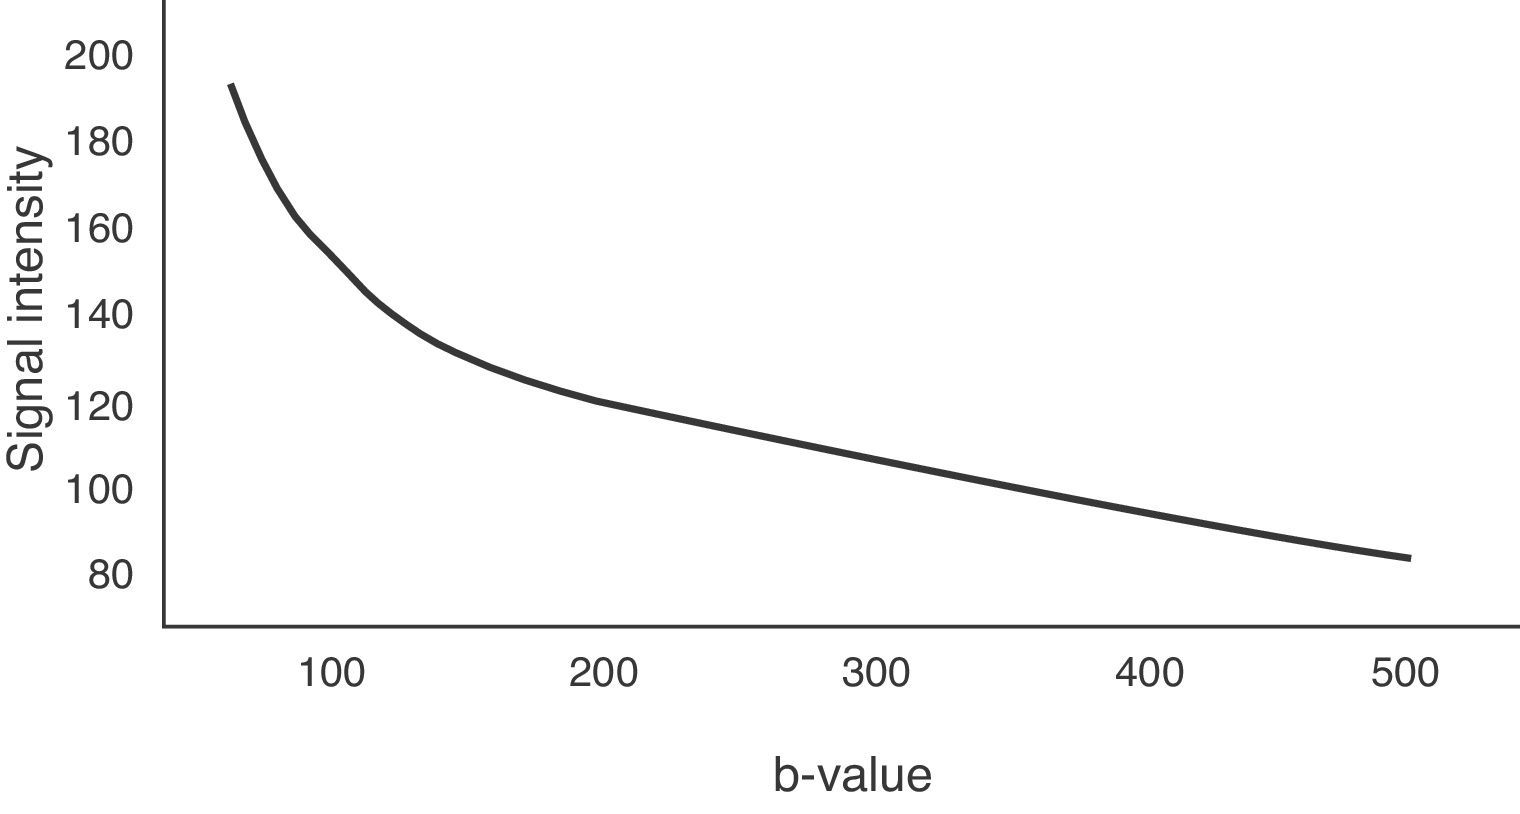
To determine the ADC value of liver lesions, at least two diffusion sequences are required, one with a b-value of 0s/mm2 and another with a b-value under 1000s/mm2. The reduction of the signal in the liver does not occur linearly with increase in the b-value, it occurs exponentially. Between b-values 0 and 150s/mm2, signal loss is greater due to the contribution of microcirculation.19 However, for b-values greater than 150s/mm2, water molecule motion in macroscopic vessels is not detected. Fig. 6 represents this exponential signal loss and the area of the curve influenced by the effect of normal hepatic perfusion. The motion of molecules in the capillary space is no longer detected above 500s/mm2 values and therefore, it is better to obtain the ADC sequence map with b-values above 500s/mm2.

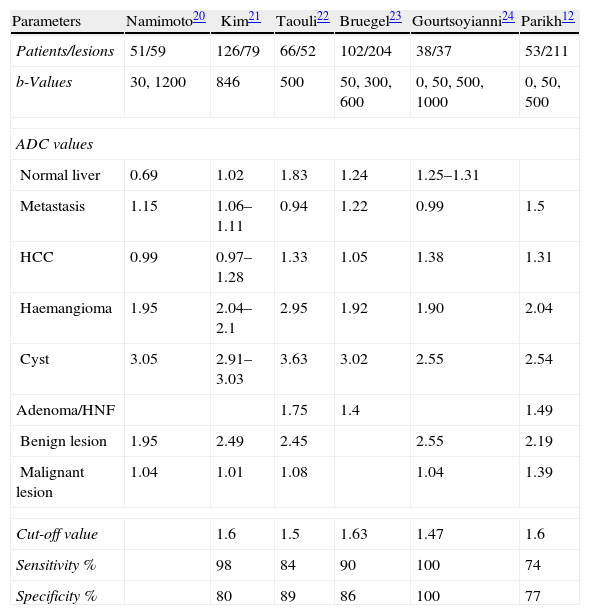
Several authors have carried out studies calculating ADC values in different hepatic lesions, to determine a cut-off point between benign and malignant lesions. Table 14 shows the mean ADC values of several liver lesions, the cut-off point between benign and malignant lesions and sensitivity and specificity in detecting malignant lesions, calculated by different authors.12,20–24
Mean ADC Values of the Normal Liver and Focal Liver Lesions, the Cut-off Value, Sensitivity and Specificity for the Diagnosis of Malignant Lesions in Different Studies Published.
| Parameters | Namimoto20 | Kim21 | Taouli22 | Bruegel23 | Gourtsoyianni24 | Parikh12 |
| Patients/lesions | 51/59 | 126/79 | 66/52 | 102/204 | 38/37 | 53/211 |
| b-Values | 30, 1200 | 846 | 500 | 50, 300, 600 | 0, 50, 500, 1000 | 0, 50, 500 |
| ADC values | ||||||
| Normal liver | 0.69 | 1.02 | 1.83 | 1.24 | 1.25–1.31 | |
| Metastasis | 1.15 | 1.06–1.11 | 0.94 | 1.22 | 0.99 | 1.5 |
| HCC | 0.99 | 0.97–1.28 | 1.33 | 1.05 | 1.38 | 1.31 |
| Haemangioma | 1.95 | 2.04–2.1 | 2.95 | 1.92 | 1.90 | 2.04 |
| Cyst | 3.05 | 2.91–3.03 | 3.63 | 3.02 | 2.55 | 2.54 |
| Adenoma/HNF | 1.75 | 1.4 | 1.49 | |||
| Benign lesion | 1.95 | 2.49 | 2.45 | 2.55 | 2.19 | |
| Malignant lesion | 1.04 | 1.01 | 1.08 | 1.04 | 1.39 | |
| Cut-off value | 1.6 | 1.5 | 1.63 | 1.47 | 1.6 | |
| Sensitivity % | 98 | 84 | 90 | 100 | 74 | |
| Specificity % | 80 | 89 | 86 | 100 | 77 | |
Source: Taouli.4
ADC values in these studies ranged between 0.97 and 1.38×10⁻³mm2/s for hepatocellular carcinoma, between 0.94 and 1.50×10⁻³mm2/s for metastases, between 1.4 and 1.75 for adenomas and focal nodular hyperplasia (FNH), between 1.90 and 2.10×10⁻³mm2/s for haemangioma and 2.91 and 3.63×10⁻³mm2/s for cysts, with a cut-off between benign and malignant lesions of 1.47–1.63. These differences were primarily due to the completion of the study with a different technique and different b-values. Using an ADC threshold value of 1.63×10⁻³mm2/s, they are classified as benign or malignant in 88% and with an ADC threshold value of 1.57×10⁻³mm2/s the differential diagnosis between haemangioma and metastases is established at 83%.23
Although malignant tumours generally have a lower ADC value than benign tumours, there are overlapping values between some benign lesions such as adenomas and FNH, and malignant lesions such as metastases or hepatocellular carcinoma. Furthermore, some malignant tumours such as mucinous or necrotic tumours do not restrict diffusion as much since they have less cellularity and therefore have a higher ADC value, which is above the cut-off point, simulating a benign lesion (false negatives), and on the other hand, benign processes such as liver abscesses restrict diffusion and have low ADC (false positives).
A less studied topic is the ability of DW-MRI to discriminate between low and high grade hepatocellular carcinomas. In the study by Muhi et al.25 it was concluded that moderately poorly differentiated and poorly differentiated hepatocellular carcinomas had a lower ADC value than well differentiated hepatocellular carcinomas and dysplastic nodules, which may display a signal similar to hepatic parenchyma in the diffusion image.
In summary, it is possible to use the quantitative DWI information to differentiate benign lesions from malignant liver lesions, and well-differentiated tumours from poorly differentiated malignant tumours. However there may be errors due to overlapping between ADC values of benign and malignant lesions. For this reason, to characterise hepatic lesions, it is advisable to evaluate DWI along with the rest of the study sequences (T2-weighted sequences after paramagnetic contrast).
Monitoring and Assessment of Response to TreatmentThe use of DWI for monitoring and assessing response to treatment is increasing considerably.26 When cancer treatment is effective, cell lysis and membrane rupture occur and there is increased extracellular space, leading to an increase in the ADC value, which can be observed even before the reduction of tumour size.
Studies carried out with animals have confirmed that following treatment with chemotherapy or radiotherapy, the cells swell and the ADC decreases in the first 24h, but subsequently, if the treatment is effective, the ADC rises because water diffusion increases due to cell lysis.27
Chen et al.28 conducted a study measuring the ADC in patients after treatment of hepatocellular carcinoma, and found that individuals who responded to treatment showed a significant increase in ADC values. Koh et al.29 observed an increase in the ADC in patients treated for hepatic metastases of colorectal cancer with at least a partial response to treatment. These authors have also used the ADC value as a predictor of treatment response: liver metastases which had responded better had a lower ADC before treatment. It is believed that this is because metastases with a higher value of ADC have more necrosis, and this entails an increase in hypoxia, acidosis and decreased perfusion, which reduces sensitivity to chemotherapy and radiotherapy.
Another important aspect is the difficulty of differentiating between residual post-treatment changes in local recurrence of the tumour with normal imaging techniques. With DW-MRI, it is possible to distinguish between postradiation changes and recurrent disease because of the determination of ADC values, which are greater in the treated areas than in areas of tumour activity due to the presence of extracellular oedema.30
Diffuse Liver DiseaseLastly, the usefulness of DWI is currently being examined to study the extent of fibrosis in chronic diffuse liver disease.
Lewin et al.31 studied 54 patients with chronic hepatitis C and 20 healthy subjects who underwent MRI with diffusion sequences using b-values of 0, 200, 400 and 800s/mm2. ADC values were compared with the results of the elastography ultrasound and blood markers of fibrosis, concluding that ADC values were lower in patients with moderate or severe fibrosis (1.1±0.11×10⁻³mm2/s), higher in patients with mild fibrosis (1.3±0.12×10⁻³mm2/s) and higher again in healthy liver parenchyma patients (1.44±0.02×10⁻³mm2/s). The sensitivity and specificity of the diffusion technique for diagnosing fibrosis was 87%.
The mechanism by which the ADC is lower in chronic diffuse liver disease with fibrosis is still not completely understood and is probably multifactorial, affected by the increase in connective tissue and the reduction in blood flow.4 Furthermore, these authors found a significant relationship between ADC values and the suspicion of inflammatory disease and hepatic steatosis.
Chandarana et al.8 consider the ADC value as a predictor of fibrosis staging with a sensitivity of 88.5% and a specificity of 73.3% and the degree of liver inflammation with a sensitivity of 75% and a specificity of 78.6%.
ConclusionDW-MRI is an important tool in the diagnosis of liver lesions as an additional, complementary sequence to the rest of the usual study protocol. The diagnostic accuracy of MRI for liver lesions is significantly enhanced when the conventional sequences and the DWI sequence are combined.
DW-MRI has the advantage of not using ionising radiation, the examination time hardly increases using quick sequences and the administration of paramagnetic contrast is not necessary, and as such, it can be used in patients with kidney failure.
DWI is considered a very effective technique for detecting liver lesions, especially in sequences with low b-values (50–150s/mm2) because the anatomical image resolution is better. Determining the ADC helps characterise the lesions and serial measurements of ADC values are also very useful in the assessment of the response to treatment of neoplastic processes: patients with a good response to treatment show a rise in ADC.
Therefore, it is important that physicians are familiarised with this diagnostic technique, because DWI is a sequence that should be included routinely in the study protocol of MRI of the liver.
Conflicts of InterestThe authors have no conflicts of interest to declare.
Please, cite this article as: Vallejo Desviat P, et al. Difusión en resonancia magnética en el estudio de lesiones hepáticas. Cir Esp. 2013;91:9–16.
