


The aim of this work is to analyze the weight evolution of the main bariatric surgical techniques (Roux-en-Y gastric Bypass-RYGB and Sleeve Gastrectomy-SG) performed in a representative sample of Spanish centers, in order to make a percentiles charts of the percentage of total weight loss during the first 3 years after surgery.
MethodsA retrospective longitudinal cohort study was conducted based on the data provided by 9 Spanish hospitals. Weight data were analyzed both in %TWL (total weight loss) and %EWL (excess weight lost) corresponding to the RYGB (n = 1887) and SG (n = 1210).
ResultsBPGY remains the most frequently performed technique in our national sample. In both surgical techniques, maximum weight loss occurs 18 months after surgery. Both techniques follow the same weight evolution, although the %TWL values are lower in the case of the SG at 36 months (% TWL RYGB = 33.6 ± 10 vs %TWL GV = 29.3 ± 10). Age and gender are decisive in the weight results (better in younger patients for both techniques and better in women for BPGY)
ConclusionsPercentile charts of % TWL after bariatric surgery represent a very useful tool and an important advance in the quality of patient management.
El objetivo de este trabajo es analizar la evolución ponderal de las principales técnicas quirúrgicas bariátricas (Bypass gastroyeyunal en Y de Roux-BPGY y Gastrectomía Vertical-GV) realizadas en un conjunto representativo de centros nacionales españoles, con el fin de confeccionar unas gráficas de percentiles del porcentaje de pérdida total de peso perdido durante los 3 primeros años después de la cirugía.
MétodosSe realiza un estudio de cohortes longitudinal retrospectivo a partir de los datos aportados por 9 centros hospitalarios españoles. Se han analizado los datos ponderales tanto en porcentaje de pérdida total de peso perdido (% PTPP) y en porcentaje de exceso de peso perdido (% EPP) correspondientes al BPGY(n = 1887) y a la GV (n = 1210).
ResultadosEl BPGY sigue siendo la técnica más frecuentemente realizada en nuestra muestra nacional. En ambas técnicas quirúrgicas, la pérdida de peso máxima se produce a los 18 meses de la cirugía. Ambas técnicas siguen la misma evolución ponderal, aunque los valores del %PTPP sean inferiores en el caso de la GV a los 36 meses (%PTPP BPGY = 33,6 ± 10 vs% PTPP GV = 29,3 ± 10). La edad y el género son determinantes en los resultados ponderales (mejores en paciente más jóvenes para ambas técnicas y mejores en mujeres para el BPGY)
ConclusionesLas gráficas de percentiles del porcentaje de peso total perdido después de la cirugía bariátrica representan una herramienta muy útil y un avance importante en la calidad asistencial para el seguimiento ponderal del paciente.
Weight loss after bariatric surgery is one of the main variables considered when analyzing postoperative results, together with the resolution of associated comorbidities. The medical community has historically studied and implemented new ways of expressing this weight loss to determine whether it is appropriate for a certain surgical technique. Reaching what is considered a normal weight is not mandatory for achieving significantly improved health after surgery.1 It is a difficult objective for a morbidly obese patient to reach a BMI of 25 kg/m2 after bariatric surgery, and anything less should not be considered a failure. It seems reasonable to establish a more realistic limit to rationalize the patient’s expectations and avoid frustration. The Bariatric Outcomes Longitudinal Database2 suggests that a very suitable tool to express weight loss after surgery is the percent of total weight loss (%TWL), as it is independent of the patient’s initial BMI.3 Expressing the results in this manner allows for comparison between surgical series and knowing objectively whether one technique can be considered more effective than another in terms of weight loss. Moreover, its graphic representation is possible with percentile curves during the intermediate and long-term postoperative period, thereby functioning as a detection or prediction tool for individual weight loss evolution.4 In addition to the %TWL, other indicators proposed by the American Society for Metabolic and Bariatric Surgery include the percent excess BMI lost.5
The indicator of percent excess weight loss (%EWL) proposed in 19816,7 (which defines the minimum success rate at 50% one year after surgery) has ceased to be the only tool for analyzing weight loss and should be complemented with other existing indicators to meet current quality criteria.8 Although it was a more or less arbitrary measure, with the %EWL we had a tool to classify the success or failure of the technique. Currently, with the %TWL and the percentage of excess BMI lost, we still do not have cut-off points that would allow us to classify the weight evolution of individual patients.
The objective of this study is to analyze the weight evolution of the main bariatric surgical techniques (Roux-en-Y gastric bypass [RYGB] and sleeve gastrectomy [SG]) performed in a representative group of Spanish public hospitals. From the data collected, we propose to develop percentile figures of %TWL to facilitate the interpretation of weight loss after surgery for both the surgeon and the patient. The final proposal of this study is to implement their extended use in daily clinical practice.
MethodsA retrospective longitudinal cohort study was conducted using data provided by 9 member hospitals of the Obesity and Metabolic Diseases Division of the Spanish Association of Surgeons (Asociación Española de Cirujanos). Each hospital has provided data for anthropometric variables, type of surgery performed and main patient characteristics (age, sex and presence of type 2 diabetes mellitus [DM2]), as well as complete weight monitoring for 3 years after the surgical intervention. Re-operation due to insufficient weight loss was considered a general exclusion criterion. Data from these hospitals have been anonymized and included in a single database (Microsoft® Office Excel 2016). Weighted data have been analyzed for RYGB (n = 1887) and SG (n = 1210).
The %TWL variable was calculated with the formula: [(initial weight − current weight) / (initial weight)] × 100. The %EWL variable was calculated with the formula: [(initial weight − current weight) / (initial weight – ideal weight)] × 100. The ideal weight for each patient was determined by the weight corresponding with a BMI of 25 kg/m2.
IBM® SPSS® v.25 software was used for the general and percentile statistical analyses. The Student’s t-test was used for the comparison of means of the different variables for independent data. In the data analysis by age groups, the median was used as the cut-off point.
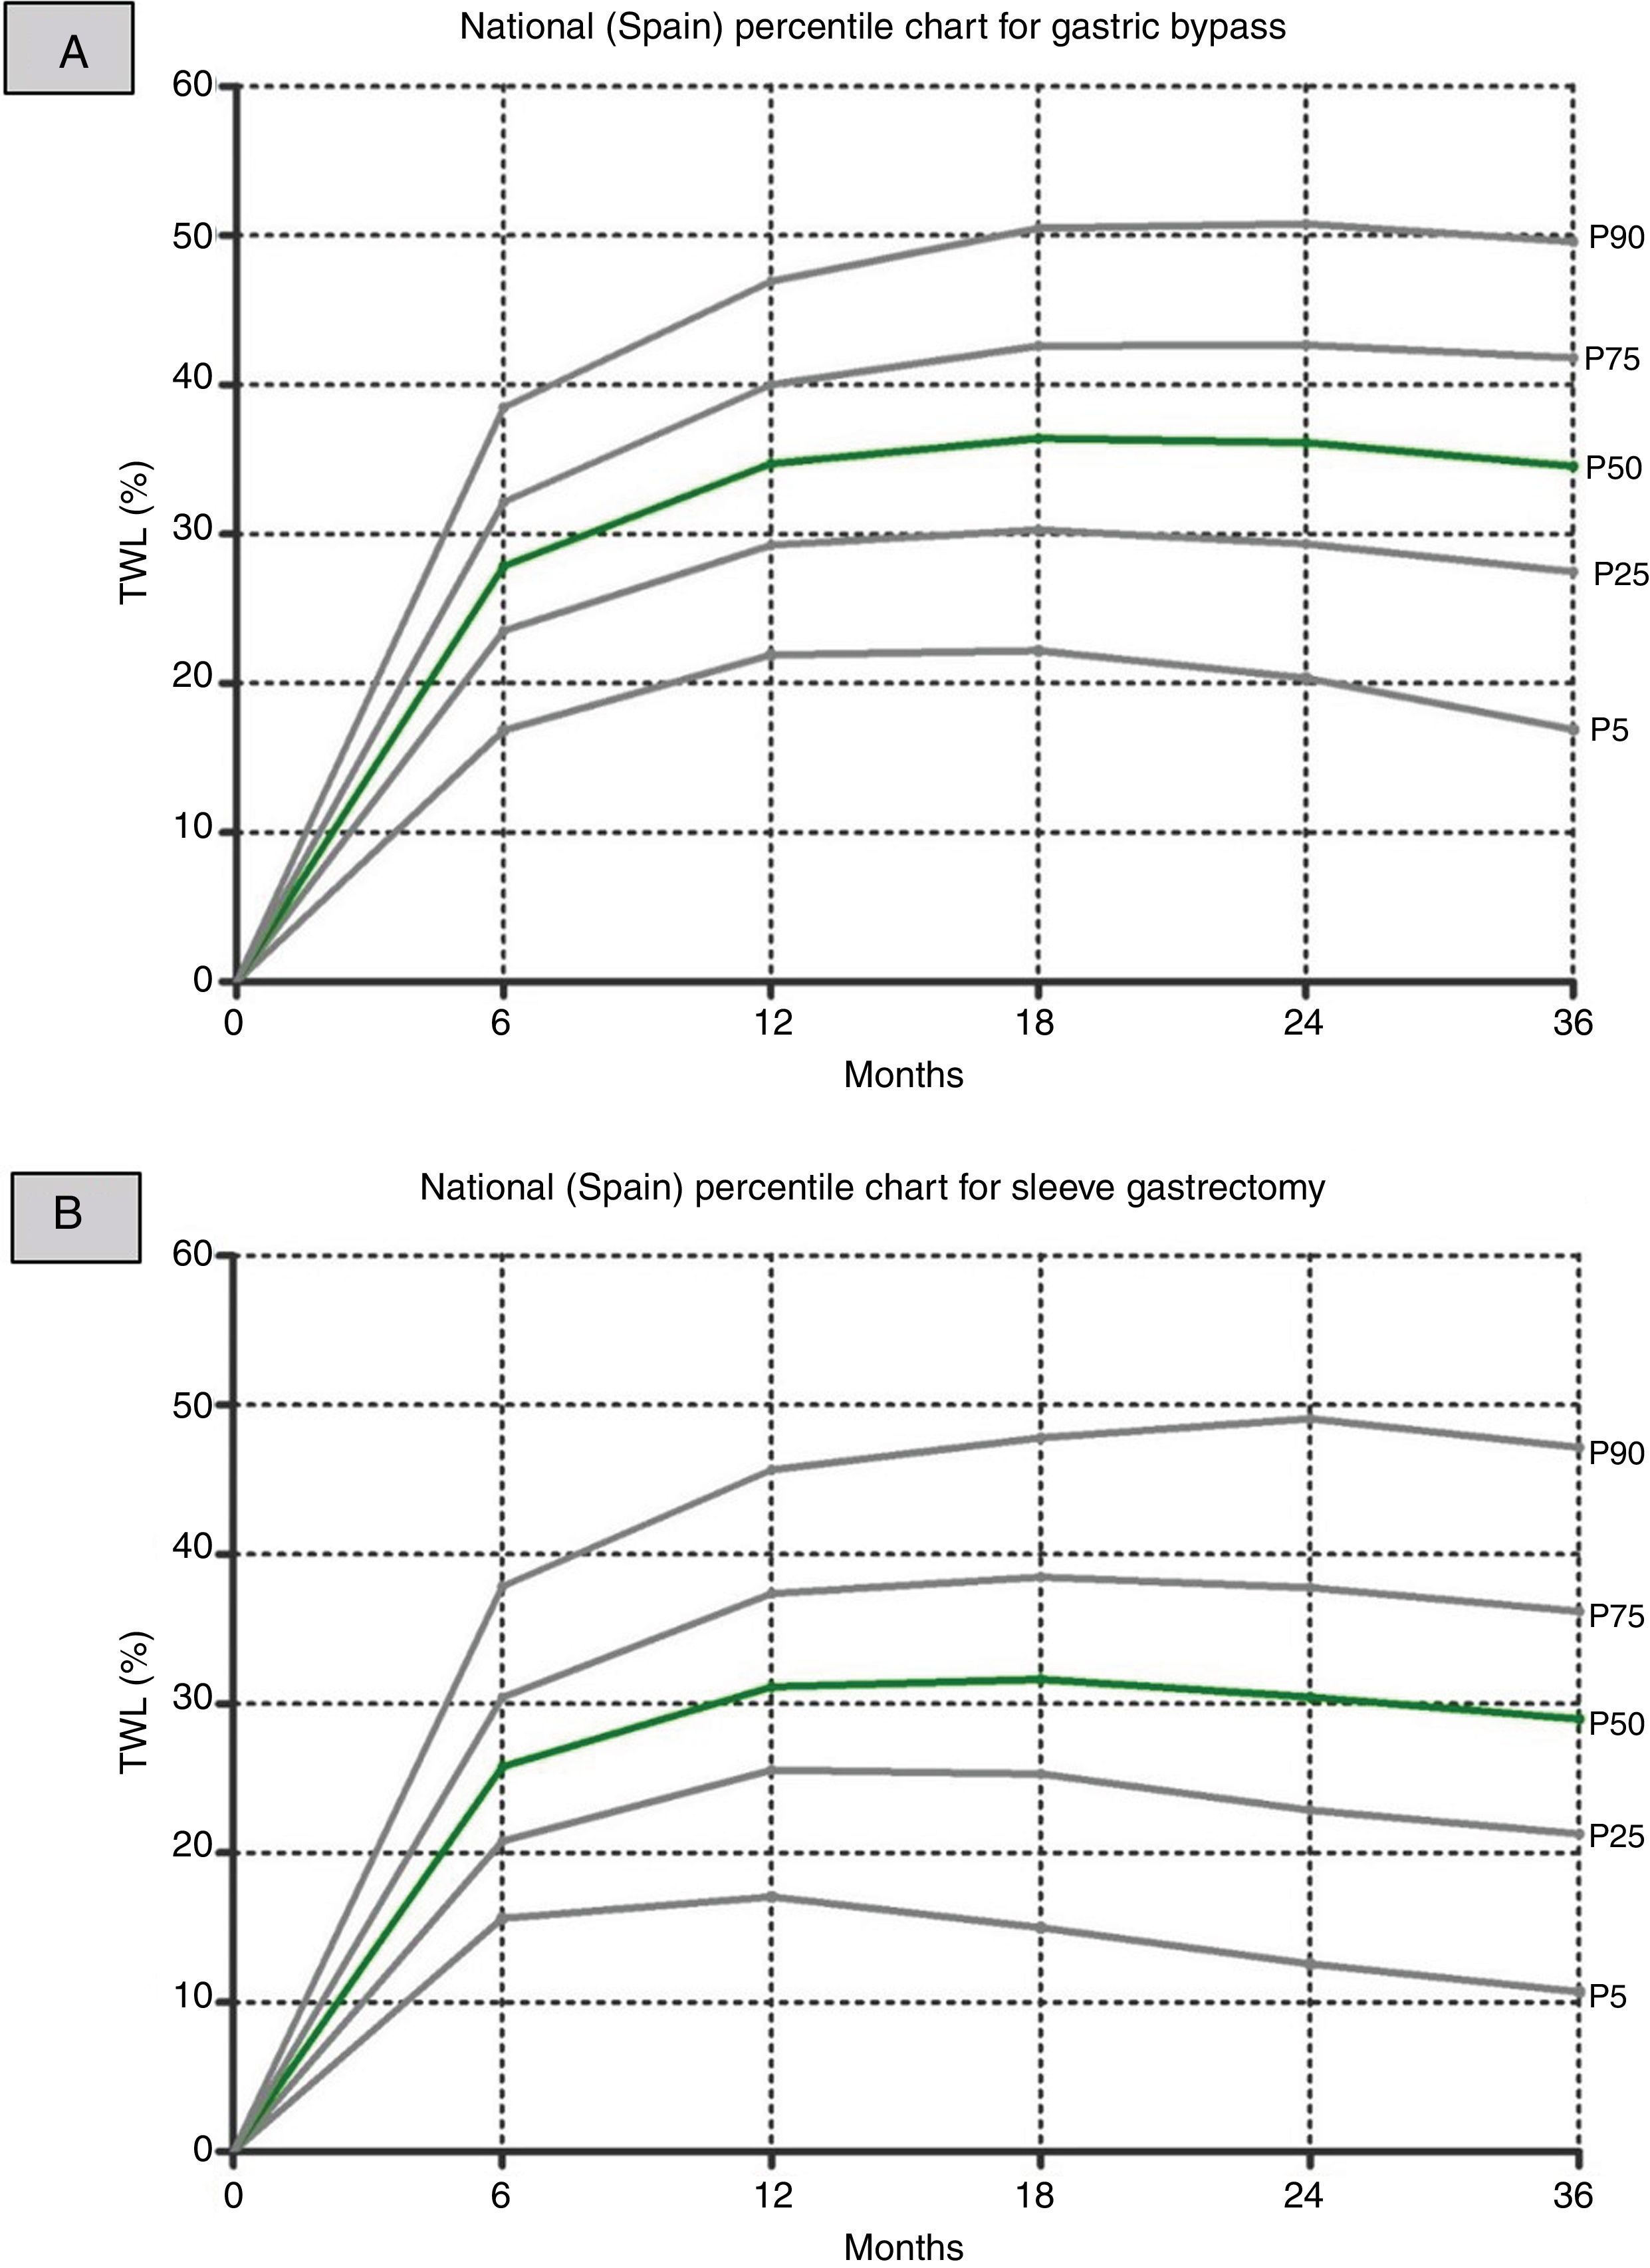
The statistical analysis of frequencies has generated the different calculated percentiles desired (5, 25, 50, 75, 90) for the %TWL variable, in both techniques and along the different cut-off points (6, 12, 18, 24 and 36 months). Each percentile shows the value below which that percentage of cases is found. The generic statistical formula is Px=n*K/100, where n is the sample number and K the percentile to be calculated. A P < .05 was considered statistically significant. The charts have been edited with GraphPad® Prism 5 software.
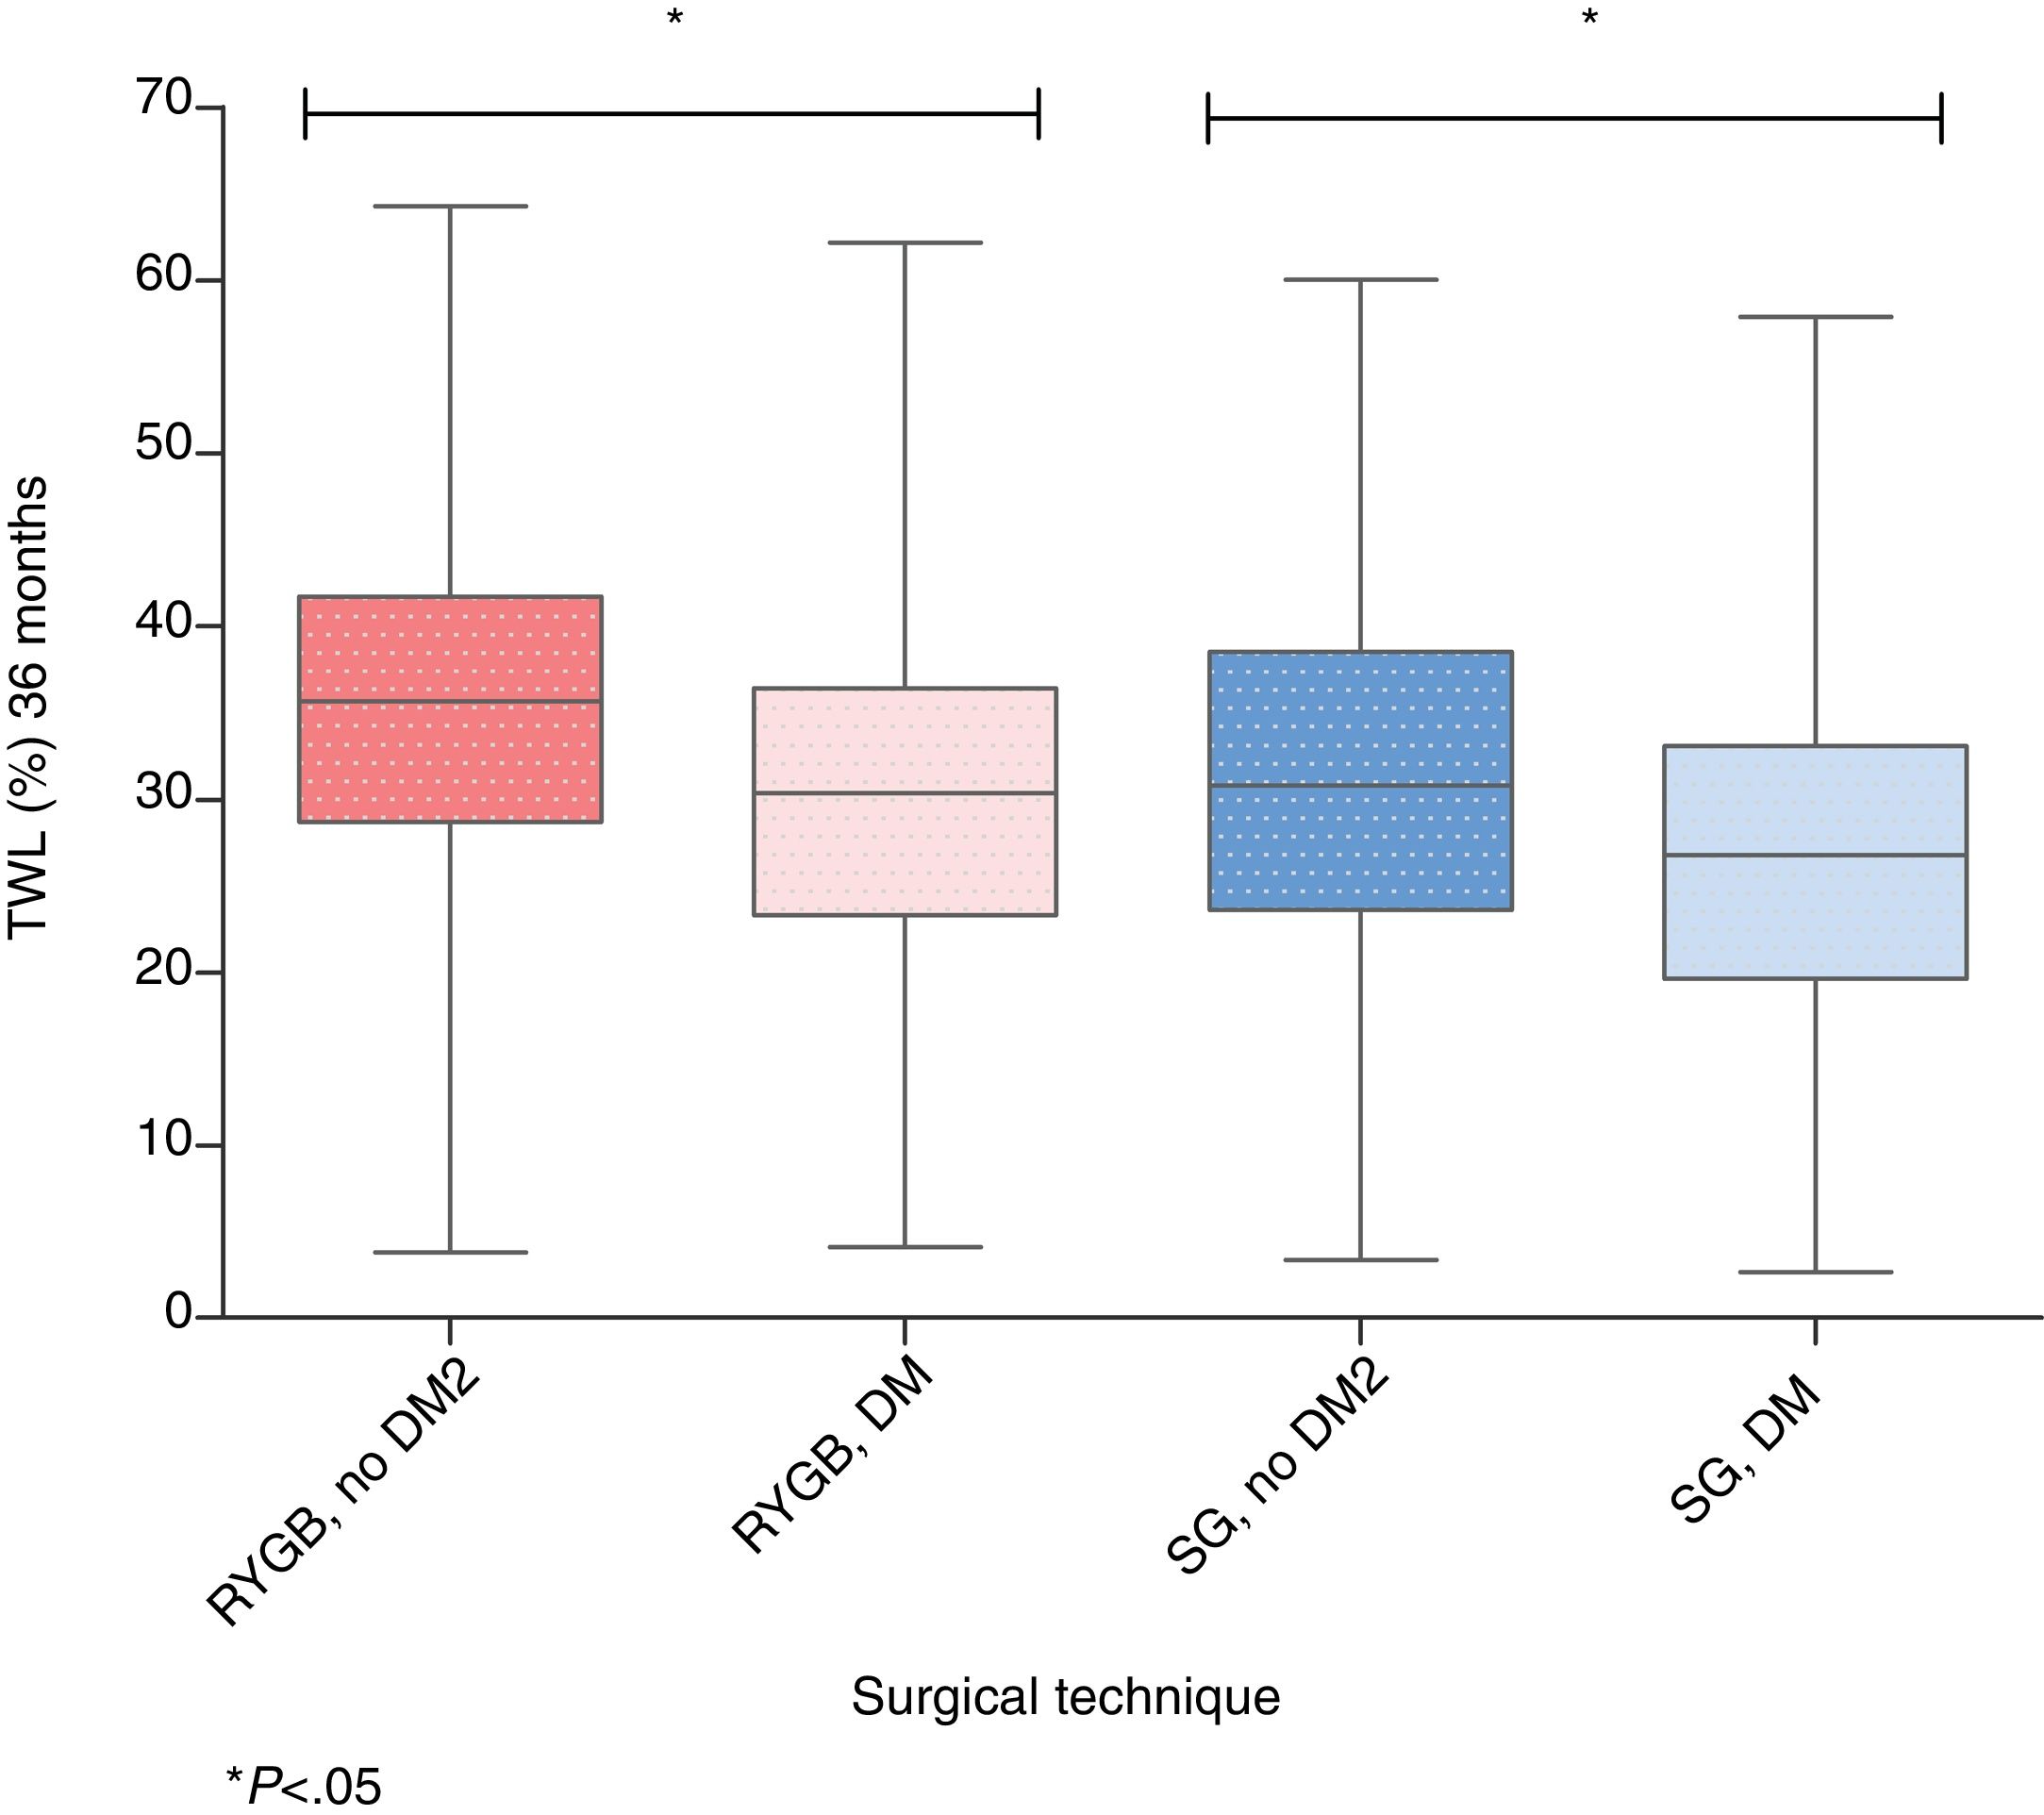
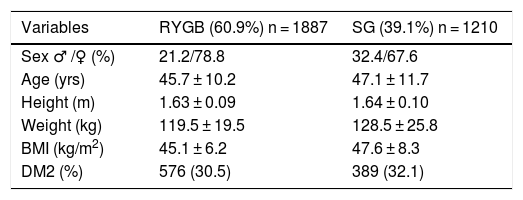
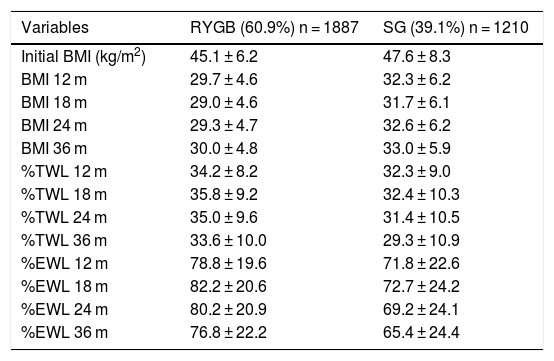
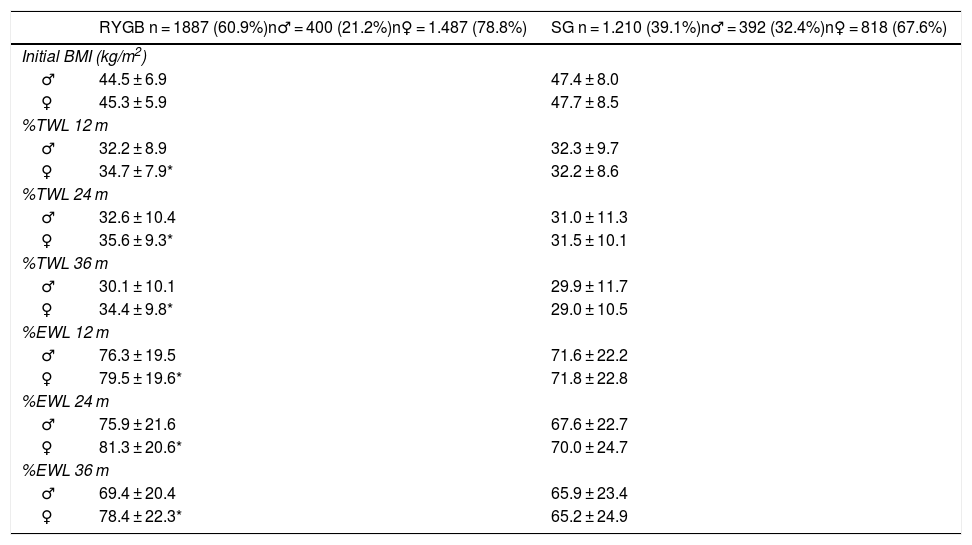
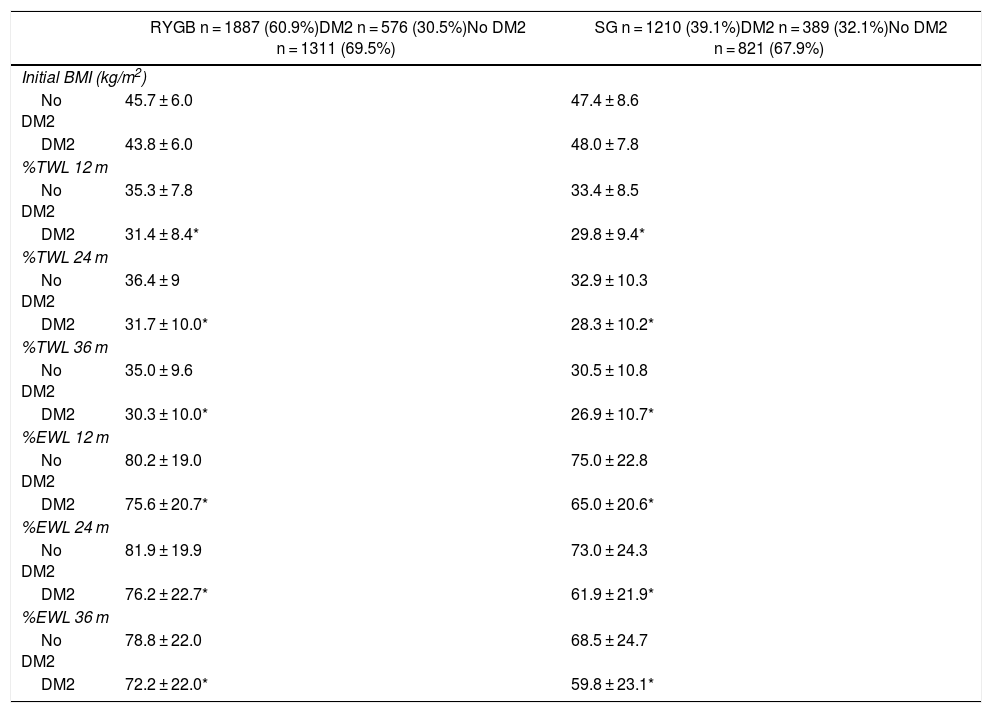
ResultsData from a total of 3376 patients have been recorded and analyzed. Their distribution and baseline characteristics according to the surgical technique performed are reflected in Table 1. The most commonly used surgical technique in the sample was RYGB (60.9%), followed by SG (30.1%). In both techniques, there is a similar percentage of patients with DM2 (30.5% for RYGB and 32.1% for SG). Table 2 shows the baseline characteristics of the sample as a whole and according to the surgery performed. In both surgical techniques, the maximum weight loss in both %TWL and %EWL occurs 18 months after surgery. Table 3 provides the results obtained according to sex and Table 4 according to the presence or not of DM2. In the case of RYGB, the percentage of male patients was 21.2%, and in SG 32.4%. We did not find significant differences in the initial BMI between the sexes for both techniques. In contrast, we found significant differences in the weight evolution between the sexes for RYGB (more favorable for females). Nevertheless, this did not happen in the case of SG, where the weight evolution between the sexes was similar. When we analyzed the weight evolution between diabetic and non-diabetic patients, we observed that, in both techniques, the differences between the 2 groups are statistically significant, with a worse weight loss evolution in patients with DM2 that is maintained throughout the analyzed period. Fig. 1 shows the boxplot of total weight loss 36 months after surgery (%TWL) in both techniques and according to the condition of DM2. If we analyze the results based on 2 age groups (median for RYGB = 46 and SG = 46.6), we observe that younger patients have better results than older patients in terms of %EWL and %TWL (Table 5). This occurs significantly in both surgical techniques.
Baseline Characteristics of the Sample, Both Overall and According to Surgical Procedure.
| Variables | RYGB (60.9%) n = 1887 | SG (39.1%) n = 1210 |
|---|---|---|
| Sex ♂ /♀ (%) | 21.2/78.8 | 32.4/67.6 |
| Age (yrs) | 45.7 ± 10.2 | 47.1 ± 11.7 |
| Height (m) | 1.63 ± 0.09 | 1.64 ± 0.10 |
| Weight (kg) | 119.5 ± 19.5 | 128.5 ± 25.8 |
| BMI (kg/m2) | 45.1 ± 6.2 | 47.6 ± 8.3 |
| DM2 (%) | 576 (30.5) | 389 (32.1) |
RYGB: Roux-en-Y gastric bypass; DM2: type 2 diabetes mellitus; SG: sleeve gastrectomy; BMI: body mass index.
Overall Evolution of Weight Loss After Gastric Bypass and Sleeve Gastrectomy.
| Variables | RYGB (60.9%) n = 1887 | SG (39.1%) n = 1210 |
|---|---|---|
| Initial BMI (kg/m2) | 45.1 ± 6.2 | 47.6 ± 8.3 |
| BMI 12 m | 29.7 ± 4.6 | 32.3 ± 6.2 |
| BMI 18 m | 29.0 ± 4.6 | 31.7 ± 6.1 |
| BMI 24 m | 29.3 ± 4.7 | 32.6 ± 6.2 |
| BMI 36 m | 30.0 ± 4.8 | 33.0 ± 5.9 |
| %TWL 12 m | 34.2 ± 8.2 | 32.3 ± 9.0 |
| %TWL 18 m | 35.8 ± 9.2 | 32.4 ± 10.3 |
| %TWL 24 m | 35.0 ± 9.6 | 31.4 ± 10.5 |
| %TWL 36 m | 33.6 ± 10.0 | 29.3 ± 10.9 |
| %EWL 12 m | 78.8 ± 19.6 | 71.8 ± 22.6 |
| %EWL 18 m | 82.2 ± 20.6 | 72.7 ± 24.2 |
| %EWL 24 m | 80.2 ± 20.9 | 69.2 ± 24.1 |
| %EWL 36 m | 76.8 ± 22.2 | 65.4 ± 24.4 |
RYGB: Roux-en-Y gastric bypass; SG: sleeve gastrectomy; BMI: body mass index; m: months; %EWL: percent excess weight loss; %TWL: percent total weight loss.
Evolution of Weight Loss for Both Techniques by Sex.
| RYGB n = 1887 (60.9%)n♂ = 400 (21.2%)n♀ = 1.487 (78.8%) | SG n = 1.210 (39.1%)n♂ = 392 (32.4%)n♀ = 818 (67.6%) | |
|---|---|---|
| Initial BMI (kg/m2) | ||
| ♂ | 44.5 ± 6.9 | 47.4 ± 8.0 |
| ♀ | 45.3 ± 5.9 | 47.7 ± 8.5 |
| %TWL 12 m | ||
| ♂ | 32.2 ± 8.9 | 32.3 ± 9.7 |
| ♀ | 34.7 ± 7.9* | 32.2 ± 8.6 |
| %TWL 24 m | ||
| ♂ | 32.6 ± 10.4 | 31.0 ± 11.3 |
| ♀ | 35.6 ± 9.3* | 31.5 ± 10.1 |
| %TWL 36 m | ||
| ♂ | 30.1 ± 10.1 | 29.9 ± 11.7 |
| ♀ | 34.4 ± 9.8* | 29.0 ± 10.5 |
| %EWL 12 m | ||
| ♂ | 76.3 ± 19.5 | 71.6 ± 22.2 |
| ♀ | 79.5 ± 19.6* | 71.8 ± 22.8 |
| %EWL 24 m | ||
| ♂ | 75.9 ± 21.6 | 67.6 ± 22.7 |
| ♀ | 81.3 ± 20.6* | 70.0 ± 24.7 |
| %EWL 36 m | ||
| ♂ | 69.4 ± 20.4 | 65.9 ± 23.4 |
| ♀ | 78.4 ± 22.3* | 65.2 ± 24.9 |
RYGB: Roux-en-Y gastrojejunal bypass; SG: sleeve gastrectomy; BMI: body mass index; m: months; %EWL: percent excess weight loss; %TWL: percent total weight loss.
*P<.05 intragroup.
Evolution of Weight Loss for Both Techniques According to DM2 Status.
| RYGB n = 1887 (60.9%)DM2 n = 576 (30.5%)No DM2 n = 1311 (69.5%) | SG n = 1210 (39.1%)DM2 n = 389 (32.1%)No DM2 n = 821 (67.9%) | |
|---|---|---|
| Initial BMI (kg/m2) | ||
| No DM2 | 45.7 ± 6.0 | 47.4 ± 8.6 |
| DM2 | 43.8 ± 6.0 | 48.0 ± 7.8 |
| %TWL 12 m | ||
| No DM2 | 35.3 ± 7.8 | 33.4 ± 8.5 |
| DM2 | 31.4 ± 8.4* | 29.8 ± 9.4* |
| %TWL 24 m | ||
| No DM2 | 36.4 ± 9 | 32.9 ± 10.3 |
| DM2 | 31.7 ± 10.0* | 28.3 ± 10.2* |
| %TWL 36 m | ||
| No DM2 | 35.0 ± 9.6 | 30.5 ± 10.8 |
| DM2 | 30.3 ± 10.0* | 26.9 ± 10.7* |
| %EWL 12 m | ||
| No DM2 | 80.2 ± 19.0 | 75.0 ± 22.8 |
| DM2 | 75.6 ± 20.7* | 65.0 ± 20.6* |
| %EWL 24 m | ||
| No DM2 | 81.9 ± 19.9 | 73.0 ± 24.3 |
| DM2 | 76.2 ± 22.7* | 61.9 ± 21.9* |
| %EWL 36 m | ||
| No DM2 | 78.8 ± 22.0 | 68.5 ± 24.7 |
| DM2 | 72.2 ± 22.0* | 59.8 ± 23.1* |
RYGB: Roux-en-Y gastrojejunal bypass; DM2: diabetes mellitus, type 2; SG: sleeve gastrectomy; BMI: body mass index; m: months; %EWL: percent of excess weight loss; %TWL: percent of total weight loss.
*P<.05 intragroup.
 with both techniques and according to DM2 condition.")
Evolution of Weight Loss for Both Techniques According to Age Groups.
| RYGB, n = 1887 (60.9%)Median = 46 yrs | SG, n = 1210 (39.1%)Median = 46.6 yrs | |
|---|---|---|
| %TWL 12 m | ||
| Group 1 | 35.4 ± 8 | 34.6 ± 8.9 |
| Group 2 | 32.8 ± 8.4* | 30.0 ± 8.3* |
| %TWL 24 m | ||
| Group 1 | 36.6 ± 9.8 | 34.4 ± 10.5 |
| Group 2 | 33.4 ± 9.5* | 28.7 ± 9.7* |
| %TWL 36 m | ||
| Group 1 | 35.6 ± 10.2 | 31.9 ± 10.4 |
| Group 2 | 31.8 ± 9.6* | 27.0 ± 10.7* |
| %EWL 12 m | ||
| Group 1 | 80.5 ± 19.1 | 76.6 ± 23.7 |
| Group 2 | 77.3 ± 20.4* | 67.7 ± 20.8* |
| %EWL 24 m | ||
| Group 1 | 82 ± 20.8 | 75.0 ± 24.7 |
| Group 2 | 78.7 ± 21.2* | 64.3 ± 22.5* |
| %EWL 36 m | ||
| Group 1 | 79.6 ± 21.9 | 71.4 ± 24 |
| Group 2 | 74.9 ± 22.4* | 60.8 ± 23.6* |
RYGB: Roux-en-Y gastrojejunal bypass; SG: sleeve gastrectomy; m: months; %EWL: percent excess weight loss; %TWL: percent total weight lost.
Group 1 < median; Group 2 > median.
*P < .05 intragroup.
Finally, from the total data of all patients by hospital, the percentile graphs of the %TWL generated for each of the main surgical interventions are shown (Fig. 2).
Discussion in percentiles for Roux-en-Y gastric bypass; total weight loss (%TWL) in percentiles for sleeve gastrectomy.")
This study compiles data from different Spanish hospitals with the aim to better analyze weight loss after bariatric surgery in a large patient sample. We have limited the representation of the data to the 2 main techniques carried out in Spain in order to obtain a parallel comparison of the results, obviating possible sample bias. The baseline results of the sample indicate that, despite the fact that SG has become the most frequent bariatric surgical procedure (46%) performed wordwide,9 RYGB remains the most frequently performed technique in our national sample. In addition, the percentage of patients with DM2 is clearly higher in our sample than the percentage published in the Western European population subsample (31.3 vs. 20%).9 These results may be explained by the fact that most of the participating hospitals are high-volume referral hospitals, both locally and nationally.
Regarding the weight loss results for RYGB, the maximum %EWL occurs 18 months after surgery, remaining similar after 24 months and then starting to drop after 36 months. It is noteworthy that a %EWL well above 50% is reached after 6 months. The %TWL also reaches figures that indicate a correct weight loss at one, 2 and 3 years after surgery, similar to other published series and based on current recommendations.8,10
In the case of SG, the weight evolution follows the same pattern as RYGB, although the %EWL and %TWL values are slightly lower than RYGB. These results are consistent with the data published in 2 recent clinical trials with patients randomized to the 2 techniques,11,12 which are an important reference for the scientific community.13
As for the differences in weight behavior between the sexes in both techniques, in the case of SG, initial significant differences (more favorable weight loss for the male gender) were reported in the first 6 months after surgery, although these differences were equal after one year.14 In our sample, there were no differences in any of the periods analyzed for this technique. When we analyzed the RYGB cases, we observed that the male gender group behaved significantly worse than the female gender group throughout the period analyzed and for both indicators of weight loss. This phenomenon is also observed in the aforementioned studies by Van de Laar, who in turn reported greater effectiveness in the subgroups of younger patients.15
Regarding the differences between diabetic and non-diabetic patients, we know that in patients with DM2, weight loss after RYGB does not depend on the initial BMI.16 In this context, our patient groups had significantly more favorable indicators of weight loss in the subgroups of non-diabetic patients and after both surgical techniques. It would be plausible to perform the percentile curves of the %TWL differentiated for both subpopulations and in each of the techniques analyzed.
The main objective of this study was to describe the weight loss curves for each of these 2 techniques using the %TWL indicator. This indicator does not correlate with the preoperative BMI of patients, as demonstrated in several published series.4,10 The description of the percentiles for each follow-up point allowed us to individually evaluate the evolution of our patients. This type of strategy is not new in the evaluation of populations and is already widely used and recognized in other disciplines such as Pediatrics.
In order to refine the interpretative capacity of these curves, a prospective study over several years would be required, to which more and more subjects could be added. With this objective, and with the support of the main Spanish scientific societies in the field, a program is being prepared that would allow us to validate these results, while broadening the base on which these curves are constructed. We now put forth the foundation of a tool that we presume would allow us to more objectively evaluate the weight evolution of our surgical patients. This would be very useful in daily clinical practice and represents an important development in quality, both in patient care and at the corporate level of scientific societies.
Limitations of the study include the fact that, because the initial BMI of both surgical techniques is significantly different, a comparative study has not been performed. The percentile graphs may undergo modifications of their cut-off values in future editions, depending on the global case series analyzed. In addition, we make the assumption that the SG and RYGB techniques were homogeneous in order compare the evolution of all the patients treated with each technique. A more thorough review of the other comorbidities in addition to diabetes, with its pharmacological treatment and dietary/hygiene habits, could provide us with more information regarding the typology of each patient and allow us to perform a more detailed analysis of the sample.
Conflict of InterestsThe authors have no conflict of interests to declare.
Please cite this article as: Sabench Pereferrer F, Molina López A, Acín Gándara D, Arroyo Martín JJ, Baltar Boileve J, Barranco Moreno A, et al. Análisis de la pérdida ponderal a medio plazo después del bypass gastroyeyunal en Y de Roux y de la gastrectomía vertical: propuesta de gráficos de percentiles del porcentaje de peso total perdido para su uso en la práctica clínica diaria. Cir Esp. 2020;98:72–78.
