


Merchandising at point of sale comprises a set of techniques aimed at encouraging the purchase at the point of sale. This paper analyzes the impact on sales of two of these techniques, especially used in the context of non-specialized food stores and rarely distinguished in academic research: (1) the presentation of product in the ends of the aisles or main aisles, leading from the side aisle access and, (2) the presentation of the product in islands within the main aisles. This research combines cross-sectional and longitudinal data and analyzes specific information on sales and commercial stimulus for all references in two large categories of products from a hypermarket over ten weeks. Results show that both the ends of aisle and the islands have a positive effect on sales and their relative importance depends on the nature of the category analyzed. There are also greater synergies between ends of aisle and price promotions. Finally, the results provide some evidence into the impact of the extension or termination of these merchandising stimuli.
According to the AMA (American Marketing Association), merchandising is a wide term that encompasses promotional activities run by the manufacturer in the form of special presentations that take place within establishments, as well as initiatives run by the retailer to make the product stand out. In any case, merchandising refers to commercial actions at the point of sale aimed to stimulate customers¿ purchases as soon as they enter the establishment. Traditionally, it was conceived as a way to motivate the purchase with the highest benefit-cost ratio (Buttle, 1984).
The manufacturer's and retailer's reliance on merchandising actions has been growing over the past few years. For instance, in the Spanish market the investment in this communication technique shows an increase of 0.7%, when the average variation in communication and publicity has been −9.9% (Infoadex, 2013). This increasing interest in merchandising can be credited to current studies that show that unplanned purchases make up between 46 and 70% of total purchases (Bezawada et al., 2009; Inman et al., 2009; Bell et al., 2011). That is, there are purchases that are decided at the store and thus, are very influenced by commercial incentives that arise in it. Thus, from the manufacturer’ point of view, the growing competition in the shelves at the point of sale, aggravated with the increasing development of private label (up to a market share of 43.5% in packaged food, according to AC Nielsen, 2013), makes merchandising initiatives very useful actions to increase the visibility and attraction of their brands at the point of sale. Similarly, from the point of view of the retailer, increased competition between hypermarkets, reflected in their increasing number and the falling demands (AC Nielsen, 2013), involves not only the need to enhance the attraction to the stores, but also the need to develop merchandising initiatives which could achieve the best possible performance from customers visit.
Several previous academic contributions have approached the effect of merchandising initiatives on consumer behavior and market response (Chevalier, 1975; Buttle, 1984; Gupta, 1988; Bolton, 1989; Narasimhan et al., 1996; Shankar and Krishnamurthi, 1996; Little, 1998; Van Heerde et al., 2000, 2004; Chan et al., 2008; Bezawada et al., 2009; Inman et al., 2009). However, the role of merchandising is usually analyzed in an aggregate manner as a special presentation within the point of sale (display). In addition, it is usually studied in a collateral form together with an interpretation of external communication stimulus added to the point of sale (feature), with special attention to the effect of price and product promotions in its usual sense. Some studies have explored separate analysis of different promotions and external communication stimuli at point of sale, such as flyers, coupons, ads, etc. (Bawa, 1996; Gijsbrechts et al., 2003; Zhang et al., 2009; Bezawada et al., 2009). However, the effort to analyze the impact of various merchandising initiatives disaggregated manner has been much more limited, despite having been identified as an important issue (Buttle, 1984; Ailawadi et al., 2009; Shankar et al., 2011). The difficulty to collect precise data may underlie this lack of studies.
We seek to contribute in this regard, by using separately and comparatively the effect on sales of various merchandising initiatives. Specifically, we focus on two very common initiatives at the point of sale: the presentation of the product in ends of aisle and the presentation of the product in islands within the main aisles. In addition to the comparison in the impact of both these initiatives, we also discuss the interaction with promotional incentives and potential synergies that this combination may causes. Not surprisingly, the role of merchandising to support promotional campaigns has been repeatedly pointed out in previous academic literature (Bolton, 1989; Ailawadi et al., 2006). Additionally, the temporary effects are also considered in these stimuli, considering possible effects of diffusion, saturation or inertia commonly referred to in the literature on the market response to commercial incentives (Van Heerde et al., 2000, 2004; Haans and Gijsbrechts, 2011).
Empirically, we based on weekly data from a hypermarket. This methodology is common in studies that analyze the impact of commercial incentives on sales of a product category (Little, 1998; Kopalle et al., 1999; Van Heerde et al., 2000, 2004; Pauwels et al., 2002). However, most studies put much stress on the longitudinal variation, what it means, they focus on temporary variations in product categories established in a closed way, that is, with very few references and very similar to each other (Van Heerde et al., 2004; Ailawadi et al., 2007). Instead, we put the attention on the transversal variations, it is, we consider a shorter sales history but in a wide category comprising many references. This quantification of effects trough many references involves that the dependent variable of interest is formalized in relative terms rather than in absolute, it is said, it is considered the variation sales instead of sales (Van Heerde et al., 2000, 2004).
The main contribution of this paper is to perform a first theoretical and empirical approach to the role of the ends of aisle and islands to stimulate purchases at the point of sale. As noted previously, the previous literature has barely differentiated merchandising initiatives and less ends of aisle and islands, to study their impact on demand, even though the need for studies in this line has been noted in recent years (Ailawadi et al., 2009; Shankar et al., 2011). The results of this study not only show that these techniques have a different impact on the purchasing decisions of consumers, but that the impact evolves differently depending on its duration, its combination with other promotional incentives or product category affected.
Then, we make a review of the previous literature concerning to the effects of merchandising on the market response leading to the formulation of hypotheses. Subsequently, we detail the methodology used in the empirical analysis and we describe the analysis and results. Finally, we discuss the main conclusions and implications of our study to managers and researchers.
Previous literature review and working hypothesesEffects of end of aisle and island on market responseSeveral studies have confirmed that using merchandising techniques in the store can stimulate sales of a product (Chevalier, 1975; Wilkinson et al., 1982; Bemmaor and Mouchoux, 1991; Narasimhan et al., 1996; Inman et al., 2009; Bezawada et al., 2009). This phenomenon is perfectly logical from the perspective of consumer behavior. For example, The Integrated Theory of Consumer Behavior by Sheth (1983) distinguished a previous planning that includes the selection of stores and a later phase focused on behavior at the point of sale. This last phase shows that consumers may change initially planned purchases or deciding new purchases during their visit and that stimulus at the store can influence these changes significantly (Cricq and Bruel, 1975; Díez-De Castro et al., 2006). Its importance increases if it is taken into account the proportion of unplanned purchases tend to be increasing (Bezawada et al., 2009; Inman et al., 2009; Bell et al., 2011). These merchandising techniques influence the early stages of the formation of the choice of purchase: exhibition, knowledge and perception (Evan et al., 2006; Amstrong and Kotler, 2007), obtaining a higher probability that the product was taken into consideration, evaluated and finally acquired. In fact, they can influence remembering a forgotten need, awakening an unknown need or managing the impulsive purchase (Inman et al., 2009). This effect is boosted because consumers tend to assume that the product which is supported by a merchandising action includes some promotion or price advantage; this fact can be interpreted as a clear example of Learning Theory or Conditioned Reflex by Pavlov (1927). Although it has been shown that this association is not always true (Inman et al., 1990), again increasing concern and/or lack of time causes the buyer was more sensitive to these signals and to be attracted by the idea of saving it (Theory of Time’ Distribution of Households, Becker, 1965).
The stimulus at the point of sale can be different types (Cricq and Bruel, 1975; Wilkinson et al., 1982; Buttle, 1984; Cooper et al., 1996; Díez-De Castro et al., 2006). This fact implies the need to analyze separately the role each one plays in the response on consumer’ purchase. In particular, it is interesting to analyze separately and comparatively the role of two types of special presentation of products at the point of sale: in end of aisle and island in the main aisles. Most of previous research has interpreted them as a single stimulus type (display). However, they have different characteristics (Samson and Little, 1988; Díez-De Castro et al., 2006; Varley, 2006):
- (a)
The end of aisle is an exposure at the end of the same shelf in which there are all products of a particular category. Thanks to this technique, the product increases its visibility from the central aisles busiest, with more traffic or transit.
- (b)
The island is the grouping or stacking of a product, out of its normal location together with the rest of the category, and it is usually located in the middle of the main aisles with more traffic of people or at the entrance to the store.
Because of this distinction, we expect that the island is a more aggressive merchandising technique and, therefore, will have a greater impact on consumer response. The island has a greater visual impact and a certain element of surprise (Díez-De Castro et al., 2006; Varley, 2006). It is located in areas of greater traffic of buyers that often follow a path shopping at the establishment (Larson et al., 2005); therefore, it is more perceptible by potential buyers and it can have more capacity to capture the attention of customers who had not even thought of getting this type of product on their visit. Being the products more exposed, consumers will increase the probability of their purchase (Burton et al., 1999; Inman et al., 2009). Furthermore, consumers associate the product’ isolation with the existence of higher discounts, which carry an increase of the willingness to buy (Smith and Burns, 1996; Valenzuela et al., 2013). Moreover, the product is often placed farther from its usual placement with rest of competing brands and this prevents price comparisons. Many buyers prefer to assume that there exists a price advantage and save their time (Inman et al., 1990; Smith and Burns, 1996).
All these previous arguments suggest that, although different merchandising techniques help stimulating sales at the establishment, the effectiveness differs from one technique to another. This effectiveness of the merchandising techniques is linked to the potential of capturing the attention of consumers and the potential to improve assessment of stimulated product by consumers. Consequently, we propose the following hypothesis:H1a The ends of aisle have a positive impact on stimulated product sales. The islands have a positive impact on stimulated product sales. The islands have a greater positive impact than the impact of the ends of aisle on stimulated products sales.
The positive effects of short-term promotions have been extensively studied in the literature; there are already such as evidences about them, that the effort of the literature has focused on the reason of their success, it means, how they work and affect the costumer’ behavior (Gupta, 1988; Blattberg et al., 1995; Pauwels et al., 2002; Van Heerde et al., 2003; Ailawadi et al., 2006; Chan et al., 2008; Leeflang et al., 2008).
Another line of research, but not yet too developed, analyzes the possible synergies between promotions and merchandising techniques, understood at aggregated terms under the terms display and feature, concluding that the joint use of merchandising and promotions (especially price discounts) can enhance the effectiveness of each of the separate techniques (Bolton, 1989; Fader and Lodish, 1990; Narasimhan et al., 1996; Van Heerde et al., 2000, 2004; Lemon and Nowlis, 2002).
On one hand, the existence of a promotional incentive can make the captured attention by means of merchandising actions become sales (Chandon et al., 2009). On the other hand, a special exhibition of products helps to draw attention to promotions, increasing their effectiveness. Furthermore, it should be noted that there is a tendency to overestimate a product or a promotional incentive when it is presented in a different way than the other competitors (Inman et al., 1990; Smith and Burns, 1996; Valenzuela et al., 2013).
Starting from the positive synergistic effect between the merchandising (commonly understood as ‘display’) and promotions, we expect this effect remains positive if the merchandising techniques are broken down in end of aisle and islands. Both techniques, despite their different characteristics, have a common objective, which is simply to boost and encourage stimulated product’ purchase (Samson and Little, 1988; Bemmaor and Mouchoux, 1991) trying to optimize selling space (Mourton, 1990). While promotions attract attention of a set of price-sensitive buyers, merchandising techniques, both end of aisle and island, do it on more impulsive buyers who need less information (Cricq and Bruel, 1975; Inman et al., 1990; Mourton, 1990; Díez-De Castro et al., 2006). However, the special presentations of the products also serve to give greater visibility to stimulated products and help to spread out the promotional efforts made on them, it means, they provide consumers become aware of promotions (Blattberg et al., 1995; Smith and Burns, 1996; Lemon and Nowlis, 2002). This helps consumers to value the proposal of saving money, and ultimately, it promotes the test of product and brand switching (Samson and Little, 1988; Bezawada et al., 2009). Consistent with this, we propose the following hypothesis:H2a The combination of ends of aisle with price promotions produces a positive synergistic effect. The combination of islands with price promotions produces a positive synergistic effect.
However, although the two techniques have a positive synergistic effect, it is possible that promotions¿ moderation occur with different intensity. The island is a more aggressive stimulus and it is located far of its usual placement (Díez-De Castro et al., 2006; Varley, 2006). Therefore, it has a greater effect on impulsive buyers which do not need to walk up the aisle, where the rest of competing brands are, in order to compare prices or other information (Inman et al., 1990). In many cases, they even assume significant price discounts on products placed on the islands even if they do not have one (Smith and Burns, 1996). Because of this, price discounts may be less relevant in these decisions. Consequently, the combination with a price promotion may have a lower potentiating effect. Instead, the ends of aisle are in the end of the shelf where the competing brands are located. Many consumers attracted to this presentation who had decided to buy this type of product and, in any case, they have a faster access to the comparison between the different alternatives (Valenzuela et al., 2013). It is to remember that one of the objectives of the ends of aisle, usually mentioned in the literature, is to attract consumers to a particular area of the establishment (Samson and Little, 1988; Varley, 2006). The possibility of a faster comparison between different brands entails that the success of an end of aisle is more conditioned to the existence of any incentive that once captured the attention of consumers motivates them to buy. In other words, the contribution of the ends of aisle is more linked to the potentiation of the effect of promotions than the only capture impulsive purchases. Therefore, we expect the combination ends of aisle with a promotion markedly intensify the effect on sales (Varley, 2006). So:H2c The synergistic effect between end of aisle and price promotion is bigger than synergistic effect between the island and price promotion.
Several previous academic contributions have approached the impact of promotions from a time perspective and have tried to study its short-term and long-term consequences (Gupta, 1988; Blattberg et al., 1995; Pauwels et al., 2002; Van Heerde et al., 2003; Ailawadi et al., 2006; Chan et al., 2008; Leeflang et al., 2008; Haans and Gijsbrechts, 2011). In this regard, we note that there is no clear consensus in the literature.
We can distinguish two main issues related to the impact of a commercial stimulus: on one hand, the development of sales when the stimulus is prolonged and, on the other hand, the development of sales once the stimulus have finalized. Focused primarily on the extension of the stimulus and also in the context of promotions, the academic literature provides two opposing effects. The stimulus diffusion between consumers can generate promotion requires a period of time to impact on sales. That is, sales would grow as the promotion prolong during a reasonable time (Blattberg et al., 1995). Instead, the initial use of the advantages of a promotion can also make its interest fall down when it is prolonged (Díez-De Castro et al., 2006). In short, the promotion’ effect on sales tends to decrease because the number of consumers who can benefit from it is more reduced (Mela et al., 1998; Kopalle et al., 1999; Macé and Neslin, 2004; Ataman et al., 2010).
Now, focused on the stimulus termination, most authors support the idea that during the promotion disloyal buyers are attracted and, therefore, when they return to buy the same product category, they buy the promoted model at that time (Volle, 2001). In addition to this, whether buyers are loyal or not, it can exist a stockpiling effect which will reduce sales in next weeks (Blattberg and Neslin, 1989; Blattberg et al., 1995; Kopalle et al., 1999; Van Heerde et al., 2000, 2004; Pauwels et al., 2002). This post-promotion negative effect can last between 6 and 8 weeks depending on the characteristics of product category (Van Heerde et al., 2000, 2004; Pauwels et al., 2002; Ataman et al., 2010).
However, others researchers support the idea that there is no temporary effect remarkable because sales returns to the same level after the promotion (Bawa and Shoemaker, 1987; Vilcassim and Chintagunt, 1995). Even, some researchers defend the idea that there is a positive effect after the promotion, because the test is habit forming (Keane, 1997) or create booster purchase (Ailawadi et al., 2007), which would be consistent phases with purchasing choice models (Evan et al., 2006Amstrong and Kotler, 2007). As an evidence of consensus do not exist, it includes various works by the same research group provide conflicting evidence on the effects post-promotional (Neslin et al., 1985; Neslin and Shoemaker, 1989; Blattberg and Neslin, 1989, 1993; Neslin and Stone, 1996; Macé and Neslin, 2004; Ailawadi et al., 2007).
We are not aware of this potential post-promoting effect has not been studied in the case of merchandising techniques, specially whether we distinguish between ends of aisle and islands.
However, the goal of merchandising techniques is to highlight, show and make the product known and, finally, cause a switch (Samson and Little, 1988). Thus, it is expected that the positive effect of ends of aisle and islands techniques will be consolidated during the period of stimulation, bearing in mind that these periods are not too extended as recommended in some studies, such as Samson and Little (1988) and Díez-De Castro et al. (2006). Similarly, it is expected that the positive effects after the conclusion of these presentations are greater than the negative effects.
The ends of aisle contribute to the visibility of the products and some of the attracted customers will continue to buy the stimulated product. However, we do not expect a large negative effects resulting from the anticipation of purchases and stockpiling of products, unless there is a promotional incentive that leads consumers to predict a loss for future purchases (Blattberg et al., 1995; Van Heerde et al., 2000, 2004; Pauwels et al., 2002; Ataman et al., 2010). Thus, the hypotheses in this regard are:H3a The temporary extension of an end of aisle has a positive effect on stimulated product’ sales. The temporary extension of an island has a positive effect on stimulated product’ sales. The end of aisle has a positive effect on product’ sales once the stimulus is concluded. The island has a positive effect on product’ sales once the stimulus is concluded.
The data used in this study has been compiled from a hypermarket that belongs to one of the ten product distribution chains with the highest sales rates in Europe (International Private Label Consult, 2011). These data offer information on sales rate, merchandising techniques, and sales prices during a time period of ten weeks for all the products registered under two big categories: milk and liquid soap or gel. The information about merchandising techniques, especially at end of aisle and islands was verified on site.
The reason for choosing such two different categories of product is due to the numerous previous studies which have proven that the characteristics of the product object of study are crucial in evaluating the effects of promotions and other merchandising techniques applied (Gupta, 1988; Bemmaor and Mouchoux, 1991; Blattberg et al., 1995; Pauwels et al., 2002; Jones et al., 2003; Ailawadi et al., 2006; Inman et al., 2009). These two product categories can provide information about opposite variables, such as the frequency of purchase or the expiration of the product, as milk presents a higher purchase frequency and a lower expiration period than liquid soap or gel. Furthermore, other differences such as the number of competitors or the concentration of the category can be observed. Within these two categories, all the products that showed a market share as low as 0.05% or lower were ruled out from the study, due to the fact that their data would barely contribute to the merchandising techniques and sales rate variables that are object of our study. The main data collected from the samples are shown in Table 1. It shows the number of references and observations collected for each product category, as well as the effects of merchandising techniques and price promotions.
Sample descriptive.
| Sample | Milk | Liquid soap | ||
|---|---|---|---|---|
| No. of products | No. of observations | No. of products | No. of observations | |
| 69 (13 brands) | 690 | 137 (37 brands) | 1370 | |
| Merchandising | ||||
| Ends of Aisle | 14 (20.29%) | 47 (6.81%) | 42 (30.36%) | 87 (6.4%) |
| Islands | 27 (39.15%) | 56 (8.12%) | 7 (5.11%) | 31 (2.26%) |
| Promotions | ||||
| Discounts | 57 (82.61%) | 207 (30.00%) | 40 (29.20%) | 185 (13.5%) |
The method used for this study differs from that of other multiple studies in this field. While most studies compile data about a few product references during long periods of time, our study compiles data on a large number of product references during a short period of time. This method will provide higher chances of generalizing the results obtained from the study. However, this method also implies that, due to the need of comparing sales from very different product references, the dependent variable will have to be studied from a relative perspective, rather than absolute. For this very same reason, the dependent variable object of our study is the variation of sales compared to the average sales of the same product within the period of time in which it was not stimulated with any type of price promotions or any other merchandising techniques.
The explanatory analysis is based on a multiple regression analysis. Firstly, in order to analyze the effect of end of aisle and islands on sales rates and its interaction with the price promotions, the following functional relation was proposed:
where
- -
SVit marks the sales variation of the product reference i during week t compared to the average sales rate of the same product reference during the weeks in which it was not stimulated.
- -
SVCit is a control variable that marks the sales variation of the product category as a whole during week t in regard to the average sales rate of the ten-week period of the study.
- -
EOAit is a binary variable that has no null value when the product reference i was displayed on the end of aisle during week t.
- -
EOACOMit represents the actions of the competitors of the product reference i during week t regarding ends of aisle. It was calculated with a sum of the EOAit variable for all the competitors during week t, although it was weighted by the market share (except for i) of each competitor.
- -
ISLit is a binary variable that has no null value when the product reference i was displayed on the islands during week t.
- -
ISLCOMit represents the actions of the competitors of the product reference i during week t regarding the islands. It was calculated with a sum of the ISLit variable for all the competitors during week t, although it was weighted by the market share (except for i) of each competitor.
- -
PROit marks the price discount on the product reference i during week t, as a proportion over the regular price.
- -
PROCOMit represents the average discount level expressed as a percentage of the competitors of the product reference i during week t. It was calculated with a sum of the PROit variable for all the competitors during week t, although it was weighted by the market share (except for i) of each competitor.
In order to analyze de temporary effects, the following functional relation was proposed:
where the new variables in comparison to Model 1 are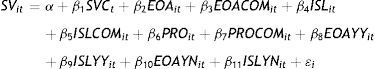
- -
EOAYYit is a binary variable that has no null value when the product reference i was displayed on the end of aisle during week t having been stimulated during the previous week t−1, too. It shows weeks in which end of aisle is prolonged.
- -
ISLYYit is a binary variable that has no null value when the product reference i was displayed on the islands during week t having been stimulated during the previous week t−1, too. It shows weeks in which island is prolonged.
- -
EOAYNit is a binary variable that has no null value when the product reference i was NOT displayed on the end of aisle during week t having been stimulated during the previous week t−1. It shows weeks in which end of aisle concludes.
- -
ISLYNit is a binary variable that has no null value when the product reference i was NOT displayed on the islands during week t having been stimulated during the previous week t−1. It shows weeks in which island concludes.
Table 2 shows the estimation results for the proposed model, which is aimed at analyzing the direct effects of the end of aisle and islands, as well as the moderating role that price promotions play. For each one of the product categories were proposed three models: the first one studies only the direct effects of end of aisle and islands, the second one studies the effects of the price promotions too, and the third one includes the interactions between these two elements.
Effects of ends of aisle and islands and interactions with price promotion.
| Milk | Liquid soap | |||||
|---|---|---|---|---|---|---|
| Model 1 | Model 2 | Model 3 | Model 1 | Model 2 | Model 3 | |
| Constant | 0.397 | 0.447 | 0.452 | 0.361*** | 0.161 | 0.181 |
| Sales variation of category | 0.169 | 0.215 | 0.215 | 0.987*** | 0.859* | 0.914** |
| End of aisle | 0.223* | 0.252* | 0.318** | 3.688*** | 3.689*** | 3.331*** |
| Ends of aisle of competitors | −0.010* | −0.016* | −0.016* | −0.025** | −0.026** | −0.023** |
| Island | 1.006*** | 1.065*** | 1.014*** | 1.379*** | 1.202*** | 1.146*** |
| Islands of competitors | −0.040* | −0.041* | −0.041* | 0.021 | 0.037 | 0.033 |
| Discount | 4.846*** | 1.128* | 6.611*** | 6.234*** | ||
| Average discount of competitors | −0.084 | −0.087 | 5.660 | 3.674 | ||
| Interaction end of aisle-discount | 3.715 | 26.891*** | ||||
| Interaction island-discount | 2.783 | 1.517 | ||||
| R2 | 0.094 | 0.167 | 0.169 | 0.175 | 0.280 | 0.290 |
| F ANOVA | *** | *** | *** | *** | *** | *** |
The results show that the two merchandising techniques, both the end of aisle and islands, have a significant and positive effect (p<0.01, except for the end of aisle in the milk category, in which p<0.10). These results conclude that after analyzing the merchandising efforts within the two techniques previously mentioned, both of them have positive effects on the merchandised product sales. This result confirms H1a and H1b. It was also observed that the variables that gather the efforts from the competitors have an opposite influence on the sales of a specific product reference, that is to say, the more items from the competitors are stimulated with these merchandising techniques, the less will the sales of the product reference be. This result shows that the analyzed merchandising techniques work well, as they increase the sales of stimulated reference at the expense of not stimulated ones.
There exist also differences between the two product categories in terms of relative importance of end of aisle and islands (test difference of parameters for island and end of aisle in model 1: F=17.45, p<0.01, for milk, and F=49.05, p<0.01, for gel). The results for the milk category are aligned with H1c: islands are more effective than ends of aisle. However, this effect turns out to be the opposite one in the case of the liquid soap or gel. So, we must reject H1c. This difference is due to the characteristics of each category. Milk has a high frequency of purchase, and given this fact consumers do not plan on buying it, as they are already used to purchasing it without the necessity of writing it down on the grocery's list. Thus, the effectiveness of milk products targeted with merchandising techniques is higher when displayed in main aisles as they are more perceptible there (Varley, 2006; Inman et al., 2009). In addition, being milk a frequently consumed product, various profile customers might “get tired” of consuming the very same product. Therefore, customers are more predisposed due to their willingness to innovate or due to their supposed knowledge of the category and, consequently less risk perception, to switching to a different brand (Laurent and Kapferer, 1985; Chaudhuri, 2000). On the contrary, if the customer has written down a certain product category on his or her grocery's list, that customer will most likely head to the aisle where that product category is located and, as a consequence, will be more influenced by commercial stimulus such as the end of aisle (Inman et al., 2009). Either way, results confirm that the relative importance of the ends of aisle and islands may depend on the nature of the product that is being stimulated.
On the other hand, regarding price promotions, results show that the bigger is the price discount on the product, the higher the sales rate will be for both product categories. No significant connections were found for the promoting actions of the competitors. It is worth mentioning, however, that the promoting efforts for a product reference can also stimulate the sales of other product references (Leeflang et al., 2008). When a product reference is stimulated, this reminds the customers that they need that product, or that they are going to need it within a short period of time, therefore the overall sales rate of the whole category will raise (Pauwels et al., 2002; Leeflang et al., 2008; Parreño-Selva et al., 2009).
Regarding the synergetic effect between the merchandising techniques and the promotions, there exist several differences in the results for each one of the techniques studied. Results show that for the island the effect is not significant, while for the end of aisle, as well as having more importance in both product categories, the effect is significant (p<0.01) in the case of the gel and significant higher in comparison with the effect of end of aisle (test difference of interaction parameters in model 3: F=6.05, p<0.05, for gel). This result makes we must reject H2b, because the effects are positive but not significant. Although it is in line with H2a and H2c, at least for gel category. It all seems to proof that the end of aisle plays a more decisive role when complementing the price promotions. Less impulsive and more price-oriented customers feel more attracted to price promotions, and the end of aisle become more useful for making the promoted products stand out, therefore empowering the effects of the promotions. This effect is less noticeable in the case of the islands, due to the fact that the price-sensitive customer is more likely to look for information (Inman et al., 1990), which leads the customer to head to the aisle where the analyzed product is located in order to compare the different options. This way, the end of aisle will have a more synergetic effect with the price discounts due to its proximity to other competitors’ references, which allows customers to compare their prices and therefore notice this additional discount. Either way, the differences observed from the product categories seem to point out that the nature of the product category plays a moderating role in the effects of the commercial stimulus studied. This result is in line with numerous previous studies (Bolton, 1989; Raju, 1992; Pauwels et al., 2002; Macé and Neslin, 2004).
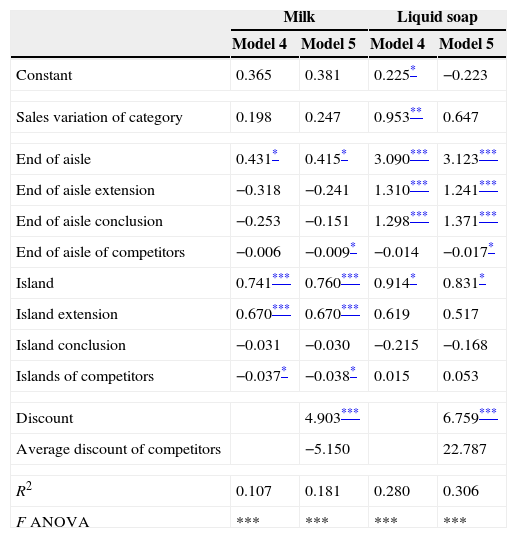
Temporary effectsTable 3 shows the estimation result for the second model proposed, aimed at analyzing the temporary effects resulting from the extension or the finalization of end of aisle and islands.
Temporary effects.
| Milk | Liquid soap | |||
|---|---|---|---|---|
| Model 4 | Model 5 | Model 4 | Model 5 | |
| Constant | 0.365 | 0.381 | 0.225* | −0.223 |
| Sales variation of category | 0.198 | 0.247 | 0.953** | 0.647 |
| End of aisle | 0.431* | 0.415* | 3.090*** | 3.123*** |
| End of aisle extension | −0.318 | −0.241 | 1.310*** | 1.241*** |
| End of aisle conclusion | −0.253 | −0.151 | 1.298*** | 1.371*** |
| End of aisle of competitors | −0.006 | −0.009* | −0.014 | −0.017* |
| Island | 0.741*** | 0.760*** | 0.914* | 0.831* |
| Island extension | 0.670*** | 0.670*** | 0.619 | 0.517 |
| Island conclusion | −0.031 | −0.030 | −0.215 | −0.168 |
| Islands of competitors | −0.037* | −0.038* | 0.015 | 0.053 |
| Discount | 4.903*** | 6.759*** | ||
| Average discount of competitors | −5.150 | 22.787 | ||
| R2 | 0.107 | 0.181 | 0.280 | 0.306 |
| F ANOVA | *** | *** | *** | *** |
The results obtained are in line with the ones obtained in the previous model, although in this case the extension of the stimulus is explicitly studied. Once again, the effects of displaying islands are more noticeable than ends of aisle in the case of milk category products, while the effects are the opposite in the case of the gel. For both categories, an extension of the most effective stimulus, that is to say, the islands for the milk and the ends of aisle for the gel have positive and significant effects. In other words, a diffusion effect happens that increases the sales rates during the later weeks to the implementation of the stimulus. This result partially confirms H3a and H3b. No significant signs of a saturation effect are observed in any case, that is to say, a reduction of the impact of the stimulus within the following weeks to its implementation. It is important to bear in mind that both the end of aisle and the islands tend to exist for a reduced period of time (around 2 or 3 weeks maximum), which prevents these negative effects.
Regarding the effects of the termination or finalization of the stimulus, only positive effects are observed in the case of the end of aisle for the gel category. This implies that there exists an inertial effect due to the familiarization of the customers with the product reference that is stimulated, in line with previous works as Neslin and Stone (1996), Keane (1997), or Ailawadi et al. (2007); which counteracts the possible negative effect of an accumulation of such reference by the customers. No significant effects were observed for the remaining stimulus and categories. This result partially confirms H4a, while it shows no evidence in favor of H4b.
Table 4 summarizes the obtained results regarding analyzed hypothesis.
Summarize of hypothesis and results.
| Hypothesis | Expected effects | Results | |
|---|---|---|---|
| Milk | Liquid soap | ||
| H1a | The ends of aisle have a positive impact on sales. | Confirmed | Confirmed |
| H1b | The islands have a positive impact on sales. | Confirmed | Confirmed |
| H1c | The islands have a greater impact than the ends of aisle on sales. | Confirmed | Contrary effect |
| H2a | The synergistic effect between ends of aisle and price promotions. | Not confirmed | Confirmed |
| H2b | The synergistic effect between islands and price promotions. | Not confirmed | Not confirmed |
| H2c | The synergistic effect between end of aisle and promotion is bigger than synergistic effect between the island and promotion. | Confirmed | Confirmed |
| H3a | The temporary extension of an end of aisle has a positive effect on sales. | Not confirmed | Confirmed |
| H3b | The temporary extension of an island has a positive effect on sales. | Confirmed | Not confirmed |
| H4a | The end of aisle has a positive effect on sales once it is concluded. | Not confirmed | Confirmed |
| H4b | The island has a positive effect on product’ sales once it is concluded. | Not confirmed | Not confirmed |
Despite the growing importance of merchandising techniques in the communication budget, there exist not many studies that analyze and compare the effects of different tools. We respond to the demand of researches and provide empirical evidences about the effect of the two most importance merchandising techniques, ends of aisle and islands, on sales rate. Additionally, we have provided evidences about the effects of its combination with price promotions and its prolongation or interruption in time. The results confirm the importance of both stimuli, ends of aisle and islands, in capturing the attention of consumers and encourage sales. They also suggest that ends of aisle play a greater role in supporting price promotions, in line with its greater proximity to other brands that make up the product category and easy to make comparisons without much extra effort. The results also suggest that the extension and termination of the period of stimulation are aspects to be taken into account in assessing the overall impact of the stimuli of merchandising. A reasonable extension in time contributes to the consolidation of the positive effects on sales.
The results are useful for manufacturers and retailers in order to achieve the most favorable response from consumers who visit the point of sales. The unplanned purchases in store are growing and they are largely influenced by commercial incentives within it (Bezawada et al., 2009; Inman et al., 2009; Bell et al., 2011). For this reason, it is vital to understand the idiosyncrasies of each merchandising tool to optimize its application.
A first implication of this study, from an academic and a professional point of view, is the need to analyze separately the different stimuli of merchandising. The majority of empirical academic studies simplify these stimuli to a single variable, without considering explicitly the differential effects of the various initiatives. We show that, even though all the merchandising techniques have favorable effects on sales rates, their role is very different. Although we only analyze two categories of product, in both cases there exist a differential impact between the ends of aisle and the islands. Obviating these differences is a waste of opportunities to optimize merchandising strategy.
As a second implication for management, we must stress the importance of merchandising techniques as complements to other commercial stimuli, including promotional ones. Moreover, every merchandising stimulus has very different potential supporting promotional campaigns because they differ in their ability to influence on different types of consumers, for example, the price sensitive ones or the impulsive ones. The joint use of merchandising and promotional stimuli may be another important aspect to optimize the contribution of consumers at the point of sale. For example, we should note that ends of aisle attract the buyer's attention to the area in which are located other competitor references, which presents a lower cost of searching information and a greater access to comparing prices, formats, etc. This fact makes advisable to add a promotional incentive so that the buyer believes that the stimulated brand is the best choice. On the contrary, the islands do not require offering a promotional incentive because they are focused on influencing the impulsive buyers which are less concerned about the price. The consumers often attribute promotional benefits even if they do not exist. Moreover, the location of the islands makes the comparison with other competing brands less accessible.
Another important implication to consider is the relevance of the temporary perspective in planning merchandising stimuli. The same way it happens with promotional incentives, we should take into account both diffusion and saturation effects that may result from the extension of the stimulus, such as the effects of inertia or relapse from the termination of the stimulus. Therefore, in order to get the best performance of a campaign, besides the selection of stimulus merchandising and its combination with other commercial stimuli, we must consider the stimuli’ duration. In this regard, merchandising actions can benefit from a moderate extension that allows their dissemination to customers. Additionally, the ability of merchandising activities to capture new customers can prolong the positive effects after the campaign.
A last implication, of great importance, is the role played by product category. Aspects such as purchase frequency, expiration date or hedonic or impulsive character are crucial for studying the impact of different merchandising or promotional stimuli, because they are associated with the perceived risk, the accelerating of purchase or stockpiling, which may cause enormous changes in the results. Several previous studies have already demonstrated the moderating role of very diverse product’ characteristics on the impact of commercial incentives. For example, purchase frequency (Fader and Lodish, 1990; Bawa, 1996; Narasimhan et al., 1996; Ailawadi et al., 2006Inman et al., 2009) or expiration (Gupta, 1988; Pauwels et al., 2002). Also, the impulsive nature of the category (Jones et al., 2003) beyond the consumer impulsiveness may be a key moderating the impact of promotional stimuli in different product categories.
The results of this study should be interpreted with some caution. The paper focuses exclusively on two product categories with different trends regarding the use of this type of stimuli. Furthermore, it has had only a limited time period.
Therefore, the analysis may be influenced by the frequency of use of the techniques of merchandising and price promotions in these categories, and their combined use. Finally, we have not considered some characteristics of the analyzed techniques, such as the distance between the special and the usual presentation, or commercial stimuli: some linked to merchandising, for example the use of posters, and others linked to the external product diffusion, for example the use of flyers or brochures.
This research was supported by Ministerio de Educación y Ciencia, Grant ECO2011-23381 (Spain).