


This paper seeks to shed further light on the capital budgeting techniques used by Spanish companies. Our paper posits that the gap between theory and practice might be related to the nature of sources of value and to the efficiency of mechanisms aligning managerial and shareholder incentives, rather than to resource restrictions or model misinterpretation. We analyze data from a survey conducted in 2011, the final sample comprising 140 non-financial Spanish firms. Our findings show a behaviour pattern similar to that reported in prior research for firms in other countries. Particularly noteworthy is that payback appears to be the most widely used tool, while real options are used relatively little. Our results confirm that size and industry are related to the frequency of use of certain capital budgeting techniques. Further, we find that the relevance of growth opportunities and flexibility is an important factor explaining the use of real options.
Widespread opinion among scholars and practitioners is that a firm's future success and survival ultimately depend on it getting its current investment decisions right. In their renowned handbook on Corporate Finance, Brealey, Myers and Allen state that a good investment remains good business even if it is not optimally financed, but that a bad investment will be a wrong decision even with the best financing policy (Brealey et al., 2010). Paradoxically, Michael J. Brennan noted that in 1995 a finance instructor had much more to say about financial policy than about capital budgeting (Brennan, 1995).
Recent financial research has helped cover some of the gaps in the investment decision-making problem from various angles. Agency theory has helped us understand that certain inefficiencies observed in corporate investments may be explained by the conflict of interests between insiders and outsiders in a context of imperfect information. Behavioural finance has shown how cognitive biases determine unintended decisions made by financial managers. The real options approach has provided new tools suited to reflecting the value of both the tangible and intangible results to emerge from corporate resource allocations. Finally, the literature on corporate finance practices has helped pinpoint and explore the gap between theory and practice.
Our paper focuses on the latter research line, which emerged over half a century ago with Miller's (1960) and Istvan's (1961) studies on capital budgeting practices in U.S. companies, and has subsequently been updated and has spread with evidence from a wide range of countries. As a whole, this literature reveals that managers use multiple techniques, some of which are theoretically appropriate, while others are less so. The most popular evaluation techniques are Net Present Value (NPV), Internal Rate of Return (IRR), and Payback (PB), along with more sophisticated models, such as real options and simulation. Besides extending and empirically illustrating the use of different theoretical stringency techniques, these studies suggest that certain firm characteristics – such as size – and managerial factors – such as education – may help to explain the choice of capital budgeting tools.
The purpose of this paper is twofold: firstly, to extend and update the empirical evidence available on capital budgeting practices in Spanish companies; and, secondly, to shed further light on the factors explaining the choice of capital budgeting tools by examining the possible influences of sources of value creation and mechanisms aligning managerial and shareholder incentives. According to our hypothesis, the ‘theory–practice’ gap may be partially explained by (i) the relevance of growth options and flexibility among a firm's sources of value and (ii) the effectiveness of governance mechanisms such as debt or managerial ownership in aligning interests. Should these hypotheses prove to be right, using of more simple practices may merely be a question of convenience or suitability rather than companies’ resources restrictions or managers’ lack of knowledge.
The empirical approach is performed using information obtained from a total of 140 questionnaires answered by Chief Financial Officers (CFOs) of Spanish companies in February 2011. As with evidence from other countries, our analysis indicates that CFOs adopt investment decisions based on information from combining multiple capital budgeting methods. Results indicate that the most commonly used techniques, in order, are as follows: PB, IRR and NPV, with few companies using real option models. How often discounted cash flow techniques are used is partially driven by the variables of industry and company size. CFO profile does not appear to be a relevant factor in explaining capital budgeting practices in Spanish firms. Regarding real option models, our results indicate that their use depends mainly on the relevance of flexibility and growth options as company value sources and, to some extent, on certain incentive alignment mechanisms.
The remainder of the work is organized as follows: the second section reviews previous literature. The third section sets out the hypotheses. The fourth section describes data collection, sample and econometric models. Descriptive results as well as the test of explanatory hypotheses are shown and discussed in the fifth section. The work concludes with a discussion of the main results and limitations.
Theory and practice of capital budgeting practicesInterest in understanding the practices used by CFOs when deciding which investment opportunities to undertake first emerged in the early 60s. Studies by Miller (1960) and Istvan (1961) on U.S. companies herald the beginning of a series of diagnostics in companies worldwide, which continues to the present day. Evidence in the 60s and 70s reflected a certain managerial tendency to gradually use theoretically superior models based on discounted cash flows. At the same time, certain studies began to report an increasing gap between financial theory and firms’ practices. Through an in-depth analysis of eight cases, Mao (1970) found that managers preferred to use simple tools such as PB or the accounting profit criteria, as opposed to models which were more appropriate from a theoretical perspective, such as NPV or IRR. Two years later, Klamer (1972) concluded that the “new” advanced theory in the 50s was put into practice as of the 70s.
Since then, the ‘theory–practice’ gap has continued to grow, firstly due to greater scientific production in finance and secondly due to the gradual adoption of new capital budgeting tools by firms, similar to the gradual acceptance of other corporate decision-making techniques (Triantis, 2005), but lagging far behind the speed with which entrepreneurs have embraced other kinds of innovations.
Recent literature shows that, broadly speaking, managers continue to use simple tools which are theoretically less appropriate and accurate, while more recent and sophisticated techniques are relegated to analyzing specific investment projects in just a few large companies (Verbeeten, 2006). From a theoretical standpoint, the most widely recommended ‘Corporate Finance’ handbooks have preached the superiority of models such as NPV and real options since the mid-nineties.3 Said academic literature establishes that NPV and real option models provide a direct estimate of each investment's contribution to the value creation objective. Both models calculate the expected net increase in a firm's market value driven by undertaking an investment, which is defined by the difference between what will be obtained (the project's value) and what has to be paid (the project's price). NPV calculates the project's value from the expected cash flows to emerge and the main financial principles such as the time value of money and the risk-return market relation. The real options model extends traditional NPV to incorporate the value of ‘growth’ and ‘flexibility’ options: possible actions to be taken in response to new information over time.
In contrast to this almost universal consensus among academics favouring NPV and real options, corporate practice has shown PB and IRR to be the preferred tools of managers in most companies. Papers such as Block (1997), Payne et al. (1999) and Graham and Harvey (2001) indicate that PB and IRR remained the most popular tools among managers in U.S. companies by the end of the 90s. More recently such preferences seem to have been inverted in some countries. NPV is the most widely used method in Anglo-American countries like the U.S. (Ryan and Ryan, 2002), Canada (Bennouna et al., 2010; Baker et al., 2011a), the UK (Alkaraan and Northcott, 2006), and Australia (Truong et al., 2008). However, in other European countries and Asia the prevalence of IRR and particularly of PB continues to increase. This is the case of Germany (Brounen et al., 2004; Sridharan and Schuele, 2008), Sweden (Holmen and Pramborg, 2009), and Spain (Iturralde and Maseda, 2004), in Europe; or Japan (Shinoda, 2010), China (Hermes et al., 2007), Hong Kong and Singapore (Kester et al., 1999; Leon et al., 2008), in Asia. Table 1 shows a summary of the empirical evidence on the most frequently used methods in different countries.
Most commonly used capital budgeting technique. This paper shows prior studies on capital budgeting practices according to the sample's country and most frequently used technique. Columns indicate the most commonly used technique, where DCF=discounted cash flow methods (NPV or IRR); NPV=Net Present Value; IRR=Internal Return Rate; PB=payback; RO=real options; ARR=accounting rate of return; ROI=return on investment.
The finance literature has sought to explain the gap between what is theoretically right and what is actually preferred in practice. Most explanations are connected with managers’ preferences and limitations. For example, the strong preference for IRR is explained by the fact that the information provided “fits” in better with managers’ cognitive process (Evans and Forbes, 1993). Burns and Walker (1997) and Cohen and Yagil (2007) suggest that IRR is chosen because managers are more comfortable with percent values, which facilitate comparison among projects and with hurdle rates or multiple and daily financial references (such as capital costs, interest rates, risk premiums and inflation). PB seems to be chosen due to its ease of computation and understanding. Although a liquidity criterion, managers use it to “provide a quick look at risk” (Burns and Walker, 1997), as a consequence of managers’ cognitively associating quick recovery with less exposure to future uncertainty. Managers’ lack of confidence and risk aversion also help to explain that ‘old’ and ‘familiar’ practices are not abandoned but continue to be used as a complement to results obtained from more recent and theoretically appropriate proposals (Stanley and Block, 1984; Kim et al., 1986). By accumulating multiple models and results, managers may feel that their analysis is enriched and their responsibility is reduced (Arnold and Hatzopoulos, 2000), as a consequence of “the more the merrier” approach (Pike, 1996).
Such arguments suggest that the ‘theory–practice’ gap is mainly caused by practitioner deviation: managers fail to apply the models that should be used. Much of the empirical literature suggests that if simple practices prevail over more appropriate approaches, it is due to the net balance of the costs and benefits involved in acquiring analytical and computing tools and hiring highly-qualified staff able to adopt sophisticated models (Verbeeten, 2006; Block, 2007). This hypothesis has been tested by exploring the relationship between the frequency of use of different capital budgeting techniques and a number of characteristics of the firm and its managers.
Empirical results show that a firm's capital budgeting practices mainly depend on its size (Schall et al., 1978; Block, 1997; Brounen et al., 2004; Danielson and Scott, 2006; Sridharan and Schuele, 2008), industry (Schall et al., 1978; Schall and Sundem, 1980; Block, 2005; Rayo et al., 2007), uncertainty sources (Verbeeten, 2006) or the home country's level of economic development (Hermes et al., 2007). Along with these firm characteristics, managers’ profile is also found to influence capital budgeting practices. Education (Graham and Harvey, 2001; Brounen et al., 2004), age (Graham and Harvey, 2001; Hermes et al., 2007) and involvement in the decision-making process (Rayo et al., 2007) are three of the variables which show the greatest explanatory power. Overall, these results suggest that larger companies – and presumably those with more resources – respond to greater investment uncertainty by hiring managers with suitable competences and interest in adopting more sophisticated practices (Verbeeten, 2006).
HypothesesThe relation between a firm's size and its managers’ education and capital budgeting practices, as shown by empirical evidence, may be interpreted in terms of access to sophisticated quantitative models. Yet, said features can hardly justify the choice of estimating a project's PB instead of calculating its NPV. Once the complex task of predicting future cash flows is completed, the additional complexity of NPV vis-à-vis PB is confined to a basic understanding of finance principles and indeed not even that if PB is computed in its discounted version.
A complementary explanation might be based on the misalignment of manager and shareholder incentives and the nature of a firm's sources of value. Jensen and Meckling (1976) and Myers (1977) helped us understand the influence of incentive systems and control mechanisms on the efficiency of corporate behaviour. Managerial discretion, misaligned interests and information asymmetries explains why corporate decisions may diverge from optimal ones. In a context of incomplete contracts and imperfect observation, corporate investment decisions may be used to satisfy managerial interests at the expense of shareholder wealth. Apart from perquisite consumption or non-pecuniary benefits, managers may derive private benefits from promoting unprofitable investments which, for instance, reduce the risk of their undiversified human capital, increase the size and future budget of their business units or produce short-term cash flows linked to their own remuneration.
The misalignment of interests that drives inefficient corporate investments will have a more ‘deliberate’ impact on managerial decision-making and choice of capital budgeting techniques (Triantis, 2005). In fact, the use of PB is clear evidence of such problems. Managerial interest in future promotion, salary increase, or simply reappointment, explain their desire to achieve short-term performance and subsequent use of ‘payback’ metrics. The longer the time required to reach the break-even point, the greater the risk assumed, not by shareholders, but by managers who regularly have to report to investors for their capital investments decisions based on actual short-term earnings.
Something similar happens with the use of IRR versus NPV. Although both NPV and IRR achieve the same result with regard to the acceptance of single projects, they may report contrary proposals when selecting among mutually exclusive projects. One reason is that NPV is an absolute measure of value creation, whereas IRR is a relative measure of the return per unit of capital invested. When comparing projects with different sizes (outlays), IRR opts ceteris paribus, for projects which require a smaller outlay and thereby involve less reliance on external capital sources, with managerial action being subject to control market supervision less often.
The tendency towards cash-consuming long-term performance projects is even greater when applying real option models. One main advantage of real options is to provide appropriate value measures for investments whose results are partly intangible and that only after later-stage commitments are transformed into cash flows. The use of real options encourages riskier projects to be accepted whose values come from their embedded opportunities for growth/abandonment in the future. Due to their real options, these projects may generate shareholder value although immediate results may prove unattractive vis-à-vis achieving managers’ career objectives.
The agency theory has extensively studied a wide range of mechanisms which may influence efficiency in a firm's investment behaviour. Among the mechanisms that contribute to aligning managerial and shareholder incentives, the financial literature has studied the role played by debt or managerial ownership (Harris and Raviv, 1991). Debt disciplines managers by imposing a regular commitment to pay out interest and make principal repayments, limiting manager access to ‘free cash-flow’ which might be used on unprofitable investments. Failing to attend debt obligations threatens not only shareholder wealth and business continuation, but also – and firstly – managers’ position and reputation (Jensen, 1986). Managerial ownership directly brings managers’ interests into line with those of shareholders, thereby reducing the likelihood of encouraging opportunistic investments aimed at satisfying managers’ own interests. As managers increase their ownership stake, they are more likely to employ available resources in creating value (Jensen and Meckling, 1976; Jensen, 1993; McConnell and Servaes, 1995).
We argue that the same incentive alignment mechanisms which influence investment behaviour may affect the choice of theoretically appropriate capital budgeting tools. According to Brounen et al. (2004), firms that attempt to maximize shareholder wealth are likely to use theoretically correct capital techniques. Baker et al. (2011a) claim that weaker corporate governance in Canadian firms results in a failure to use corporate finance practices that maximize shareholder value. Triantis (2005) considers that applying real option models by managers requires deliberate alignment of managerial and shareholder incentives. Prior empirical evidence provides some support for such an influence on capital budgeting practices. For example, Graham and Harvey (2001) document a significant effect of debt while Brounen et al. (2004) find a relation with shareholder orientation. The effect of these mechanisms on capital budgeting practices inspires our first hypothesis:Hypothesis 1 The effect of mechanisms aligning managerial and shareholder incentives, such as debt and managerial ownership, increases the propensity to use theoretically more appropriate models, such as NPV, real option models or simulation models.
Regarding the nature of the sources of value, the real option approach has shown that the value created by a corporate investment comes not only from the future cash flows to emerge. Corporate investments also generate other ‘non-monetary’ results, such as knowledge, brand image or flexibility, whose value effect may be higher than that from cash flows. Value created by this type of results derives from the new possibilities (options) they provide to the company to take actions/decisions which would otherwise not have been available. These opportunities are the so-called ‘real options’ which enable the firm to invest in a new project, to expand/reduce an ongoing one, to abandon it, to adapt and re-deploy assets, to alter output or input mixes, and so on. Standard discounted cash flow techniques, such as NPV, are appropriate for estimating the value created by ‘given’ cash flows, yet fail to capture the value of capabilities, which are the natural subject matter of real option models.
As it is hard to envisage corporate investments not including any of these intangible results (Myers, 1996), the conclusion is that the most commonly used capital budgeting tool should be the real option model (Myers, 1984; Palacios et al., 2002). This notion is further strengthened by the wide explanatory power of real options, as managers that have never heard of this model decide and act as if they were following its main precepts (Myers, 1996), for example, when undertaking an R&D project with negative NPV as a means of discovering fresh opportunities or when entering unknown and seemingly unprofitable new markets due to their strategic value.4
With the ten years once predicted by Copeland (2000) for real options to replace discounted cash flow model having now elapsed, problems preventing the practical implementation of what is – at least in theory – a better model clearly exist. Recent studies show the real option approach is being gradually adopted, although it remains some considerable distance behind discounted cash flow models (Alkaraan and Northcott, 2006; Truong et al., 2008; Shinoda, 2010). Its high computational complexity (Newton and Pearson, 1994; Mathews et al., 2007), lack of understanding of its main principles (Myers, 1996; Block, 2007; Rayo et al., 2007; Baker et al., 2011b) or the fact that some of the underlying assumptions do not literally stand up to scrutiny (Lander and Pinches, 1998) are some of the statements used to justify the reluctance to apply the approach.
Such explanations do not exactly project a favourable image of managers, who seem to lack sufficient resources or incentives to adopt approaches which, although better than those usually employed, demand more effort and involve greater complexity. As mentioned above, this diagnosis is further supported by the empirical results which relate a firm's size and managers’ education to capital budgeting practices. In contrast to this rather pessimistic hypothesis, a more benevolent view considers that the chosen techniques, while not the most sophisticated or innovative, are those most suited to the nature of each investment's main sources of value. In their empirical study on Canadian firms’ use of real options, Baker et al. (2011b) find that the second main reason managers give for ‘not using real options’ is the ‘lack of applicability’ to their business. Similarly, Block (2007) finds that real option models are more frequently used in specific industries and for evaluating particular types of project. This evidence supports the idea that adopting such a practice may depend on the nature of a project's sources of value. Regardless of how often they are used in all types of investments, the relative relevance of real options may vary substantially from one project to another. Such a discrepancy in terms of relevance is found by Kester (1984) when estimating the relative effect of growth options in a firm's market value, which varies from 7 to 88% from one business to another.5 This line of reasoning supports our second hypothesis, which relates the influence of the nature of sources of value on the use of the real option model:Hypothesis 2 The relevance of growth options and flexibility as sources of value of a firm's capital investments increases the propensity to use real options models.
Our empirical analysis of capital budgeting practices is based on information obtained from a questionnaire addressed to CFOs of the 2000 largest non-financial Spanish companies.6 A draft survey was first reviewed by other two scholars, each of whom were, respectively, experts in questionnaire design and corporate finance. The reviewed questionnaire was then submitted to previous testing by four CFOs from different industries. The final questionnaire was accompanied by a cover letter explaining the research objectives and guaranteeing anonymity of answers. The data collection process began in February 2011 and concluded in June, with a total of 140 valid answers and a response rate of 7.0%.
The survey was designed to obtain information concerning the type and frequency of capital budgeting tools used; the nature of investment sources of value and relevance; the effect of mechanisms aligning managerial and shareholder incentives; firm characteristics and CFO features. The questionnaire mainly comprised multi-choice questions, where respondents were asked to score answers on a scale of five, from lowest to highest.7
To check possible response bias, we conducted the following two tests. First, following Graham and Harvey (2001), and Brounen et al. (2004), we compared sales revenue of responding and original population. Differences-of-means test results indicate no statistically significant disparities between groups (p-value >0.1). Additionally, we checked whether the sales revenue of early respondents differs from that of late respondents.8 Again, differences-of-means test results fail to detect statistically significant variances between these groups (p-value >0.1).
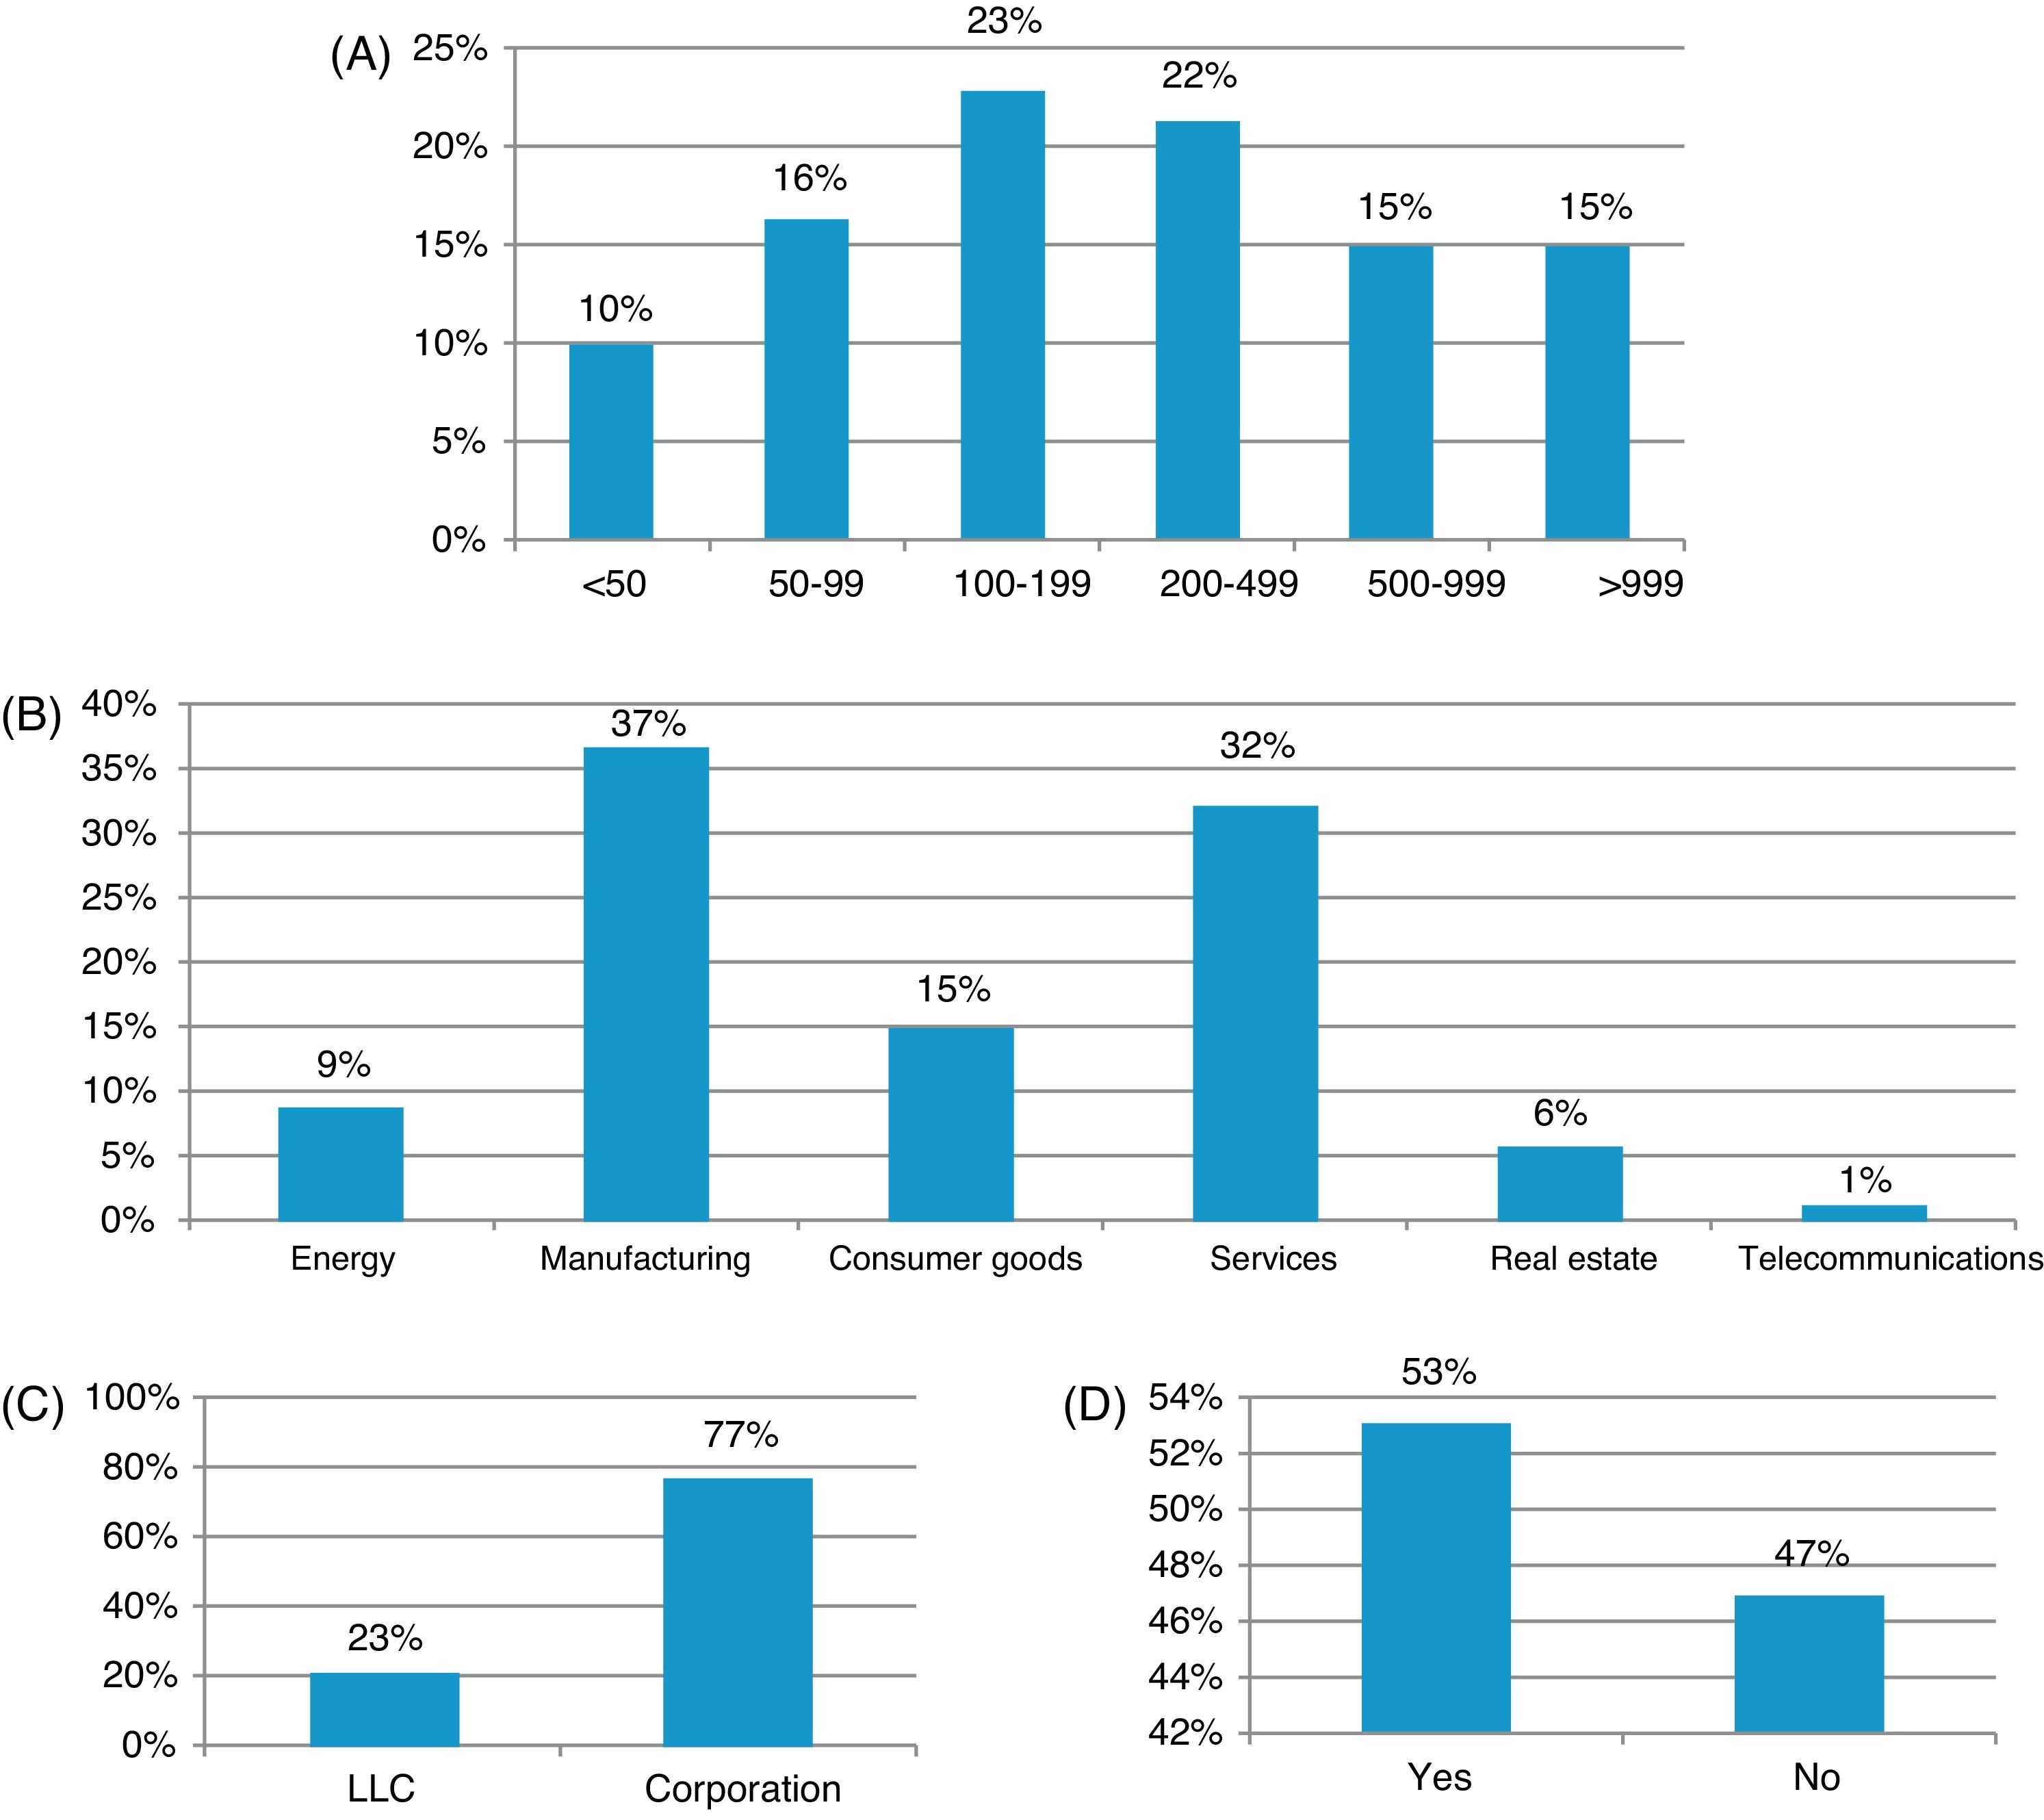
Sample: firm and CFO characteristicsFig. 1 summarizes the information on the main characteristics of firms in our sample regarding sales revenue (Fig. 1A), industry (Fig. 1B), legal status (Fig. 1C), and foreign investments (Fig. 1D). Despite being among the group of the 2000 largest Spanish companies, 9.6% of firms in the sample have annual sales below 50 million, and only 14.8% show sales exceeding 1000 million. Most companies fit into the category of sales between 100 and 500 million euros (over 44% of companies). As regards their core industry classification, the most populated groups are Manufacturing (36.8%) and Services (32.4%). Other industries represented in the sample were Consumer Goods (14.7), Energy (8.8%), Real Estate Services (5.9%) and Telecommunications (1.5%). According to their legal status, 77.2% of companies are Corporations and 22.8% are Limited Liability Companies. Finally, Fig. 1D shows that 53.1% of the sample companies invest overseas.
. Panel B: industry sector. Distribution of companies by core business. Panel C: legal status. Percentage of Limited Liability Companies (LLC) and Corporations (Corp). Panel D: foreign investments. Percentage of firms investing overseas.")
Features of companies in the sample. Panel A: sales. Distribution of companies according to sales revenue (millions of euros). Panel B: industry sector. Distribution of companies by core business. Panel C: legal status. Percentage of Limited Liability Companies (LLC) and Corporations (Corp). Panel D: foreign investments. Percentage of firms investing overseas.
Fig. 2 shows CFOs’ profiles according to their age (Fig. 2A), time in their positions (Fig. 2B), educational background (Fig. 2C), board of director position (Fig. 2D) and involvement in capital investment decisions (Fig. 2E). 45.2% of respondent CFOs are between 40 and 49 years old, 5.2% are over 60 years old and one CFO reported being under 30 years of age.9 The average time they had been working was 20.6 years, while the average time in the current firm and position are 12.9 and 9.5 years respectively. As regards educational background, 46.6% of CFOs hold an MBA or Master's Degree in Finance. Finally, less than one third of CFOs (29.6%) are members of the board of directors and most feel fairly (35.6%) or highly involved (44.4%) in their firm's capital investment decisions.

Features of CFOs in the sample. Panel A: age. Distribution of CFOs by age. Panel B: work experience. Average number of year spent working within the company and as CFO. Panel C: educational background. Percentage of CFOs with MBA or Master's Degree in Finance. Panel D: board of directors. Percentage of CFOs on the board of directors. Panel E: involvement in investment decisions. Distribution of CFOs according to their involvement in the company's investment decisions.
The models used to test our hypotheses relate frequency of use of several capital budgeting tools to independent variables measuring the effect of mechanisms aligning managerial and shareholder incentives (Hypothesis 1) and the relevance of growth options and flexibility as sources of value (Hypothesis 2). To compare the explanatory power of our hypothesis with findings in previous literature, our models include the control variables of the size of the firm and CFO's educational level.
The dependent variable is defined as the frequency with which each capital budgeting tool is used by CFOs according to the scores given on a scale of 5 levels (from “never” to “always”). The capital budgeting techniques considered are NPV, IRR, PB, real options, simulation and sensitivity analysis. The categorized nature of the dependent variable, which measures ordered multiple-choice answers, makes ordered probit estimation the appropriate econometric model for testing Hypotheses 1 and 2.10
In order to test Hypothesis 1, we estimate the following equation:
where j indexes each of the 140 companies in the sample; technique measures the frequency of use of each capital budgeting technique; incentives is a set of mechanisms aligning managerial and shareholder incentives, size and mba are control variables which, respectively, measure the size of the firm and CFO's educational level; ¿, ¿ and ¿ are the coefficients to be estimated; and ej is an error term. Eq. M1 is estimated for each of the six capital budgeting techniques considered.
The variables used to capture the effect of mechanisms aligning managerial and shareholder incentives are long-term debt (ltdebt), managerial ownership (ownership), and frequency of firm valuation (valuation). Graham and Harvey (2001) are pioneers in the analysis of relationships between capital budgeting practices and the variables of corporate borrowing and managerial ownership. The effect of the variables of long-term debt and managerial ownership on aligning managerial and shareholder incentives is supported by works such as Jensen (1986) and Connelly et al. (2010), among others. Andrés et al. (2000) and Miguel et al. (2004) find empirical evidence illustrating this role of long-term debt and managerial ownership, respectively, in the case of Spanish companies. Additionally, we define the variable of frequency of firm valuation (valuation) to reflect how regularly managers estimate the value of the firm in a year. The more frequently this value is estimated by managers, the higher their interest in value creation (Rappaport, 1997). This variable thus provides information about a firm's shareholder orientation and the level of managerial and shareholder interest alignment.
The values for these three variables are obtained directly from CFOs’ answers to the survey. Long-term debt (ltdebt) is defined as the quotient of long-term debt and total assets. Managerial ownership (ownership) is a dummy taking the value 1 if a CFO owns common stock of his firm and zero otherwise. The variable of firm valuation (valuation) is a categorized variable which takes five levels, from never to daily, according to the frequency with which the firm value is estimated by CFOs. The control variables of size of the firm (size) and managerial education (mba) are defined as in Graham and Harvey (2001), respectively, by the natural logarithm of sales and a dummy that takes the value 1 if CFOs hold a postgraduate degree, such as an MBA or a Master's Degree in Finance, and zero otherwise.
Results from correlation analysis of independent variables suggest evaluating the effect of managerial ownership (ownership) and frequency of firm valuation (valuation) separately. We therefore split Model M1 into the following two model specifications:


In order to test Hypothesis 2, we estimate the following equation:
where sources is a set of variables which reflect the nature of a firm's sources of value, ¿ captures the coefficient to be estimated, and the remaining variables are the same as in Model M1.
The nature of sources of value (sources) is captured by a set of variables measuring the relevance of growth options (growth) and flexibility to switch investment inputs (switch), to modify investment size (modify), and to defer investments (defer). The relevance of this type of real options in a firm's market value is supported by works such as Kester (1984) for the option to grow, McDonald and Siegel (1986) for the option to postpone investments, Kulatilaka (1993) for the option to switch investment inputs, and Pindyck (1988) for the option to modify a project's size.
We obtain evidence for these variables directly from CFOs’ answers to the survey. We asked CFOs to score on a scale of five levels (from lowest to highest) the relevance of each option in the whole of their firm's sources of value. Specifically, the values for the growth options variable (growth) reflect the frequency with which past investments open up new opportunities to invest, and the values for the variables of the options to switch inputs (switch), modify investment size (modify), and defer investments (defer), indicate the relative importance of these possibilities in their usual capital investments.
Results from correlation analysis of independent variables in Model M2 suggest examining separately the effect of the option to switch inputs (switch) and resize investments (modify) from the effect of the option to defer (defer). We therefore split Model M2 into the following two model specifications:


Finally, we test Hypotheses 1 and 2 jointly by estimating a model which includes both groups of independent variables of alignment mechanisms and sources of value. Results from correlation analysis of these independent variables again suggest considering the variables of growth, switch, modify, ltdebt and ownership in Model M3.1, and the variables of growth, switch, modify and valuation in Model M3.2:


Table 2 shows descriptive statistics for independent and control variables included in the models to be estimated.
Descriptive statistics of independent and control variables. This table presents descriptive statistics for our sample of firms. For each variable, it shows the number of observations (N); mean (Mean); standard deviation (SD); minimum (Min); maximum (Max); and for categorized variables their relative frequencies. Variables are defined as follows: size is the natural logarithm of sales; mba is a dummy taking the value of 1 if the CFO holds an MBA or Master's Degree in Finance, and zero otherwise; involvement is a four-level categorized variable ordered from lowest to highest CFO involvement in investment decisions; ltdebt is the quotient of long-term debt and total assets; valuation is a categorized variable which takes five levels from never to daily, according to the frequency with which the firm value is estimated by CFOs; growth is a categorized variable which takes five levels reflecting the frequency with which past investments open up new opportunities to invest, and the variables of switch, modify, and defer are categorized variables which take five levels reflecting the relative importance of, respectively, the option to switch inputs, modify investment size, and defer investments, in the firm's usual capital investments.
| Variable | N | Mean | SD | Min | Max | 0 | 1 | 2 | 3 | 4 | 5 |
|---|---|---|---|---|---|---|---|---|---|---|---|
| size | 135 | 5.5 | 1.5 | 1.1 | 11.2 | – | – | – | – | – | – |
| mba | 132 | 0.5 | 0.5 | 0 | 1 | 51.5% | 48.5% | – | – | – | – |
| involvement | 130 | 3.2 | 0.8 | 1 | 4 | – | 3.1% | 16.9% | 35.4% | 44.6% | – |
| ltdebt | 100 | 0.2 | 0.2 | 0 | 1.1 | – | – | – | – | – | – |
| ownership | 133 | 0.1 | 0.3 | 0 | 1 | 89.5% | 10.5% | ||||
| valuation | 132 | 1.4 | 1.1 | 0 | 4 | 15.9% | 55.3% | 9.9% | 14.4% | 4.6% | – |
| growth | 136 | 3.1 | 1.1 | 1 | 5 | – | 7.4% | 28.7% | 21.3% | 33.1% | 9.6% |
| switch | 136 | 3.2 | 1.0 | 1 | 5 | – | 6.6% | 14.0% | 45.6% | 24.3% | 9.6% |
| defer | 138 | 3.1 | 1.1 | 1 | 5 | – | 6.5% | 22.5% | 30.4% | 31.2% | 9.4% |
| modify | 139 | 3.6 | 0.9 | 1 | 5 | – | 1.4% | 8.6% | 29.5% | 46.0% | 14.4% |
This section first describes capital budgeting practices in our sample and presents a univariate analysis of the relationship between them and characteristics of firms and CFOs. Next, it shows and discusses the main results from testing our explanatory hypotheses. Finally, we perform and comment on a number of robustness checks.
Capital budgeting practicesTable 3 summarizes CFOs’ answers to the question concerning the frequency with which each of the six capital budgeting techniques is used. PB and IRR are the most popular techniques among CFOs in our sample. PB is always or almost always used by 75.0% of companies and IRR by 74.1%. NPV is always or almost always used by 65.7% of companies. The real options model is the least popular technique: only 14% of the CFOs in our sample reported using this model always or almost always. Sensitivity analysis and simulation models are always or almost always used by about half of the companies (54.4% and 47.5%, respectively).
Capital budgeting practices. This table presents CFOs’ answers on a scale of five levels, from lowest to highest, to the question concerning the frequency with which each of the six capital budgeting techniques is used. “Average” represents the mean frequency of use of each technique, obtained by assigning consecutive values from 1 to 5 to the successive response levels from lowest (never) to highest (always).
| Technique | Number of observations | Percentage of companies using the technique | Average | ||||
|---|---|---|---|---|---|---|---|
| Never | Sometimes | Commonly | Almost always | Always | |||
| NPV | 140 | 5.0% | 11.4% | 17.9% | 17.1% | 48.6% | 3.93 |
| IRR | 139 | 2.9% | 7.9% | 15.1% | 19.4% | 54.7% | 4.15 |
| PB | 140 | 3.6% | 6.4% | 15.0% | 24.3% | 50.7% | 4.12 |
| Real options | 133 | 39.1% | 21.1% | 25.6% | 9.0% | 5.3% | 2.20 |
| Simulation models | 137 | 13.1% | 13.9% | 25.5% | 19.0% | 28.5% | 3.35 |
| Sensitivity analysis | 136 | 9.6% | 16.2% | 19.9% | 25.7% | 28.7% | 3.48 |
The results concerning PB and IRR prevalence are similar to those obtained in previous studies for British and Spanish companies. Brounen et al. (2004) found that 69.2% of UK companies always or almost always use PB, whereas 53.1% and 47.0% use IRR and NPV, respectively. In Rayo et al. (2007), frequency rates indicated by Spanish firms are 80.8%, 79.6% and 78.6%, respectively, for PB, IRR and NPV. In the case of U.S. companies, we must go back as far as 1978 to find evidence of a similar PB prevalence: Schall et al. (1978) found that 74% of U.S. firms always or almost always used PB, 65% IRR, and 56% NPV. Our survey also reveals that the 14% of companies in our sample that always or almost always use real options is lower than that reported in previous studies: 26.6% in North America (Graham and Harvey, 2001), 29.0% in the UK, 34.7% in the Netherlands, 44.0% in Germany, 53.1% in France (Brounen et al., 2004), and 17.1% in Spain (Rayo et al., 2007).
As in Bierman (1993), Pike (1996), Arnold and Hatzopoulos (2000) and Verbeeten (2006), our survey results indicate that Spanish companies simultaneously use several capital budgeting techniques. Fig. 3 shows the number of techniques adopted by firms. The average number of techniques is 3.76 (with a standard deviation of 1.76), with over 40% of companies using at least five different methods. Outliers indicate that 4.3% of CFOs do not use any of these six techniques and that 20.0% of CFOs use all of them simultaneously.

Table 4 shows the relationship between techniques used by a single company. The high correlation between NPV and IRR indicates that CFOs frequently apply them together. The correlations between IRR and PB, and between NPV and PB, are also significant. This association between techniques seems to support the hypothesis that CFOs tend to successively accumulate techniques in order to: (i) avoid replacing more familiar tools with others which are theoretically better (Verbeeten, 2006); and (ii) collect multiple results, in many cases redundant, to reinforce their investment proposals under uncertainty (Arnold and Hatzopoulos, 2000).
Correlation between capital budgeting practices. This table shows correlation coefficients between capital budgeting techniques. Each variable is defined as the frequency with which each capital budgeting tool is used by CFOs according to the scores given on a scale of 5 levels (from “never” to “always”).
Consistent with this idea, Table 5 reports which other tools are (always and almost always) used together with each technique. In 92 of the cases in which CFOs indicate use of NPV, they also adopt IRR and PB. Similar behaviour can be observed among users of the latter two techniques. However, the reinforcement needed for real options, simulation and sensitivity analysis models seems even higher, as indicated by the fact they tend to be used together with four other different tools.
Number of conditional practices. This table presents which other tools are (always and almost always) used together with each technique.
| Companies | Other practices | NPV | IRR | PB | Real options | Simulation | Sensitivity | |
|---|---|---|---|---|---|---|---|---|
| NPV | 92 | 2 | X | X | ||||
| IRR | 103 | 2 | X | X | ||||
| PB | 105 | 2 | X | X | ||||
| Real options | 19 | 3 | X | X | X | |||
| Simulation | 65 | 4 | X | X | X | X | ||
| Sensitivity | 74 | 4 | X | X | X | X |
Tables 6 and 7 show the relation between the frequency of use for each capital budgeting technique and, respectively, firm and CFO characteristics. Variables included in this analysis are those usually considered in prior literature and used in the section “Sample: firm and CFO characteristics” to describe the sample. The values for these variables are obtained directly from CFOs’ answers to the survey. Firm characteristics cover size (on the basis of the natural logarithm of million euros sales); industry dummies (according to the primary business being classified as Energy, Manufacturing, Consumer goods, Services, Real estate and Telecommunications); legal status (a dummy that takes the value of 1 in the case of Corporations and zero for Limited Liability Companies), and foreign investment (a dummy taking the value of 1 if the firm invests overseas and zero otherwise). CFO characteristics cover age (a categorized variable of five levels from lowest to highest); time spent working, time spent in the current company, and time as CFO (directly measured by the number of years in each position); educational level (a dummy taking the value 1 if an MBA or Master's Degree in Finance is held, and zero otherwise), board of director position (a dummy that takes the value of 1 when a position is held on the board of directors and zero otherwise), and involvement in capital investment decisions (a four-level categorized variable ordered from lowest to highest involvement). To analyze the individual effect of each of these characteristics on the frequency of use of each technique, we estimated univariate ordered probit regressions.
Firm characteristics and capital budgeting techniques. This table presents univariate ordered probit regression coefficients and pseudo R2 (below in italics), where the dependent variable is the frequency of use of each technique (in columns) and the independent variable is one of the firm's characteristics (in rows). The dependent variable is defined as the frequency with which each capital budgeting tool is used by CFOs according to the scores given on a scale of five levels (from “never” to “always”). Independent variables are defined as follows: size is the natural logarithm of million euros sales; industry dummies according to the primary business are energy, manufacturing, consumer goods, services, real estate and telecommunications; legal status is a dummy that takes the value 1 in the case of Corporations and zero for Limited Liability Companies, and foreign investment is a dummy taking the value 1 if the firm invests overseas and zero otherwise.
| NPV | IRR | PB | Real options | Simulation | Sensitivity | |
|---|---|---|---|---|---|---|
| size | 0.243*** | 0.213*** | 0.235*** | 0.028 | 0.153** | 0.225*** |
| 0.0326 | 0.0263 | 0.0341 | 0.0005 | 0.0144 | 0.0279 | |
| energy | −0.180 | −0.214 | 0.245 | −0.083 | 0.340 | 0.170 |
| 0.0007 | 0.0012 | 0.0014 | 0.0002 | 0.0027 | 0.0007 | |
| manufacturing | 0.016 | 0.085 | 0.435** | 0.136 | −0.052 | −0.212 |
| 0.0000 | 0.0005 | 0.0132 | 0.0013 | 0.0002 | 0.0030 | |
| consumer goods | 0.038 | −0.088 | 0.293 | −0.273 | 0.445* | 0.162 |
| 0.0001 | 0.0003 | 0.0032 | 0.0026 | 0.0067 | 0.0009 | |
| services | −0.209 | −0.195 | −0.539*** | −0.189 | −0.380* | −0.138 |
| 0.0029 | 0.0027 | 0.0203 | 0.0024 | 0.0089 | 0.0012 | |
| real estate | 0.813* | 1.082* | −0.781** | 0.711 | 0.114 | 0.735* |
| 0.0087 | 0.0120 | 0.0110 | 0.0066 | 0.0002 | 0.0080 | |
| telecommunications | 4.975 | 4.7510 | 4.917 | 1.042 | 0.578 | 0.501 |
| 0.0079 | 0.0074 | 0.0079 | 0.0056 | 0.0013 | 0.0010 | |
| legal status | 0.442** | 0.523** | 0.283 | 0.329 | 0.185 | 0.263 |
| 0.0105 | 0.0154 | 0.0045 | 0.0054 | 0.0017 | 0.0035 | |
| foreign investments | 0.330* | 0.434** | 0.349* | 0.193 | 0.310 | 0.373** |
| 0.0080 | 0.0144 | 0.0094 | 0.0027 | 0.0067 | 0.0098 | |
CFO characteristics and capital budgeting techniques. This table presents univariate ordered probit regression coefficients and pseudo R2 (below in italics), where the dependent variable is the frequency of use of each technique (in columns) and the independent variable is one of the CFO's characteristics (in rows). The dependent variable is defined as the frequency with which each capital budgeting tool is used by CFOs according to the scores given on a scale of 5 levels (from “never” to “always”). Independent variables are defined as follows: age is a categorized variable of five levels from lowest to highest; yearsworking is the number of years spent working; yearscompany is the number of years spent in the current company; yearscfo is the number of years as CFO; mba is a dummy taking the value 1 if an MBA or Master's Degree in Finance is held, and zero otherwise, director is a dummy that takes the value 1 when a position is held on the board of directors and zero otherwise; and involvement is a four-level categorized variable ordered from lowest to highest involvement in investment decisions.
| NPV | IRR | PB | Real options | Simulation | Sensitivity | |
|---|---|---|---|---|---|---|
| age | −0.599 | 0.018 | 0.166 | −0.084 | 0.034 | −0.039 |
| 0.0008 | 0.0000 | 0.0062 | 0.0015 | 0.0002 | 0.0003 | |
| yearsworking | −0.003 | 0.001 | 0.014 | −0.002 | −0.001 | −0.007 |
| 0.0002 | 0.0000 | 0.0040 | 0.0001 | 0.0000 | 0.0008 | |
| yearscompany | −0.006 | −0.002 | 0.004 | −0.011 | −0.004 | −0.022** |
| 0.0009 | 0.0001 | 0.0004 | 0.0027 | 0.0003 | 0.0109 | |
| yearscfo | −0.013 | −0.017 | 0.000 | −0.004 | −0.009 | −0.011 |
| 0.0022 | 0.0039 | 0.0000 | 0.0001 | 0.0010 | 0.0013 | |
| mba | 0.261 | 0.218 | 0.250 | −0.063 | 0.230 | 0.520*** |
| 0.0050 | 0.0037 | 0.0048 | 0.0003 | 0.0037 | 0.0190 | |
| director | −0.110 | −0.031 | 0.245 | 0.264 | 0.077 | 0.037 |
| 0.0008 | 0.0001 | 0.0038 | 0.0043 | 0.0004 | 0.0001 | |
| involvement | 0.289** | 0.326*** | 0.316*** | −0.016 | 0.216* | 0.358*** |
| 0.0172 | 0.0229 | 0.0216 | 0.0001 | 0.0092 | 0.0248 | |
Table 6 presents the results for the influence of firm characteristics. We find that firm size has a positive impact on the frequency of use of all the techniques, except real options. The larger the company, the greater the propensity to use NPV, IRR, sensitivity analysis, simulation models and even PB. Graham and Harvey (2001) and Brounen et al. (2004) also find that larger firms tend to use NPV, IRR and sensitivity analysis more frequently. Payne et al. (1999) and Hermes et al. (2007) observe that larger firms adopt NPV more frequently, while Moore and Reichert (1983) and Baker et al. (2011a) provide similar evidence in the case of TIR. However, our results differ from previous research as regards the positive relationship between size and PB. In Graham and Harvey (2001) and Hermes et al. (2007), larger firms use PB less often than smaller firms, whereas we find the opposite relation for Spanish companies.
The effect of industry on frequency of use varies from one technique to another. PB is used more often by manufacturing firms, but less often by services and real estate firms, NPV, IRR and sensitivity analysis are used more often by real estate firms, and simulation models are more frequently used by consumer goods firms. According to their legal status, we find that Corporations used NPV and IRR more often than Limited Liability Companies. Finally, results in Table 6 show that NPV, IRR, PB and sensitivity analysis are used more often by companies investing overseas. Graham and Harvey (2001) find that companies with foreign sales use NPV and IRR more often, although Hermes et al. (2007) note that these are precisely the companies that tend to use PB less frequently.
Table 7 presents the results for the influence of CFO characteristics. As a whole, we find that frequency of use does not depend on CFO profile. Among all these variables, involvement in capital investment decisions seems to be the variable with the highest impact on the frequency of use of five of the six techniques. The only exception is the real option model, which is not affected by any of the CFO characteristics considered. This result differs from the positive relationship found by Rayo et al. (2007) between the level of involvement and the use of real options. Table 7 indicates that sensitivity analysis is used less by those who have more years of experience in the company and is used more often by those who hold an MBA or a Master's Degree in Finance. Graham and Harvey (2001) find that managers with greater experience use NPV and IRR less often and PB more often. Previous research shows that having an MBA encourages use of discounted cash flow models (Graham and Harvey, 2001; Brounen et al., 2004; Hermes et al., 2007) and sensitivity analysis (Brounen et al., 2004; Chazi et al., 2010). Finally, our results do not confirm prior evidence concerning the positive effect of CFO age on the frequency of use of PB (Graham and Harvey, 2001) and NPV (Hermes et al., 2007).
Test of hypothesesTable 8 presents the results of the multivariate ordered probit estimation used to test Hypothesis 1 which predicts that mechanisms aligning managerial and shareholder incentives increase the tendency to use theoretically more appropriate models. For each technique, Table 8 displays two columns with coefficients, standard errors and marginal errors for independent variables in two different model specifications.11 In Model M1.1, alignment mechanisms are measured by the variables of long-term debt (ltdebt) and managerial ownership (ownership), whereas in Model M1.2 this latter variable is replaced by the frequency with which the value of the firm is estimated (valuation).
Mechanisms aligning managerial and shareholder incentives and capital budgeting practices. This table presents multivariate probit estimations used to test Hypothesis 1. For each technique, two columns are displayed with regression coefficients, standard errors (below in parenthesis) and marginal errors (below in italics) for independent and control variables in Models M1.1 and M1.2. The dependent variable is the frequency of use of each technique (in columns) and the independent and control variables are defined as follows: ltdebt is the quotient of long-term debt and total assets; ownership is a dummy taking the value 1 if the CFO holds a stake in the firm's equity, and zero otherwise; valuation is a categorized variable which takes five levels, from never to daily, according to the frequency with which the firm value is estimated by CFOs; size is the natural logarithm of sales; and mba is a dummy taking the value 1 if the CFO holds an MBA or Master's Degree in Finance, and zero otherwise.
| NPV | IRR | PB | Real options | Simulation | Sensitivity | |||||||
|---|---|---|---|---|---|---|---|---|---|---|---|---|
| M1.1 | M1.2 | M1.1 | M1.2 | M1.1 | M1.2 | M1.1 | M1.2 | M1.1 | M1.2 | M1.1 | M1.2 | |
| ltdebt | −0.052 | −0.073 | 0.195 | 0.164 | −0.686 | −0.745 | 0.521 | 0.526 | −0.102 | −0.120 | 0.292 | 0.307 |
| (0.52) | (0.52) | (0.52) | (0.52) | (0.52) | (0.53) | (0.52) | (0.52) | (0.51) | (0.51) | (0.51) | (0.51) | |
| −0.021 | −0.029 | 0.077 | 0.065 | −0.274 | −0.297 | 0.063 | 0.059 | −0.033 | −0.038 | 0.095 | 0.101 | |
| ownership | 0.076 | 0.241 | 0.025 | 0.389 | 0.242 | 0.363 | ||||||
| (0.37) | (0.39) | (0.36) | (0.34) | (0.34) | (0.35) | |||||||
| 0.030 | 0.094 | 0.010 | 0.059 | 0.082 | 0.127 | |||||||
| valuation | 0.039 | 0.060 | 0.154 | 0.299** | 0.209* | −0.004 | ||||||
| (0.11) | (0.12) | (0.12) | (0.12) | (0.11) | (0.11) | |||||||
| 0.016 | 0.024 | 0.061 | 0.033 | 0.067 | −0.001 | |||||||
| size | 0.220** | 0.228*** | 0.185** | 0.194** | 0.195** | 0.203** | 0.079 | 0.091 | 0.123 | 0.123 | 0.203** | 0.202** |
| (0.09) | (0.09) | (0.09) | (0.09) | (0.08) | (0.09) | (0.09) | (0.09) | (0.08) | (0.08) | (0.08) | (0.08) | |
| 0.088 | 0.09 | 0.073 | 0.077 | 0.077 | 0.081 | 0.009 | 0.010 | 0.039 | 0.039 | 0.066 | 0.066 | |
| mba | 0.292 | 0.345 | 0.135 | 0.214 | 0.386 | 0.486** | 0.048 | 0.205 | 0.002 | 0.062 | 0.479** | 0.479** |
| (0.24) | (0.25) | (0.25) | (0.25) | (0.24) | (0.25) | (0.24) | (0.25) | (0.23) | (0.23) | (0.23) | (0.23) | |
| 0.116 | 0.137 | 0.053 | 0.084 | 0.153 | 0.192 | 0.006 | 0.023 | 0.001 | 0.020 | 0.156 | 0.157 | |
| N | 96 | 95 | 95 | 94 | 96 | 95 | 90 | 89 | 94 | 93 | 94 | 93 |
| LR chi2 | 8.17* | 8.88* | 5.45 | 5.74 | 9.80** | 12.32** | 5.44 | 8.45* | 3.60 | 6.19 | 12.66** | 10.51** |
| Pseudo R2 | 0.03 | 0.04 | 0.02 | 0.03 | 0.04 | 0.05 | 0.02 | 0.03 | 0.01 | 0.02 | 0.04 | 0.04 |
| Log likelihood | −123.5 | −122.5 | −114.6 | −113.9 | −119.2 | −117.2 | −124.3 | −121.9 | −144.3 | −140.8 | −138.5 | −137.2 |
These results indicate that among those alignment mechanisms, only the coefficient of firm valuation is statistically different from zero. Graham and Harvey (2001) reported that long-term debt encouraged the use of NPV, IRR and sensitivity analysis techniques, and managerial ownership favoured the use of PB, and discouraged adopting NPV and IRR. Contrary to prior research, we find that long-term debt and managerial ownership do not affect how often any of the six techniques are used. However, we find that the frequency with which CFOs estimate their firm value is positively associated to how often real options and simulation models are used, which are precisely the two techniques whose use is not affected by company size. This evidence suggests that a higher value creation orientation, as revealed by the frequency of firm value estimation, explains the use of real options and simulation models better than firm size or CFO background do.
Our results confirm prior evidence concerning the more frequent use of NPV, IRR, PB and sensitivity analysis by the larger companies. Additionally, the estimated coefficients of MBA suggest that postgraduate education favours the use of PB and sensitivity analysis. Although this effect of higher education might seem surprising, it confirms prior results obtained by Brounen et al. (2004) for UK and German companies and how often PB and sensitivity analysis are used, respectively.
Table 8 also presents marginal effects for independent and control variables. The marginal effects shown are calculated for each technique on the highest level of its frequency of use, which corresponds to applying it “always”. Estimated marginal effects indicate that the size of the firm increases the use of NPV, IRR, PB and sensitivity analysis by around 6–9%. The marginal effect of CFO education is even higher for adopting PB and sensitivity analysis, with estimated values above 15%. These effects are countered with the negative influence of long-term debt, which shows a negative marginal effect of 27% and above. Shareholder orientation, as measured by the frequency of firm valuation, presents a marginal effect of 3.3 and 6.7%, respectively, in adopting real options and simulation models.
In sum, we find little support for Hypothesis 1. Neither the predicted pressure of long-term debt on managerial decisions, nor the convergence of interests of managers and shareholders associated to managerial ownership seem to encourage choosing theoretically superior techniques. The only alignment mechanism that appears to influence frequency of use of more sophisticated techniques is how often CFOs estimate the value of the firm. Considered together, these findings reveal that a firm's actual shareholder orientation seems to encourage frequent use of real options and simulation models, although possible deviations towards the use of inappropriate tools are not corrected by pressure of interest alignment mechanisms such as long-term debt or management ownership.
Results in Table 9 correspond to the multivariate ordered probit estimation used to test Hypothesis 2 which predicts that the relevance of growth options and flexibility as sources of value of a firm's capital investments increases the propensity to use real options models. For each technique, we estimate two different model specifications on the basis of statistical correlation of independent variables. In addition to the control variables of firm size (size) and CFO education level (mba), Model M2.1 includes the options to grow (growth), to switch inputs (switch) and to modify investment dimension (modify) as independent variables, whereas Model M2.2 replaces the options to switch inputs (switch) and to modify investment dimension (modify) by the option to defer investments (defer).
Sources of value and capital budgeting practices. This table presents multivariate probit estimations used to test Hypothesis 2. For each technique, two columns are displayed with regression coefficients, standard errors (below in parenthesis) and marginal errors (below in italics) for independent and control variables in Models M2.1 and M2.2. The dependent variable is the frequency of use of each technique (in columns) and the independent and control variables are defined as follows: growth is a categorized variable which takes five levels reflecting the frequency with which past investments open up new opportunities to invest, and the variables of switch, modify, defer are categorized variables which take five levels reflecting the relative importance of, respectively, the option to switch inputs, modify investment size, and defer investments, in the firm's usual capital investments; size is the natural logarithm of sales; and mba is a dummy taking the value 1 if the CFO holds an MBA or Master's Degree in Finance, and zero otherwise.
| NPV | IRR | PB | Real options | Simulation | Sensitivity | |||||||
|---|---|---|---|---|---|---|---|---|---|---|---|---|
| M2.1 | M2.2 | M2.1 | M2.2 | M2.1 | M2.2 | M2.1 | M2.2 | M2.1 | M2.2 | M2.1 | M2.2 | |
| growth | 0.013 | 0.074 | −0.047 | 0.044 | 0.129 | 0.188** | 0.187** | 0.239*** | 0.096 | 0.152* | −0.021 | 0.006 |
| (0.09) | (0.09) | (0.10) | (0.10) | (0.10) | (0.09) | (0.09) | (0.09) | (0.09) | (0.09) | (0.09) | (0.09) | |
| 0.005 | 0.029 | −0.019 | 0.018 | 0.051 | 0.075 | 0.016 | 0.022 | 0.029 | 0.048 | −0.006 | 0.002 | |
| switch | 0.189* | 0.275** | 0.295*** | 0.071 | 0.072 | 0.003 | ||||||
| (0.10) | (0.11) | (0.11) | (0.11) | (0.11) | (0.10) | |||||||
| 0.076 | 0.108 | 0.117 | 0.006 | 0.022 | 0.001 | |||||||
| modify | 0.168 | 0.220* | 0.028 | 0.316*** | 0.522*** | 0.190 | ||||||
| (0.12) | (0.13) | (0.12) | (0.12) | (0.12) | (0.12) | |||||||
| 0.067 | 0.087 | 0.011 | 0.027 | 0.159 | 0.059 | |||||||
| defer | 0.267*** | 0.218** | −0.030 | 0.192** | 0.118 | 0.168* | ||||||
| (0.10) | (0.10) | (0.10) | (0.10) | (0.09) | (0.09) | |||||||
| 0.106 | 0.086 | −0.012 | 0.018 | 0.037 | 0.052 | |||||||
| size | 0.271*** | 0.283*** | 0.270*** | 0.257*** | 0.229*** | 0.224*** | 0.092 | 0.072 | 0.219*** | 0.176*** | 0.270*** | 0.264*** |
| (0.08) | (0.08) | (0.08) | (0.08) | (0.07) | (0.07) | (0.07) | (0.07) | (0.07) | (0.07) | (0.07) | (0.07) | |
| 0.108 | 0.113 | 0.106 | 0.101 | 0.091 | 0.089 | 0.008 | 0.007 | 0.067 | 0.056 | 0.084 | 0.082 | |
| mba | 0.183 | 0.179 | 0.066 | 0.110 | 0.042 | 0.102 | −0.118 | −0.147 | 0.040 | 0.080 | 0.546*** | 0.509** |
| (0.21) | (0.22) | (0.22) | (0.22) | (0.21) | (0.22) | (0.21) | (0.21) | (0.20) | (0.20) | (0.20) | (0.20) | |
| 0.073 | 0.071 | 0.026 | 0.043 | 0.017 | 0.041 | −0.010 | −0.014 | 0.012 | 0.025 | 0.171 | 0.159 | |
| N | 125 | 125 | 124 | 124 | 125 | 125 | 119 | 120 | 123 | 124 | 122 | 123 |
| LR chi2 | 20.66*** | 22.04*** | 22.28*** | 15.87*** | 21.97*** | 14.96*** | 14.44** | 11.02** | 32.64*** | 13.10** | 23.73*** | 24.60*** |
| Pseudo R2 | 0.06 | 0.07 | 0.07 | 0.05 | 0.07 | 0.05 | 0.04 | 0.03 | 0.08 | 0.03 | 0.06 | 0.06 |
| Log likelihood | −159.1 | −158.3 | −142.4 | −146.5 | −144.8 | −149.1 | −155.9 | −158.5 | −176.9 | −188.0 | −178.4 | −179.3 |
The growth options variable (growth), as measured by the frequency with which past investments open up future business opportunities, is statistically significant in explaining the use of real options. As predicted by Hypothesis 2, the relevance of growth options among a firm's sources of value increases the frequency of use of real options, which is, theoretically, the most appropriate model to value projects that spawn new opportunities to invest. Relevance of growth options also seems to promote frequent use of PB and, to a lesser extent, simulation models, as shown by coefficient values in one of the specifications (M2.2). The relationship between PB and growth options is by no means new and is in line with arguments used by McDonald (2000) to explain the “reasonable” adoption of heuristic methods (or “rules of thumb”) to approximate the value of real options. Alkaraan and Northcott (2006) compare the use of NPV, IRR and PB depending on the strategic nature of investments and find a relationship between strategic projects and the use of IRR.
Among the variables approximating the relevance of flexibility options, the options to modify the project dimension (modify) and the option to defer investments (defer) also present statistically significant coefficients, supporting Hypothesis 2. Results in Table 9 also indicate that CFOs use simulation models, together with real options, to capture the value of the option to amplify/reduce project dimension. Less easy to interpret is the more frequent use of NPV, IRR and PB in companies with a higher relevance of switch options (switch) and NPV, IRR, as well as sensitivity analysis in the cases of higher relevance of options to postpone investments (defer).
Analysis of marginal effects confirms the relevance of a firm's size on adopting nearly all the techniques, apart from real options. Marginal effects of size are 10% or above for the frequency of use of NPV and IRR. The only exception, which adds further predictive power to Hypothesis 2, is real options. In this case, the variables with higher marginal effects are those measuring the value relevance of the options to grow, defer and resize. Finally, marginal effects again confirm the relation between the frequency of use of sensitivity analysis and the CFO's education level, as shown in Table 8.
The joint effect of alignment mechanisms and sources of value on the frequency of use of techniques is shown in Table 10. Again, the table displays two columns for each technique with coefficients, standard errors and marginal errors, according to two different model specifications. Model M3.1 considers the variables of the options to grow (growth), switch inputs (switch) and modify project dimension (modify) together with long-term debt (ltdebt) and managerial ownership (ownership) and the control variables of size (size) and CFO educational level (mba), whereas Model M3.2 replaces the variable of managerial ownership (ownership) by the frequency with which the value of the firm is estimated (valuation). These results show that the effect of a firm's sources of value prevails over that of the alignment mechanisms. They also confirm the significant influence of the relevance of growth options on the frequency of use of real options and PB and the relevance of the option to resize investments on the frequency of use of real options and simulation models. The relevance of the flexibility to switch inputs reappears associated to NPV, IRR and PB, and also repeats the relation between CFO educational level and the use of sensitivity analysis (with higher marginal effects at 15%). Finally, joint consideration of alignment mechanisms and sources of value bears out the notion that in the case of PB the variable of long-term debt acts as a counterweight (with negative marginal effects above 34%) over the positive and statistically significant influence of size and the options to grow and switch inputs.
Mechanisms aligning managerial and shareholder incentives and sources of value. This table presents multivariate probit estimations used to test Hypotheses 1 and 2 jointly. For each technique, two columns are displayed with regression coefficients, standard errors (below in parenthesis) and marginal errors (below in italics) for independent and control variables in Models M3.1 and M3.2. The dependent variable is the frequency of use of each technique (in columns) and the independent and control variables are defined as in Tables 8 and 9.
| NPV | IRR | PB | Real options | Simulation | Sensitivity | |||||||
|---|---|---|---|---|---|---|---|---|---|---|---|---|
| M3.1 | M3.2 | M3.1 | M3.2 | M3.1 | M3.2 | M3.1 | M3.2 | M3.1 | M3.2 | M3.1 | M3.2 | |
| growth | 0.072 | 0.091 | −0.001 | 0.019 | 0.235** | 0.224** | 0.223** | 0.199* | 0.097 | 0.089 | −0.050 | −0.038 |
| (0.11) | (0.11) | (0.11) | (0.12) | (0.11) | (0.11) | (0.11) | (0.11) | (0.10) | (0.10) | (0.10) | (0.10) | |
| 0.029 | 0.036 | −0.000 | 0.007 | 0.094 | 0.089 | 0.019 | 0.017 | 0.029 | 0.027 | −0.016 | −0.012 | |
| switch | 0.371*** | 0.361*** | 0.461*** | 0.458*** | 0.428*** | 0.409*** | 0.024 | 0.045 | 0.049 | 0.081 | 0.079 | 0.113 |
| (0.13) | (0.13) | (0.13) | (0.13) | (0.13) | (0.13) | (0.13) | (0.13) | (0.12) | (0.12) | (0.12) | (0.12) | |
| 0.148 | 0.144 | 0.182 | 0.181 | 0.171 | 0.163 | 0.002 | 0.004 | 0.015 | 0.024 | 0.025 | 0.036 | |
| modify | −0.001 | 0.011 | −0.029 | −0.015 | −0.144 | −0.162 | 0.341** | 0.336** | 0.464*** | 0.471*** | −0.041 | −0.021 |
| (0.15) | (0.16) | (0.16) | (0.17) | (0.16) | (0.16) | (0.16) | (0.16) | (0.15) | (0.15) | (0.15) | (0.15) | |
| −0.000 | 0.004 | −0.012 | −0.005 | −0.057 | −0.064 | 0.029 | 0.029 | 0.139 | 0.142 | −0.013 | −0.007 | |
| ltdebt | −0.187 | −0.158 | 0.048 | 0.050 | −0.863 | −0.871 | 0.730 | 0.708 | −0.003 | −0.008 | 0.347 | 0.367 |
| (0.54) | (0.54) | (0.54) | (0.54) | (0.55) | (0.54) | (0.53) | (0.53) | (0.52) | (0.52) | (0.52) | (0.52) | |
| −0.074 | −0.063 | 0.019 | 0.020 | −0.344 | −0.348 | 0.063 | 0.062 | −0.001 | −0.003 | 0.110 | 0.117 | |
| ownership | −0.076 | 0.074 | −0.152 | 0.364 | 0.145 | 0.349 | ||||||
| (0.38) | (0.40) | (0.37) | (0.35) | (0.34) | (0.36) | |||||||
| −0.030 | 0.029 | −0.061 | 0.039 | 0.045 | 0.119 | |||||||
| valuation | −0.080 | −0.081 | 0.060 | 0.117 | 0.040 | −0.074 | ||||||
| (0.13) | (0.13) | (0.13) | (0.13) | (0.12) | (0.12) | |||||||
| −0.031 | −0.032 | 0.024 | 0.010 | 0.012 | −0.024 | |||||||
| size | 0.222** | 0.227** | 0.209** | 0.213** | 0.157* | 0.159* | 0.142 | 0.147 | 0.183** | 0.177** | 0.220*** | 0.222*** |
| (0.09) | (0.09) | (0.10) | (0.10) | (0.09) | (0.09) | (0.09) | (0.09) | (0.08) | (0.08) | (0.09) | (0.09) | |
| 0.089 | 0.091 | 0.082 | 0.084 | 0.063 | 0.063 | 0.012 | 0.013 | 0.055 | 0.053 | 0.070 | 0.071 | |
| mba | 0.304 | 0.279 | 0.134 | 0.127 | 0.294 | 0.328 | 0.002 | 0.080 | −0.058 | −0.080 | 0.562** | 0.521** |
| (0.26) | (0.26) | (0.27) | (0.27) | (0.26) | (0.26) | (0.26) | (0.27) | (0.24) | (0.25) | (0.24) | (0.25) | |
| 0.121 | 0.111 | 0.053 | 0.050 | 0.117 | 0.130 | 0.000 | 0.007 | −0.017 | −0.024 | 0.178 | 0.166 | |
| N | 92 | 91 | 91 | 90 | 92 | 91 | 86 | 85 | 90 | 89 | 90 | 89 |
| LR chi2 | 19.07*** | 19.51*** | 19.60*** | 19.77*** | 25.77*** | 25.85*** | 15.63** | 15.26** | 17.31** | 17.86** | 15.24** | 13.78* |
| Pseudo R2 | 0.08 | 0.08 | 0.09 | 0.09 | 0.11 | 0.11 | 0.06 | 0.06 | 0.06 | 0.06 | 0.06 | 0.05 |
| Log likelihood | −113.1 | −112.2 | −102.1 | −101.4 | −104.8 | −104.1 | −112.0 | −111.3 | −131.2 | −128.7 | −131.5 | −129.9 |
To check the sensitivity of our results to alternative definitions of our variables we re-estimated our models with as many modifications as allowed by our available data. Overall, we find that our main results remain unchanged. Firstly, including the industry dummy variables does not affect the sign and significance of coefficients. Secondly, we replace the long-term debt variable by the total debt variable as a measure of alignment mechanisms in Models M1 and M3, and find results similar to previous analyses.12 Thirdly, we replace the control variables of firm size and CFO educational level by foreign investments (fdi), CFO involvement in investment decisions (involvement) and CFO's years in the firm (firmtenure) variables.13 Results do not differ essentially in Model M1, but testing of Hypothesis 2 is strengthened by changes in joint significance of Model M2. Table 11 shows that models lose joint significance in explaining the five most commonly used techniques but gain statistical significance for the use of real options, which was previously shown to be the only technique that evidenced no statistical relation with the firm's size. Relevance of the options to grow and to modify project dimension maintain the significance of their coefficients as predicted by Hypothesis 2. The foreign investments variable only affects the frequency of use of real options, indicating that while not necessarily being the largest ones, firms competitive enough to invest overseas, are those which use real options more often. Consistent with univariate analysis results, Table 11 shows that CFOs who use sensitivity analysis more often are those with fewer years in the company but who are more involved in investment decisions. Frequency of use of NPV, IRR and PB is again positively related to the relevance of the options to switch inputs and to grow (for NPV and PB). More importantly, this new estimation reinforces the statistical significance of the relationship between long-term debt and PB, indicating that the disciplinary power of debt discourages CFO tendency to use it, although it does not serve to explain greater use of techniques such as NPV, real options or simulation.
Robustness analysis: control variables. This table presents robustness analysis to test sensitivity of results to the definition of control variables. For each technique, columns show regression coefficients and standard errors (below in parenthesis) from multivariate ordered probit regressions. The dependent variable is the frequency of use of each technique (in columns) and the independent variables are defined as in Tables 8 and 9. Control variables are defined as follows: foreign investment is a dummy taking the value 1 if the firm invests overseas and zero otherwise; yearscompany is the number of years spent in current company; and involvement is a four-level categorized variable ordered from lowest to highest involvement in investment decisions.
| NPV | IRR | PB | Real options | Simulation | Sensitivity | |
|---|---|---|---|---|---|---|
| growth | 0.206* | 0.053 | 0.243** | 0.237** | 0.050 | −0.002 |
| (0.12) | (0.12) | (0.12) | (0.12) | (0.11) | (0.11) | |
| switch | 0.293** | 0.368** | 0.337** | −0.017 | 0.025 | 0.033 |
| (0.14) | (0.15) | (0.15) | (0.15) | (0.14) | (0.14) | |
| modify | −0.064 | −0.004 | −0.149 | 0.344** | 0.435*** | −0.006 |
| (0.16) | (0.16) | (0.16) | (0.17) | (0.15) | (0.15) | |
| ltdebt | −0.224 | 0.068 | −1.075* | 0.750 | −0.343 | 0.116 |
| (0.61) | (0.59) | (0.60) | (0.61) | (0.59) | (0.59) | |
| valuation | −0.147 | −0.130 | 0.001 | 0.069 | 0.063 | −0.141 |
| (0.13) | (0.13) | (0.13) | (0.13) | (0.13) | (0.12) | |
| fdi | 0.112 | 0.235 | 0.241 | 0.578** | 0.320 | 0.310 |
| (0.27) | (0.28) | (0.28) | (0.28) | (0.26) | (0.26) | |
| involvement | 0.246 | 0.189 | 0.156 | −0.243 | 0.164 | 0.367** |
| (0.15) | (0.15) | (0.15) | (0.16) | (0.14) | (0.15) | |
| yearscompany | 0.002 | 0.010 | 0.006 | −0.004 | −0.008 | −0.031** |
| (0.01) | (0.02) | (0.01) | (0.02) | (0.01) | (0.01) | |
| N | 85 | 85 | 85 | 80 | 83 | 83 |
| LR chi2 | 14.51* | 14.01* | 20.44*** | 19.54** | 14.47* | 16.81** |
| Pseudo R2 | 0.06 | 0.07 | 0.09 | 0.09 | 0.06 | 0.07 |
| Log likelihood | −109.1 | −100.2 | −100.5 | −101.0 | −121.4 | −119.8 |
One final issue which merits further analysis is the measurement of dependent variables. Following prior research, throughout our paper our dependent variables have been defined as five-level ordered variables. Describing capital budgeting practices in this way is appropriate to explain the use of ‘universal’ tools, such as NPV, IRR, PB or even simulation and sensitivity analysis, since they are applicable to all types of investment projects, whatever their nature. However, consistent with Hypothesis 2, the real options model may be dispensable for projects with no embedded options. Despite Myers’ statement that it is hard to think of a project that does not provide any option, it would be better to identify companies using real options by elimination, removing those who state they do not apply this model under any circumstances. From this perspective, we redefined the dependent variable of use of real options as a dummy taking the value zero when CFOs state they never apply it and the value of 1 otherwise. Table 12 presents the results of re-estimating previous model specifications and this new definition of the use of real options as the dependent variable (Models M4.1 to M4.4).
Robustness analysis: dependent variable of the use of real options. This table presents robustness analysis to test sensitivity of results to the definition of the dependent variable. Columns show regression coefficients and standard errors (below in parenthesis) of independent and control variables from multivariate probit regressions. The dependent variable is a dummy taking the value zero when CFOs state that they never apply it and the value 1 otherwise. Independent and control variables are defined as in Tables 8 and 9.
| M4.1 | M4.2 | M4.3 | M4.4 | |
|---|---|---|---|---|
| growth | 0.249* | 0.234* | 0.336** | 0.309** |
| (0.13) | (0.14) | (0.13) | (0.14) | |
| switch | 0.124 | 0.151 | ||
| (0.15) | (0.16) | |||
| modify | 0.338* | 0.335* | ||
| (0.19) | (0.19) | |||
| defer | 0.207 | 0.188 | ||
| (0.14) | (0.14) | |||
| ltdebt | 1.351* | 1.346* | 1.366* | 1.337* |
| (0.74) | (0.75) | (0.74) | (0.74) | |
| ownership | 0.147 | 0.249 | ||
| (0.45) | (0.44) | |||
| valuation | 0.054 | 0.102 | ||
| (0.17) | (0.16) | |||
| size | 0.233** | 0.221* | 0.172 | 0.169 |
| (0.17) | (0.12) | (0.11) | (0.11) | |
| mba | −0.435 | −0.447 | −0.497 | −0.441 |
| (0.31) | (0.33) | (0.32) | (0.32) | |
| const | −3.478*** | −3.473*** | −2.441*** | −2.384*** |
| (1.14) | (1.14) | (0.90) | (0.91) | |
| N | 86 | 85 | 87 | 86 |
| LR chi2 | 16.66** | 17.15** | 14.35** | 14.14** |
| Pseudo R2 | 0.14 | 0.15 | 0.12 | 0.12 |
| Log likelihood | −49.8 | −48.6 | −51.8 | −51.1 |
The estimated coefficients confirm that company tendency to use real options increases with the relevance of options to grow and resize investments. The main difference compared to previous analyses is the significance of the variable of size in two of the model specifications in Table 12. Taking this result together with previous conclusions, we can interpret that the size of the firm may affect access to real option models, but has no impact on how often they are used. Something similar could be said of long-term debt. Although moderate, the statistical significance of its coefficient indicates that pressure exerted by long-term debt on managerial behaviour seems to be effective in adopting real options, but does not influence its frequency of use.
ConclusionInterest in whether CFOs apply capital budgeting models as proposed by scholars has inspired a stream of research which has produced somewhat disturbing results. Compared to the speed with which other kinds of innovations are embraced in firms, new capital budgeting tools are adopted surprisingly slowly. It seems CFOs tend to progressively accumulate techniques, and to avoid abandoning old and theoretically inferior ones. This diagnosis does not vary greatly across countries.
This paper also confirms this pattern for the Spanish case: CFOs simultaneously use numerous tools, those being applied most often being precisely the ones least recommended by scholars. Our findings confirm that the most favoured technique is PB, followed some way back by IRR and NPV. The popularity of PB among Spanish CFOs is significantly higher than in other European and North American countries. Exploring possible reasons behind the popularity of PB has received wide attention. Proposals range from its simplicity or harmony with short-sighted managerial practices to its usefulness in substituting more sophisticated and complex tools to measure a number of value ingredients from investments. Our analysis reveals that PB is applied more often by larger firms, as are NPV and IRR, but also by CFOs who feel more involved in their firm's capital investments. The least popular technique is the real options approach, which is theoretically the most appropriate model to capture the value of strategic investment results. Contrary to what has been argued previously, our analysis indicates that how often this model is used does not depend on the size of the firm or the CFO's educational background.
The contribution of this paper goes beyond simply updating and extending available evidence for the case of Spain. Prior research into the theory and practice of capital budgeting techniques has focused on measuring the “gap” and analyzing its statistical relationship with general variables, such as the size of the firm, the sector of industry in which it operates or its CFO's profile. Our paper studies the explanatory power of complementary arguments based on the effect of mechanisms aligning managerial and shareholder incentives or the relevance of growth options and flexibility as sources of investment value.
Empirical evidence used in testing our hypothesis reveals that the agency theory hypothesis concerning the influence of alignment mechanisms, such as debt and managerial ownership, on managerial behaviour, would not be directly extrapolated to capital budgeting practices. Contrastingly, our results confirm the prevalence of the nature of sources of value in explaining the choice of techniques such as real options. Despite being used little, our findings indicate that real options is an approach which has been adopted more in companies where growth and flexibility prove more relevant among their sources of value. This result ties in with the idea that the most appropriate technique is not always the most sophisticated and that its suitability depends on the nature of the sources of value. NPV is one particular case of real options, such that both techniques report similar results in the evaluation of projects with worthless options. From this perspective, capital budgeting practices could not be judged without reference to each firm's particular sources of investment value.
Apart from the theory–practice gap, previous empirical studies have revealed that CFOs often use more than one different tool simultaneously. The hypothesis of progressively accumulating techniques provides a valid explanation for both maintaining ‘old’ practices and using multiple tools. CFO risk aversion and their concern vis-à-vis recommending an incorrect decision in a context of uncertainty discourage old practices from being abandoned and further encourage the accumulation of multiple and different calculations. Such a collection might be perceived as a way to improve analysis efficiency, particularly when CFOs distrust what are theoretically the best techniques. One direct consequence of such behaviour is that tools which are theoretically outdated will not be replaced by practitioners in the manner scholars have predicted. This circumstance probably alters the evidence analyzed and influences the results obtained by studies such as ours, preventing identifying an even clearer relationship between the use of the most advanced techniques and sources of value or alignment mechanisms.
A further limitation of this study stems from the econometric estimation used to test our hypotheses. Multivariate ordered probit regressions are appropriate to the nature of the information analyzed and, particularly, ordered multiple-level dependent variables. However, multivariate ordered probit is not without methodological caveats, especially when dependent variables do not adjust to a normal distribution. One possible solution – and a future research line – is the use of data mining, such as the C5.0 algorithm or artificial intelligence techniques, which can help overcome probit model limitations and provide additional inductive explanations.14
Despite these limitations, this study heralds a step forward in bridging the gap between capital budgeting theory and practice, and has implications for both research and practice. As regards research, our findings suggest the influence of issues thus far overlooked in this type of analysis, whose consideration may contribute to a more precise definition of the problem and, in any case, confirms the need for additional empirical tests. In the context of practice, our analysis provides a more optimistic view of CFO choice of mechanism, which seems to respond to the nature of the projects evaluated and is not just a matter of resource availability and educational background.
Authors acknowledge comments from Valentín Azofra, Ana Isabel Rodriguez, Juan Carlos Rebollo, Igor Renedo, Oscar Sarmiento and Ignacio Magro on the questionnaire design. Completion of this research would not have been possible without the cooperation of those Chief Financial Officers who selflessly answered the questionnaire. This work has benefited from financial support from the Spanish Ministry of Science and Innovation (grant ref. ECO2011-29144-C03-01) and the Program of Advanced Human Capital Formation, Ministry of Education, Government of Chile. The authors assume all responsibility for any errors in this work.
Tel.: +34 983 423 334.
Tel.: +56 41 2345509.
See, among others, Richard A. Brealey, Stewart C. Myers and Franklin Allen: Principles of Corporate Finance (McGraw-Hill/Irwin) or Stephen A. Ross, Randolph W. Westerfield and Jeffrey Jaffe: Corporate Finance (McGraw-Hill/Irwin).
In a similar analysis, Alessandri et al. (2007) find values between 18 and 86% depending on a firm's sector of activity.
Mailing information was obtained from “The 5,000 largest Spanish companies” directory published in 2010 by the magazine Actualidad Económica. This ranking is based on firm sales revenue as of December 2009. As in similar papers, financial companies were not included, due to their special characteristics.
A few open-ended questions were used such as sales revenue, ratio of debt on total assets and CFOs’ time working, time working in the firm and time as CFO.
See Armstrong and Overton (1977). We considered early respondents as those returning the survey by March 31, 2011, 40 days after the mailing date.
In Graham and Harvey (2001) and Brounen et al. (2004) most CFOs in the samples were between 50 and 59 years old.
When the dependent variable measures ordered multiple-choice answers, linear estimation techniques would present errors related to interpreting value distances, while multivariate logit and multivariate probit fail to consider the order of responses (Greene, 2012).
As explained in the section “Variables and econometric models”, these two model specifications are defined on the basis of statistical correlation of independent variables.
For reasons of space we do not include these results here, but interested readers can obtain them on request directly from the authors.