


Strains of Saccharomyces cerevisiae may display characteristics that are typical of rough-type colonies, made up of cells clustered in pseudohyphal structures and comprised of daughter buds that do not separate from the mother cell post-mitosis. These strains are known to occur frequently in fermentation tanks with significant lower ethanol yield when compared to fermentations carried out by smooth strains of S. cerevisiae that are composed of dispersed cells. In an attempt to delineate genetic and phenotypic differences underlying the two phenotypes, this study analysed 10 microsatellite loci of 22 S. cerevisiae strains as well as stress resistance towards high concentrations of ethanol and glucose, low pH and cell sedimentation rates. The results obtained from the phenotypic tests by Principal-Component Analysis revealed that unlike the smooth colonies, the rough colonies of S. cerevisiae exhibit an enhanced resistance to stressful conditions resulting from the presence of excessive glucose and ethanol and high sedimentation rate. The microsatellite analysis was not successful to distinguish between the colony phenotypes as phenotypic assays. The relevant industrial strain PE-2 was observed in close genetic proximity to rough-colony although it does not display this colony morphology. A unique genetic pattern specific to a particular phenotype remains elusive.
The Brazilian industrial fermentation process for fuel alcohol production has certain atypical characteristics that allow for the entry and growth of wild yeast strains. The conditions are so conducive to wild-yeast growth that occasionally their development is found to compete with that of the selected starter yeast strain. One of the major reasons for this is that the methodology followed by the Brazilian ethanolic fermentation industry does not rigorously implement sterile conditions; other prominent reasons include yeast recycling along with sugarcane harvesting.1 As a result of the above mentioned reasons, contamination by wild strains of Saccharomyces has a very frequent occurrence in the bioethanol industry. At times it has been observed that the growth patterns of the indigenous strains are so robust that they dominate the fermentation process to the extent of replacing the starter yeast strain. The status or influence of the contaminant strains in the fermentation process is dependent upon characteristics such as the fermentative performance, cell sedimentation rate, filamentation as well as biofilm development.2 Indigenous strains with rough colony morphology are frequently observed during the ethanolic fermentation process and are associated with pseudohyphal growth and high sedimentation rate; these strains result in problems that are similar to those observed for flocculent strains.3,4 As a word of caution, it is to be noted that the cell aggregation caused as a result of pseudohyphae should not be confused with flocculation.
Chain formation in yeast is observed when the younger bud fails to separate from the mother cell5; under such circumstances the newer cell remains attached to the parent post-mitosis leading to the formation of ‘snowflake yeasts’.6
A study conducted by Reis et al.,4 comparing rough-colony strains with their smooth-colony counterparts, demonstrated that the rough-colony strains have significantly lower and slower fermentative kinetics when monitored in a batch system over a 48-h period under conditions where sugarcane juice was used as the substrate. High residual sugar concentration has been documented to be a factor that is closely associated with the presence of wild S. cerevisiae strains in the fermentation process.3,4
Environmental conditions are known to be key factors capable of influencing and affecting differences in colony and cell morphology.7,8 In addition, signalling cascades such as the MAPK, TORC, SNF1 and RIM101 pathways, are also known to be involved in influencing morphological changes.8 However, in the latter case, the resultant morphological changes are usually of a transitory nature.9,10
Curiously, in spite of the presence of clear demonstrable differences in colony morphology and cell arrangement between smooth-colony and rough-colony strains, the restriction analysis of mitochondrial DNA and PGFE (chromosome karyotyping) both failed to uncover any underlying genetic differences. The differences in morphology were concluded to be a consequence of environmental conditions that influence and cause differential gene expression.11 Kuthan et al.12 reported that Ty-coding genes and subtelomeric genes that are induced by stress conditions interfere with the colony morphology of yeasts. A report by Cavalieri et al.13 that analysed metabolic patterns indicated that there were significant differences in the gene expression profiles of the colony variants (filigreed, rough and smooth) especially with respect to ammonia and amino acid transporters.
In that direction, a study by Ratcliff et al.6 that compared a unicellular strain of S. cerevisiae and an evolved strain of snowflake yeast showed that 1035 genes were significantly differentially expressed between the two. The authors noted that seven of the ten most downregulated genes were regulated by the transcription factor ACE2 in conditions wherein both ACE2 alleles were identical in the diploid state of the yeast. A study by Rodrigues14 on spontaneous derivatives of JAY270/PE-2 presenting an altered colony morphology (roughened surfaces, irregular edges, cell sedimentation resembling flocculation in liquid media) revealed that loss of heterozygosity of the gene ACE2 (as a result of frameshift mutation) was responsible for the development of the rough-colony phenotype. PE-2 is one of the most important industrial yeast strains used in the Brazilian distilleries.3ACE2 heterozygosity should be investigated in the yeast strains displaying rough-colony morphology frequently isolated from the ethanolic fermentation to assess the real origin of this phenotype.
In spite of clear differences in colony morphology and cell arrangement, in depth analysis into genetic differences between smooth and rough-colony strains have failed to reveal the presence of any underlying variations at a DNA level so far. The PCR microsatellite methodology has been extensively used for S. cerevisiae strain identification especially when assessing the wine fermentation populations15–17; more recently this technology has been used for assessing the biodiversity of native bioethanol yeast strains.18 This technique has been revealed to be sensitive and robust enough to detect the extensive genetic diversity of the indigenous strains of S. cerevisiae in Brazilian ethanol-producing units.18
Microsatellites or SSRs (Simple Sequence Repeats) are short segments of DNA that are repeated in tandem and are known to be co-dominantly inherited and dispersed throughout the genome.19 The sixteen chromosomes of S. cerevisiae genome are known to be very rich in the presence of microsatellites as well as numerous polymorphic alleles.20 Perez et al.19 evaluated the genetic variability of 51 isolates of S. cerevisiae using the microsatellite methodology. With the use of six microsatellites they uncovered a total of 57 alleles and generated 44 genotypes.
Despite the result of loss of heterozygosity of ACE2 to be the probable origin of rough-colony morphology in S. cerevisiae,6,14 previous studies here reported were more conclusive regarding to the differences in gene expression than to the genetic differentiation at DNA level between different S. cerevisiae phenotypes. In view of the remarkably high discriminatory power of the microsatellite marker-based assessment, this technique was applied in our study in an attempt to evaluate the genetic variability amongst strains of S. cerevisiae isolated from industrial ethanol units. The ultimate objective of the study was to discover a genetic pattern that could be used to differentiate between the two colony phenotypes (rough and smooth). Additionally, the phenotypic characteristics such as resistance to stress and cell sedimentation were also surveyed. It was hypothesised that the association between molecular traits and phenotypic features could help in differentiating between colony phenotypes which in turn would discriminate them into separate groups to be treated differently in the fermentation unit.
Materials and methodsYeast strains, identification and culture conditionsYeast cultures of both smooth and rough colonies were collected from different ethanol-producing units (Table 1) and subjected to PCR and ITS region sequencing (primers ITS-1 and ITS-4)21 to confirm identity as S. cerevisiae. The PCR conditions employed for ITS amplification were as described before.18 Following identity confirmation, twenty-two strains (eleven from each colony phenotype) were selected for microsatellite and stress resistance analysis. These strains were maintained on YPD (w/v: 1% yeast extract, 2% glucose, 2% peptone, 2% agar; for broth preparation, agar was omitted) slants at 4°C with regular transfers to new medium.
Saccharomyces cerevisiae strains analysed by microsatellite markers, for stress resistance and cell sedimentation rate.
| Strain | Ethanol-producing unit | Code of isolation | Colony morphology |
|---|---|---|---|
| 2 | Usina Santa Adélia | VF4 | Smooth |
| 3 | Usina Santa Adélia | VF5 | Smooth |
| 4 | Usina Santa Adélia | VF6 | Rough |
| 6 | Usina Santa Adélia | VF8 | Rough |
| 7 | Usina Santa Adélia | VF9 | Rough |
| 8 | Usina Santa Adélia | VF10 | Rough |
| 9 | Usina Santa Lúcia | 45 | Rough |
| 10 | Usina Santa Lúcia | 47 | Rough |
| 12 | Usina Santa Lúcia | 51 | Smooth |
| 15 | Usina Santa Lúcia | 2 | Smooth |
| 16 | Usina Diamante | 385 | Rough |
| PE2 | Usina da Pedra | PE-2 | Smooth |
| 18 | Usina Santa Lúcia | FM | Smooth |
| 19 | Unknown | URC | Rough |
| 33 | Usina Santa Adélia | A1 | Smooth |
| 35 | Usina Santa Adélia | M1 | Rough |
| 36 | Usina Santa Adélia | M2 | Smooth |
| CAT1 | Usina VO Catanduva | CAT-1 | Smooth |
| BG1 | Usina Barra Grande | BG-1 | Smooth |
| SA1 | Usina Santa Adélia | SA-1 | Smooth |
| 47 | Usina Santa Adélia | VF-1 | Smooth |
| 52 | Usina Santa Adélia | SA9-1 ROUGH | Rough |
A total of ten microsatellite loci (Table 2) were analysed by capillary electrophoresis and the patterns thus obtained were used for creating a phenetic tree. Population 1.2.30 software with algorithm Minimum Genetic Distance – DM22 for distance method and Unweighted Pair Group Method with Arithmetic Mean (UPGMA) as the clustering method were used for this purpose. The reaction conditions for microsatellite amplifications, capillary electrophoresis and diversity population analysis were described previously by Antonangelo et al.18
Microsatellite loci on Saccharomyces cerevisiae chromosomes, Open Reading Frames (ORF) and primer sequences (forward/fw; reverse/rv). The numbers in superscript (in Loci name) are related to the references wherein the primer designs were obtained.
| Loci name | Chromosome – coordinates | ORF | Primer sequence |
|---|---|---|---|
| G115,30 | XVI – 536832-536675 | SC8132X | Fw: 5′CTGCTCAACTTGTGATGGGTTTTGG 3′ Rv: 5′CCTCGTTACTATCGTCTTCATCTTGC 3′ |
| G219,27,31 | XIII – 87140-86862 | YMLO91C | Fw: 5′AAAAGCGTAAGCAATGGTGTAGAT 3′ Rv: 5′AGCATGACCTTTACAATTTGATAT 3′ |
| G315,16,27,30,31 | XV – 823021-822769 | YOR267C | Fw: 5′TACTAACGTCAACACTGCTGCCAA 3′ Rv: 5′GGATCTACTTGCAGTATACGGG 3′ |
| G415,16,27,30,31 | XVI – 536841-536424 | YPL009C | Fw: 5′AACCCATTGACCTCGTTACTATCGT 3′ Rv: 5′TTCGATGGCTCTGATAACTCCATTC3′ |
| G516,19,27,31 | IV – 778622-779023 | YDR160W | Fw: 5′TGGGAGGAGGGAAATGGACAG 3′ Rv: 5′TTCAGTTACCCGCACAATCTA 3′ |
| G616,27 | VI – 210262-210403 | YFR028C | Fw: 5′GTGTCTTGACACAATAGCAATGGCCTTCA 3′ Rv: 5′GCAAGCGACTAGAACAACAATCACA 3′ |
| G716,19,27,31 | VII – 245604-245701 | YGL139W | Fw: 5′CTTTTTATTTACGAGCGGGCCAT 3′ Rv: 5′AAATCTCATGCCTGTGAGGGGTAT 3′ |
| G816,19,27,31 | VII – 467642-467744 | YGL014W | Fw: 5′CAGGTCGTTCTAACGTTGGTAAAATG 3′ Rv: 5′GCTGTTGCTGTTGGTAGCATTACTGT 3′ |
| G1215,16,19,31 | XIII – 86902-87140 | SCAAT1 | Fw: 5′AAAGCGTAAGCAATGGTGTAGATACTT 3′ Rv: 5′CAAGCCTCTTCAAGCATGACCTTT 3′ |
| G1316,19,31 | IV – 776163-778721 | YDR160W | Fw: 5′TGGGAGGAGGGAAATGGACAG 3′ Rv: 5′TTCAGTTACCCGCACAATCTA 3′ |
Phenotypic characterisation was performed based on the resistance to the stress and cell sedimentation rate. To verify resistance to low pH, yeast cells were transferred from the YPD dishes to a saline solution and the cell concentration was adjusted so as to yield a final count of ca. 108cells/mL. A 10μL aliquot was plated onto a Petri dish containing YPD with the following pH values: 6.0, 5.0, 4.0, 3.0, 2.0, 1.75, 1.5, 1.25, 1.0. The inoculated dishes were incubated at 30°C for 4 days. Yeast growth was scored as (1) and absence of growth as (0). In order to avoid liquefaction of the culture medium due to the low pH, agar was sterilised in a low amount of water separately from the solution in which the other nutrients of the medium were dissolved. The nutritive solution was adjusted to the required pH value prior to sterilisation. Following autoclaving, both solutions (agar and nutritive solutions) were mixed, at 55°C, and immediately poured into sterile Petri dishes.
The same procedure was utilised for the preparation of Petri dishes containing YPD (pH 6.0) with ethanol in final concentrations of 0, 3, 6, 9, 12, 12.5, 13, 13.5, 14, 14.5, 15, 18, 21% (v/v). Subsequent to inoculation, the Petri dishes were wrapped in plastic film in order to avoid ethanol evaporation. Growth was evaluated in the inoculated Petri dishes after 4 days of incubation at 30°C and scored as described below.
YPD (pH 6.0) with glucose in the final concentrations of 100, 150, 200, 250, 300, 400 and 500g/L was also utilised to verify resistance of the yeast strains to high sugar concentrations. The procedures followed for yeast inoculation, incubation and growth score were the same as described above.
The cell sedimentation assay was performed according to the protocol described by Wang et al.23 and modified by Reis et al.4 After growth in the multiplication medium (sugar cane juice with approximately 4% reducing sugars), the cells were collected by centrifugation, washed twice with sodium citrate buffer (50mM; pH 3.0) containing 5mM EDTA and then washed again with water at 4°C. The cells were resuspended in chilled distilled water and diluted or concentrated until an OD (600nm) of 2.0 was reached (Thermo Biomate® spectrophotometer). After vigorous shaking, samples from the upper portion of the tube were taken at 0min and 10min intervals and the OD (600nm) was obtained. The sedimentation rate (%) was calculated as follows: sedimentation (%)=[(OD0min−OD10min)×100]/OD0min.
The Principal-Component Analysis (PCA) was applied to the results of phenotypic characteristics, considering a binary matrix of data in which the lines contained the yeast strains and the columns represented absence of growth (level 0) or growth (level 1) for each characteristic analysed (resistance to low pH, high sugar concentration, high ethanol concentration). For cell sedimentation assay, the levels 0 and 1 were applied to results below 10% or higher than 10%, respectively. The function ‘prcomp’ of the statistical software R were utilised for the PCA.24
ResultsThe molecular-typing work was performed with a group of 22 S. cerevisiae strains isolated from alcohol-producing units which was separated by the characteristics of colony and cell morphology in two groups: ‘smooth’ and ‘rough’ colony phenotypes. The aspects of colony and cell morphology of both phenotypes are illustrated in Fig. 1. Genetic analysis by microsatellite assay by using 10 microsatellite loci did not reveal the clustering of yeasts within the groups ‘smooth’ and ‘rough’ colony phenotypes. The greatest genetic similarity was observed indeed between yeast strains from divergent colony types, as strains 47 and 35, or 33 and 52 (lower left branch of the tree). Interestingly, the industrially relevant strain PE-23 was found close to rough-colony strains in the upper left branch of the tree (Fig. 2).
 and cells (magnification of 400× at optical microscopy) of a smooth colony (left) and a rough colony (right) of S. cerevisiae strains (Reprinted from Reis et al.4).")
Colony (growing in YPD medium) and cells (magnification of 400× at optical microscopy) of a smooth colony (left) and a rough colony (right) of S. cerevisiae strains (Reprinted from Reis et al.4).
. Rough-colony strains are denoted in circles; smooth-colony strains in squares.")
Phenetic tree created with the microsatellite loci by using the Population 1.2.31 software and UPGMA clustering method. The legend inside the box is referent to the strain code (as in Table 1). Rough-colony strains are denoted in circles; smooth-colony strains in squares.
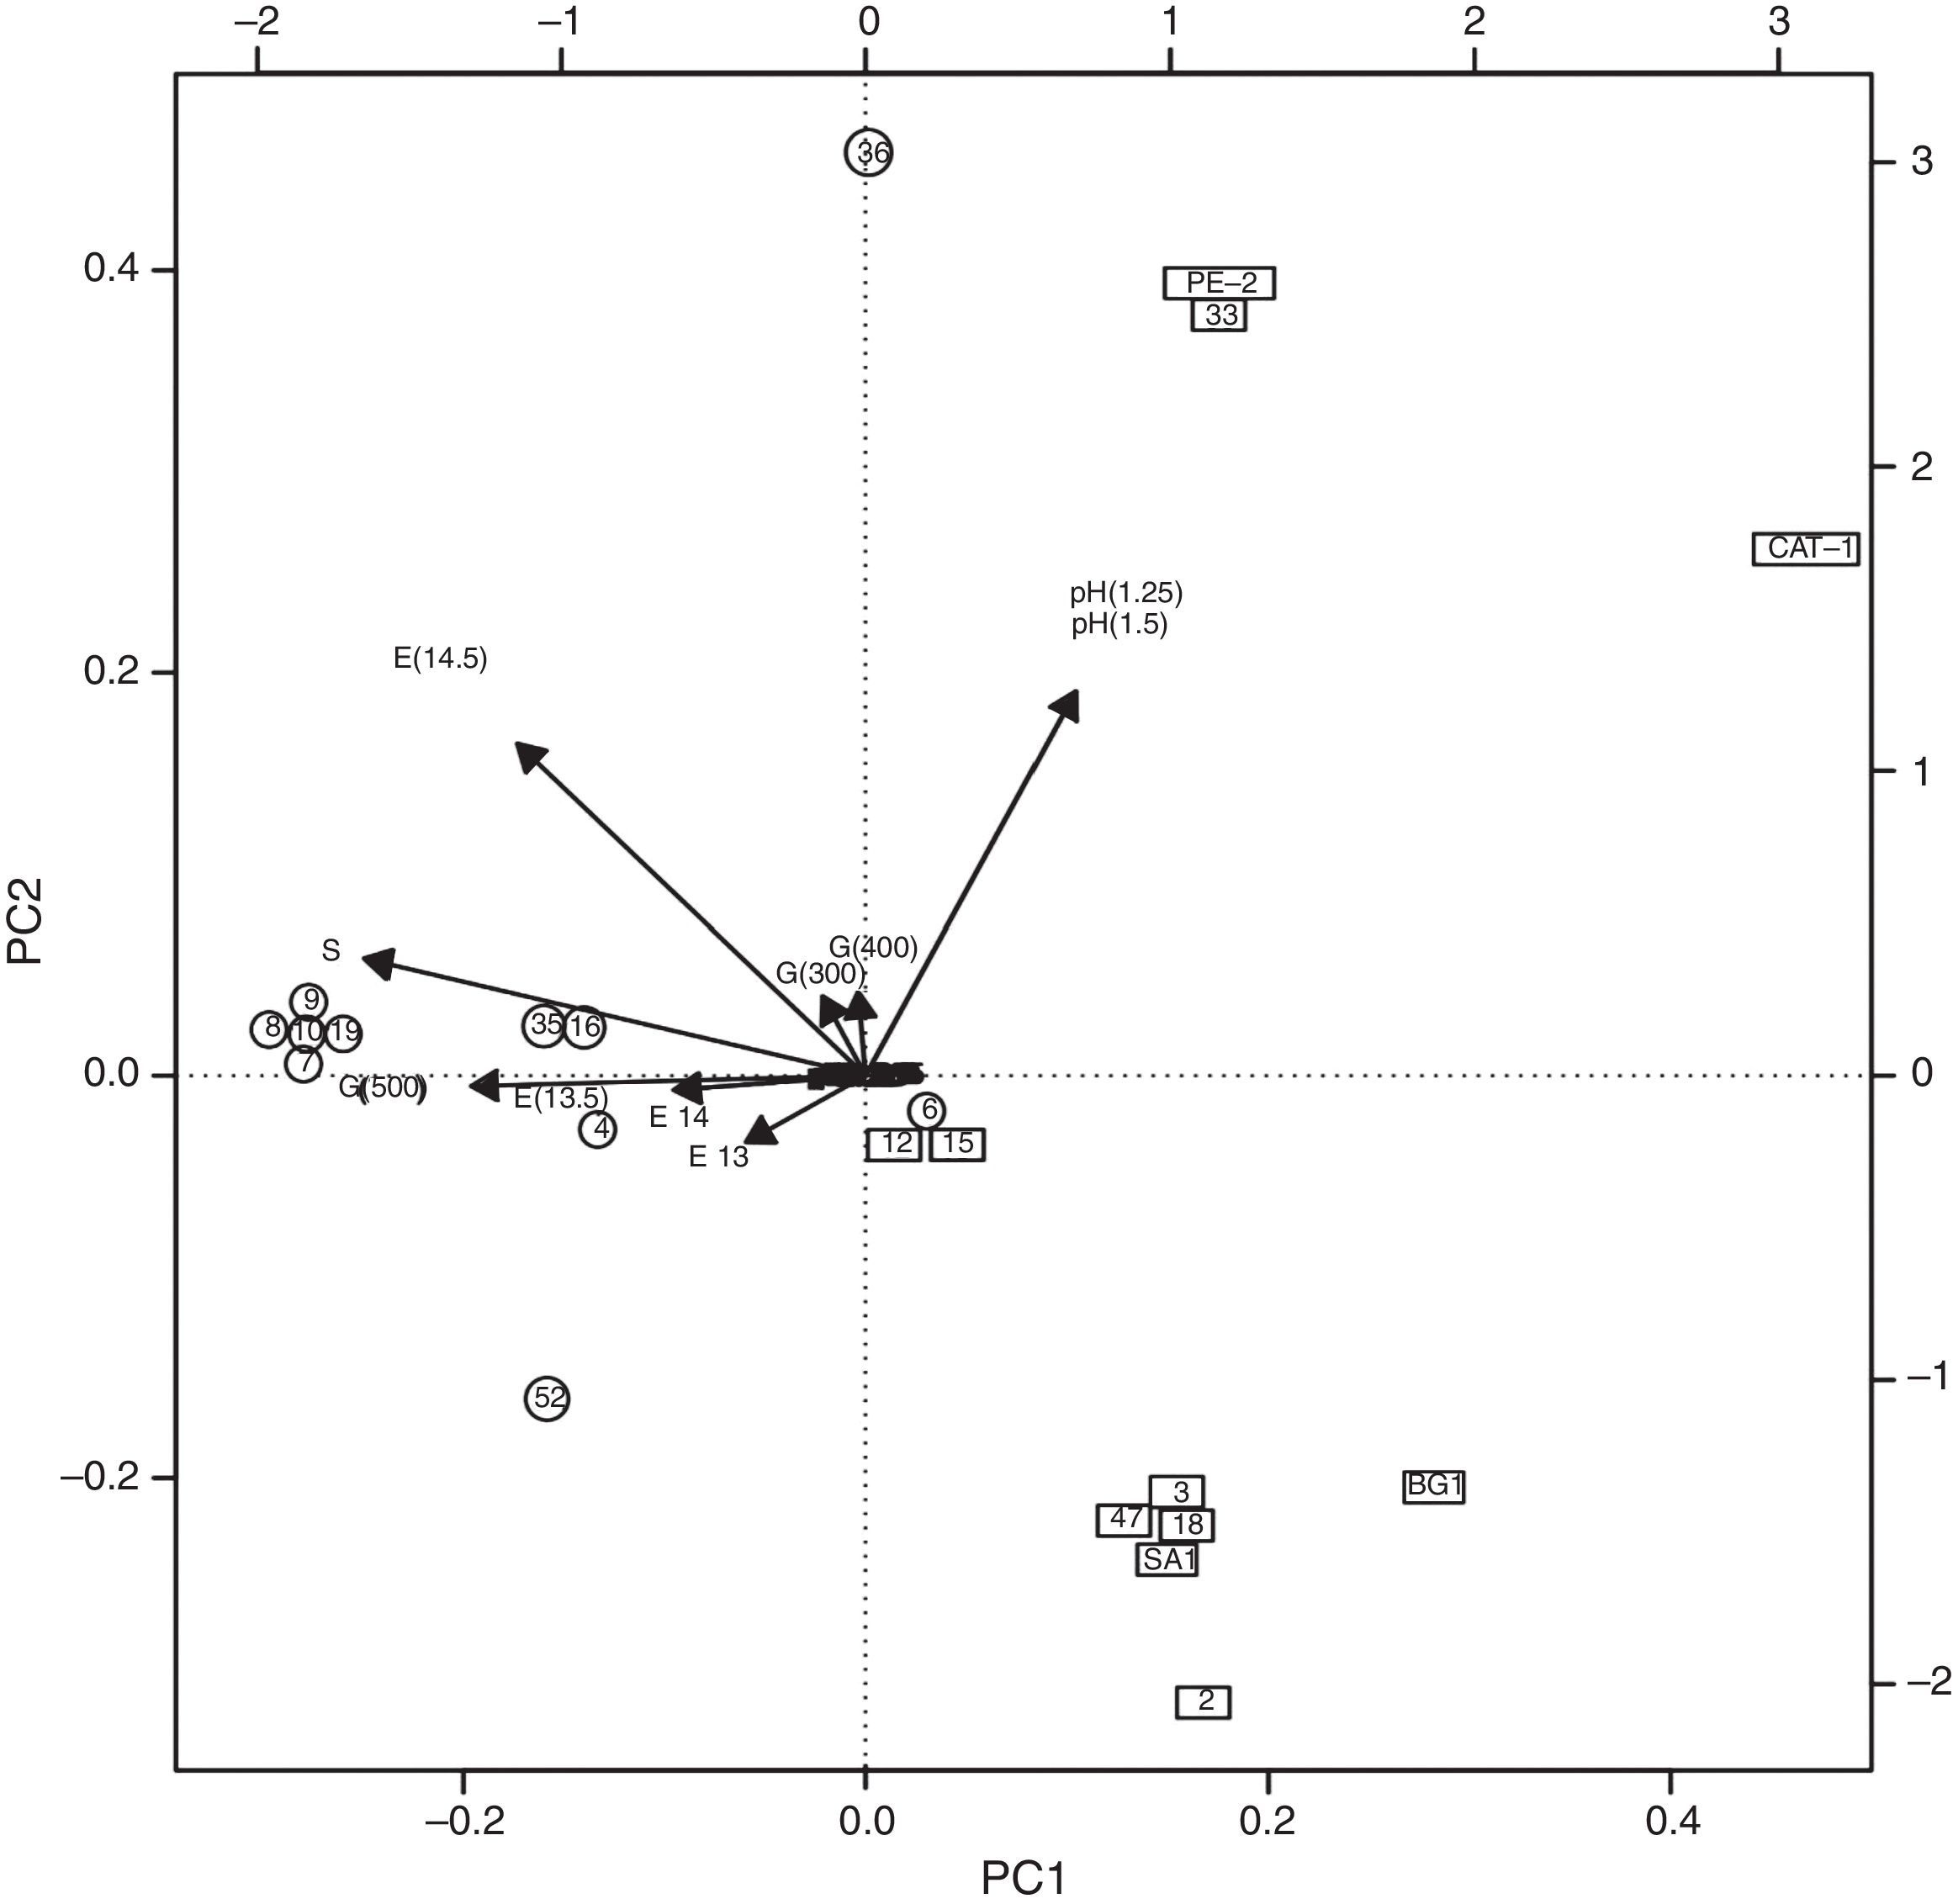
Phenotypic characteristics based on the resistance to the stress and cell sedimentation rate were then analysed in an attempt to cluster the strains. Upon applying the PCA method to the set of four phenotypic characteristics and their sublevels, a biplot was obtained and shown in Fig. 3. The PCA-1 explained 73.62% of the data total variability. The most pronounced effect observed in Fig. 3 is the strong opposite contributions made to PC1 by the resistance to low pH (1.25 and 1.5) displayed by industrial yeast strains CAT-1 and PE-2 in the right upper quadrant, on the one hand, and rough-colony yeasts (eight out of eleven strains) to the resistance of both high ethanol and sugar concentrations besides sedimentation rate in the left at the middle, on the other hand. Other rough-colony strains were found in the upper quadrant (strain 36), a little distant from the industrial yeast strains because of the high sedimentation rate as well; the strain 06 due to the exclusively resistance to high ethanol concentration in the middle of the PCA biplot; and the strain 52 due to the sensitivity to low pH but resistance to high sugar concentration and high sedimentation rate, closer to the rough-colony strains than to the smooth-colony strains.
 of the yeast strains (rough-colony strains in circles; smooth-colony strains in squares) and the phenotypic characteristics. Numbers inside the circles and squares refer to the strain code as in Table 1. The legends in the vectors designate the phenotypic characteristics and the number in parentheses indicate the values (pH 1.25 and 1.5; E for ethanol, 13, 13.5, 14, 14.5%; G for glucose, 300, 400 and 500g/L; S for sedimentation rate, above 10%) of the characteristic, as described in “Material and methods” section.")
Principal-Component Analysis (PC1 and PC2) of the yeast strains (rough-colony strains in circles; smooth-colony strains in squares) and the phenotypic characteristics. Numbers inside the circles and squares refer to the strain code as in Table 1. The legends in the vectors designate the phenotypic characteristics and the number in parentheses indicate the values (pH 1.25 and 1.5; E for ethanol, 13, 13.5, 14, 14.5%; G for glucose, 300, 400 and 500g/L; S for sedimentation rate, above 10%) of the characteristic, as described in “Material and methods” section.
The isolation of the majority of smooth-colony strains in the right inferior quadrant (6 out of 11) in Fig. 3 revealed its sensitivity to low pH, high sugar and ethanol concentrations and sedimentation rate below 10%. One smooth-colony strain was put together to PE-2 and other two (strains 12 and 15) were placed in the middle of the biplot due to the resistance to ethanol. Other parameters analysed in this study (<300g/L glucose; <13% and >14.5% ethanol; pH <1.25 and >1.5) did not represent significant variation for this group of strains. For this reason they crowded at point zero of the biplot (Fig. 3).
In summary, the rough-colony strains are found in the left side of the biplot 1 (except for strain 06 which is quite close to the limit) in which the parameters: sedimentation rate, high sugar and ethanol concentrations together with low pH were key determinants in the distribution of the strains; on the other hand, all the smooth-colony strains were found on the right side of the biplot, together with resistance to ethanol and low pH.
DiscussionAn analysis of results obtained from the phenotypic tests by PCA revealed that unlike the smooth colonies, the rough colonies of S. cerevisiae exhibited an enhanced resistance to stressful conditions resulting from the presence of excessive glucose and ethanol. Results obtained by Voordeckers et al.8 verified that wrinkly (rough) colonies of S. cerevisiae were more resistant to other stressors such as heat and desiccation.
Della-Bianca et al.25 reported that PE-2 cells exhibited a superior survival rate under non-proliferative conditions, such as pH 1.5, as compared to regular laboratory or commercial yeast strains. A study conducted by Bassi et al.26 demonstrated that PE-2 was only minimally affected by cell treatments based on low pH and or ethanol addition.
The microsatellite analysis was not successful to distinguish between the colony phenotypes as phenotypic assays. Analysis by RFLP-mtDNA and electrophoretic karyotyping (PFGE) were also ineffective to distinguish the smooth strain from the rough strain.11 Jubany et al.27 verified the polymorphisms at microsatellite loci and single nucleotide polymorphisms (SNPs) for molecular genotyping of S. cerevisiae strains and no correlation could be established between pseudohyphal growth, flocculation and SNPs in FLO8 gene, which is required for flocculation and filamentous growth. Antonangelo28 has not also found SNPs for the genes FLO1, FLO8 and MSS11 when smooth and rough-colony strains were analysed. It may suggest that differences between the colony types of S. cerevisiae may be attributed to differences in gene expression rather than DNA sequences as observed before.11 The genetic approach also failed to reveal the presence of specific molecular markers that could be used to discriminate between the rough and smooth colonies and define genetic characteristics associated with colony phenotype.
The presence of PE-2, a strain displaying smooth colonies and dispersed cells, in close genetic proximity to rough-colony strains is intriguing. PE-2 and CAT-1 are the two most popular and relevant strains of S. cerevisiae used by the Brazilian distilleries.3 PE-2 is an extremely persistent and dominant yeast strain in the fermentation tanks scenario. This important industrial strain is non-flocculant in pure culture.29 According to Basso et al.,3 rough colonies were observed in selected industrial strains (0–10% of the colonies for each strain), including in PE-2, during their implantation into ethanol-producing units.
There was no association between the microsatellite marker-based data and the stress resistance profile in discriminating between rough- and smooth-colony strains of S. cerevisiae. However, it was instrumental in providing new insights into the probable origins of the rough-colony strains. Recent studies have indicated that disruption of a single gene, ACE2, is responsible for the snowflake phenotype of the yeast strain Y556 as well as in the industrial yeast strain PE-2.14 However, for the rough and smooth colony strains here studied, we did not observe this finding when ACE2 gene was assessed (data not published).
In summary, this study revealed that the two major groups based on colony phenotype (smooth and rough colonies) in S cerevisiae had clear differentiation regarding stress resistance to high sugar and ethanol concentrations, low pH and high cell sedimentation rate. The genetic principles (gene expression patterns as well as sequence-level variations in genes regarded to stress resistance to high ethanol and sugar concentrations) that define and account for the rough-colony phenotype in S. cerevisiae pose an extremely relevant question that deserves a thorough analysis. It lies at the heart of an important issue and needs to be intensively studied in order to verify the origins of this colony phenotype with respect to bioethanol fermentation. Results of such a study may define principles that could help us avoiding or minimising the occurrence of rough-colony formation in S. cerevisiae.
ConclusionsThe microsatellite analysis was not successful to distinguish between the colony phenotypes as phenotypic assays. Unlike the smooth colonies, the rough colonies of S. cerevisiae exhibit an enhanced resistance to stressful conditions as high concentrations of glucose and ethanol and high sedimentation rate. The relevant industrial strain PE-2 was observed in close genetic proximity to rough-colony although it does not display this colony morphology. A unique genetic pattern specific to a particular phenotype remains elusive.
Conflicts of interestThe authors declare that they have no conflict of interest.
This study was supported by Fundação de Amparo a Pesquisa do Estado de São Paulo (research support 2009/14617-4) and Coordenação de Aperfeiçoamento de Pessoal de Nivel Superior (fellowship to the first author).