


Associations between liver function and serum IgE levels have recently been observed in children. However, the relationship in adults is unclear. Therefore, it was aimed to study associations of liver function and serum total and food-specific IgE concentrations in a national and population-based study.
MethodData were retrieved from the United States National Health and Nutrition Examination Surveys, 2005–2006 including demographics, liver status tests, biomarkers, lifestyle factors, and serum total and food-specific IgE concentrations. Participants aged 20 and above were included. Analyses included t-test, chi-square test, and survey-weighted regression modelling.
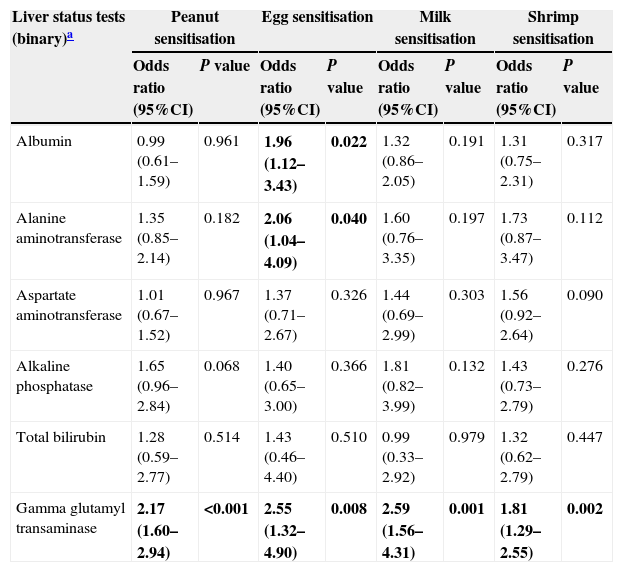
ResultsAfter adjusting for age, sex, ethnicity, vitamin D, waist circumference, family poverty income ratio, total cholesterol, ever asthma, total protein, and survey weighting, abnormal gamma glutamyl transpeptidase was significantly associated with food sensitisation (peanut: OR 2.17, 95%CI 1.60–2.94, P<0.001; egg: OR 2.55, 95%CI 1.32–4.90, P=0.008; milk: OR 2.59, 95%CI 1.56–4.31, P=0.001; shrimp: OR 1.81, 95%CI 1.29–2.55, P=0.002). Moreover, both abnormal albumin and alanine transaminase were associated with egg sensitisation (OR 1.96, 95%CI 1.12–3.43, P=0.022 and OR 2.06, 95%CI 1.04–4.09, P=0.040, respectively).
ConclusionAbnormal liver status tests were correlated with serum food-specific IgE concentrations in adults. Future research with longitudinal design or in clinical settings may be warranted confirming or refuting the observations made in the present epidemiological study.
Previously, it was estimated that the prevalence of food allergy in the US may be nearly 4% (higher for food sensitisation) and associated demographic factors included age, sex, and ethnicity.1,2 Moreover, an updated review article also described that family history, obesity, vitamin D, dietary fat, asthma, and environmental exposures could pose certain risks as well.3,4 In addition to those observed effects from the above-mentioned, relationship between liver function and serum IgE levels was also noted, although mainly in patients with transplantation.5,6 Recently, associations between liver dysfunction and food sensitisation (particularly peanut and egg) have been observed in children with early onset liver dysfunction requiring transplantation.7,8 Acute and chronic liver disease have been recognised to be associated with absent delayed cutaneous hypersensitivity responses. Some food allergic children were observed to fail to manifest their food allergy due to the immune anergy caused by their liver failure.9 Host factors such as the maturity of immune regulatory mechanisms and a role for haematopoietic tissue were then hypothesised to have played a critical role in the development of new food allergy after a liver transplant in children.8 Taken together, the role of liver (dys)function in human food allergy pathogenesis should be given wider attention. Following this context, therefore, it was aimed to study associations of liver conditions and serum total and food-specific IgE concentrations in general adults in a national and population-based setting.
MethodStudy sampleAs described elsewhere,10 the United States National Health and Nutrition Examination Surveys (NHANES) has been a national, population-based, multi-year, cross-sectional study. Information on demographics, lifestyle factors, biomarkers, and health conditions was obtained by household interview using questionnaires. Written informed consent was obtained for all subjects. Liver status tests that were measured included albumin, alanine transaminase (ALT), aspartate transaminase (AST), alkaline phosphatise (ALP), total bilirubin, gamma glutamyl transpeptidase (GGT). Eligible sample for liver status tests measurement was those aged 12 and above. The analyses were performed with a Beckman Synchron LX20.11 In the 2005–2006 study cohort, serum IgE concentrations as study outcomes were measured using a radioimmunoassay procedure. Serum peanut, egg, and milk IgE antibodies were measured in people aged one and above while serum shrimp antibody was measured in those aged six and above. More details can be found via: http://www.cdc.gov/nchs/data/nhanes/nhanes_05_06/al_ige_d_met_specific_ige_total_ige.pdf. In the current analysis, only adults aged 20 and above were included for statistical analysis as the focus was to examine whether the relationship of liver function and food sensitisation could persist in adulthood.
Exposure and outcome thresholdsNormal and abnormal ranges for liver (dys)function (binary outcome) according to commonly used standards were established.12 Accordingly, they are 3.7–4.7g/dL for albumin, 11–47U/L for male and 7–30U/L for female for ALT, 13–33U/L for AST, 36–133U/L for ALP, 0.2–1.3mg/dL for total bilirubin, and 10–54U/L for male and 8–36U/L for female for GGT. For study outcomes, cutoffs were set at 170kU/L for serum total IgE concentrations to classify “high IgE” and 0.35kU/L for food sensitisation.13,14 Concentrations ≥2kU/L were additionally set to determine probable food allergy.2
Statistical analysisIn the first step, weighted logistic regression model was performed to examine the associations of liver status tests and food sensitisation. In the second step, weighted logistic regression model was again performed to examine the associations of liver status tests and probable food allergy. Meanwhile, covariates including age (continuous), sex, ethnicity, waist circumference (continuous), total serum cholesterol (continuous), family poverty income ratio (binary: 0–4.99 or 5), vitamin D (continuous), ever asthma (binary: yes or no), and total protein were adjusted since they have been recognised as potential risk contributors for food allergy.15,16 Family poverty income ratio represents the ratio of family income to their appropriate poverty threshold. A ratio of 1.00 or greater indicates income above the poverty level (i.e. a ratio of 1.20 indicates that income was 20% more than the appropriate poverty threshold).17 Effects were estimated by using odds ratios (ORs) and 95% confidence intervals (CI), with P<0.05 considered statistically significant. Statistical software STATA version 13.0 (STATA, College Station, TX, USA) was used to perform all the analyses. Since this study is only a secondary data analysis by extracting data from the NHANES website, no further ethics approval is required.
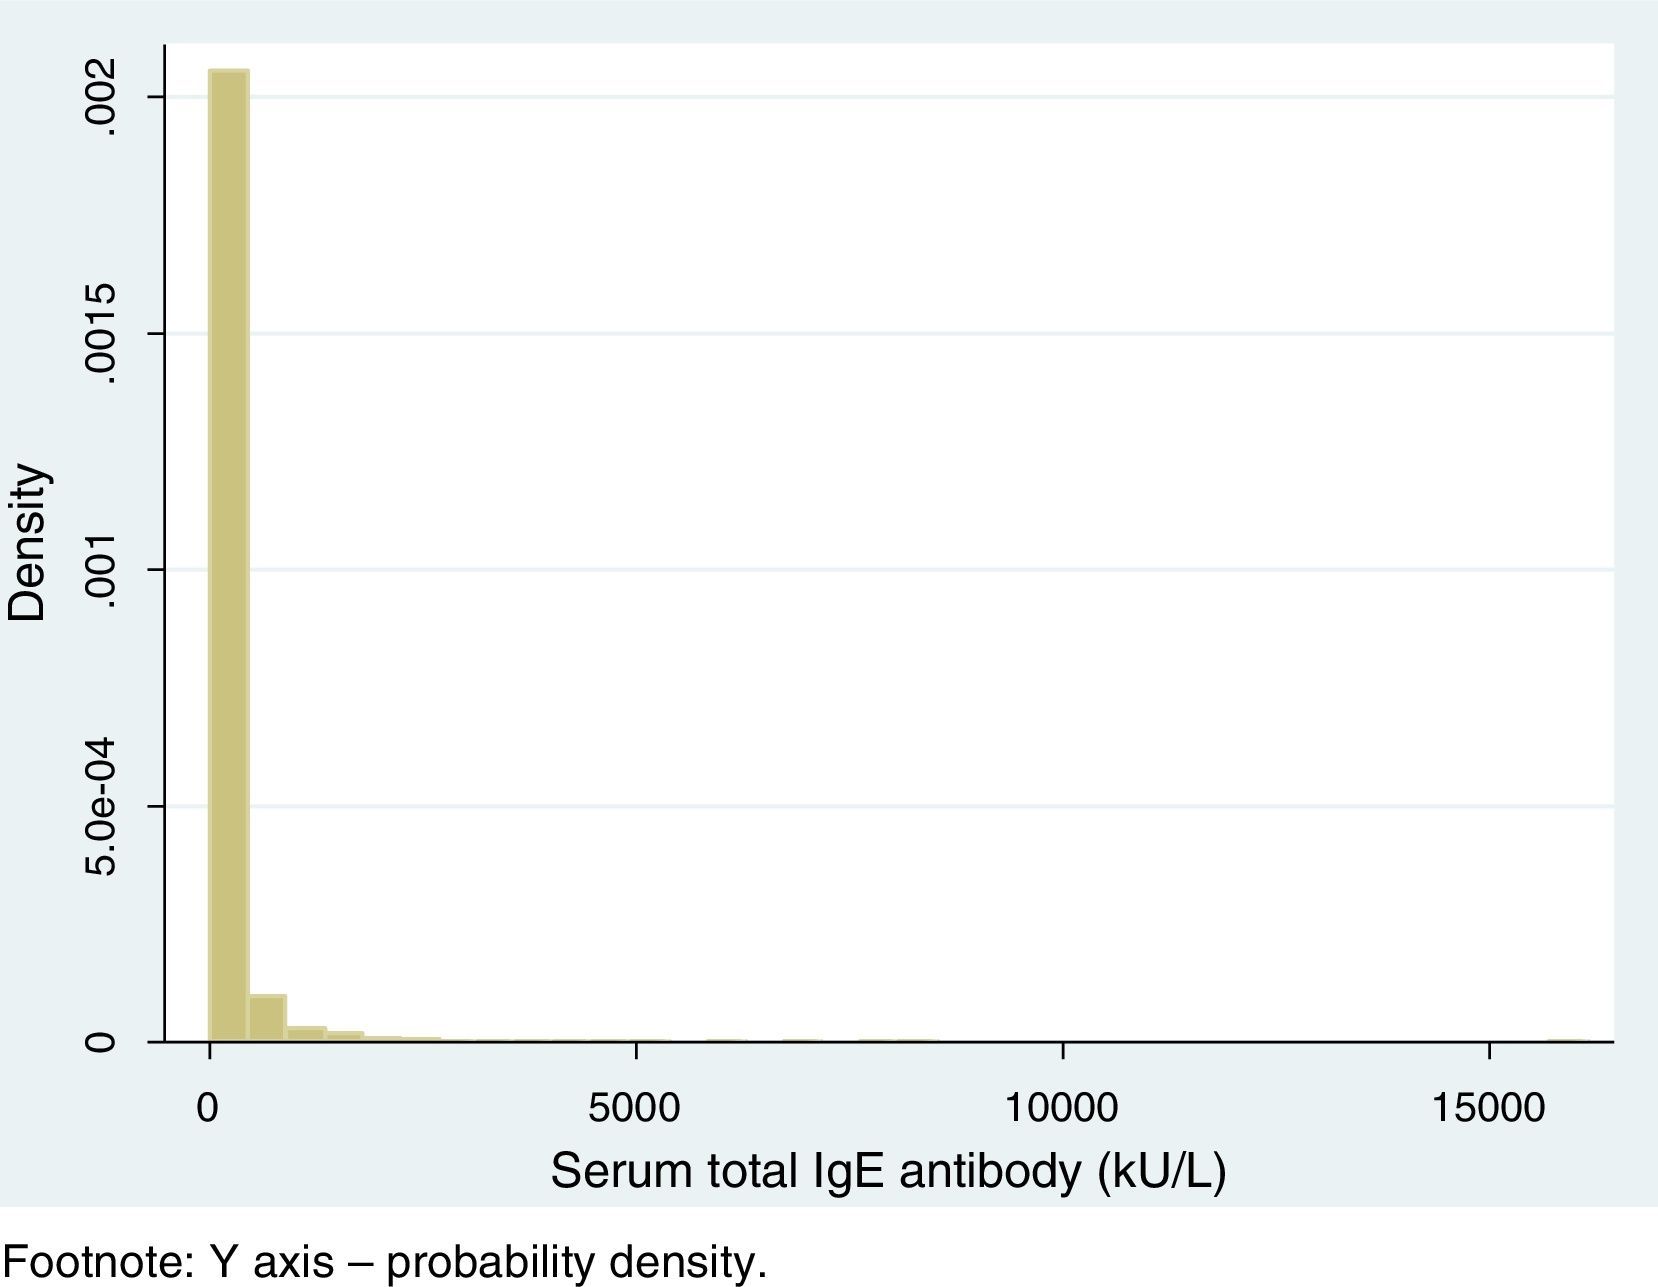
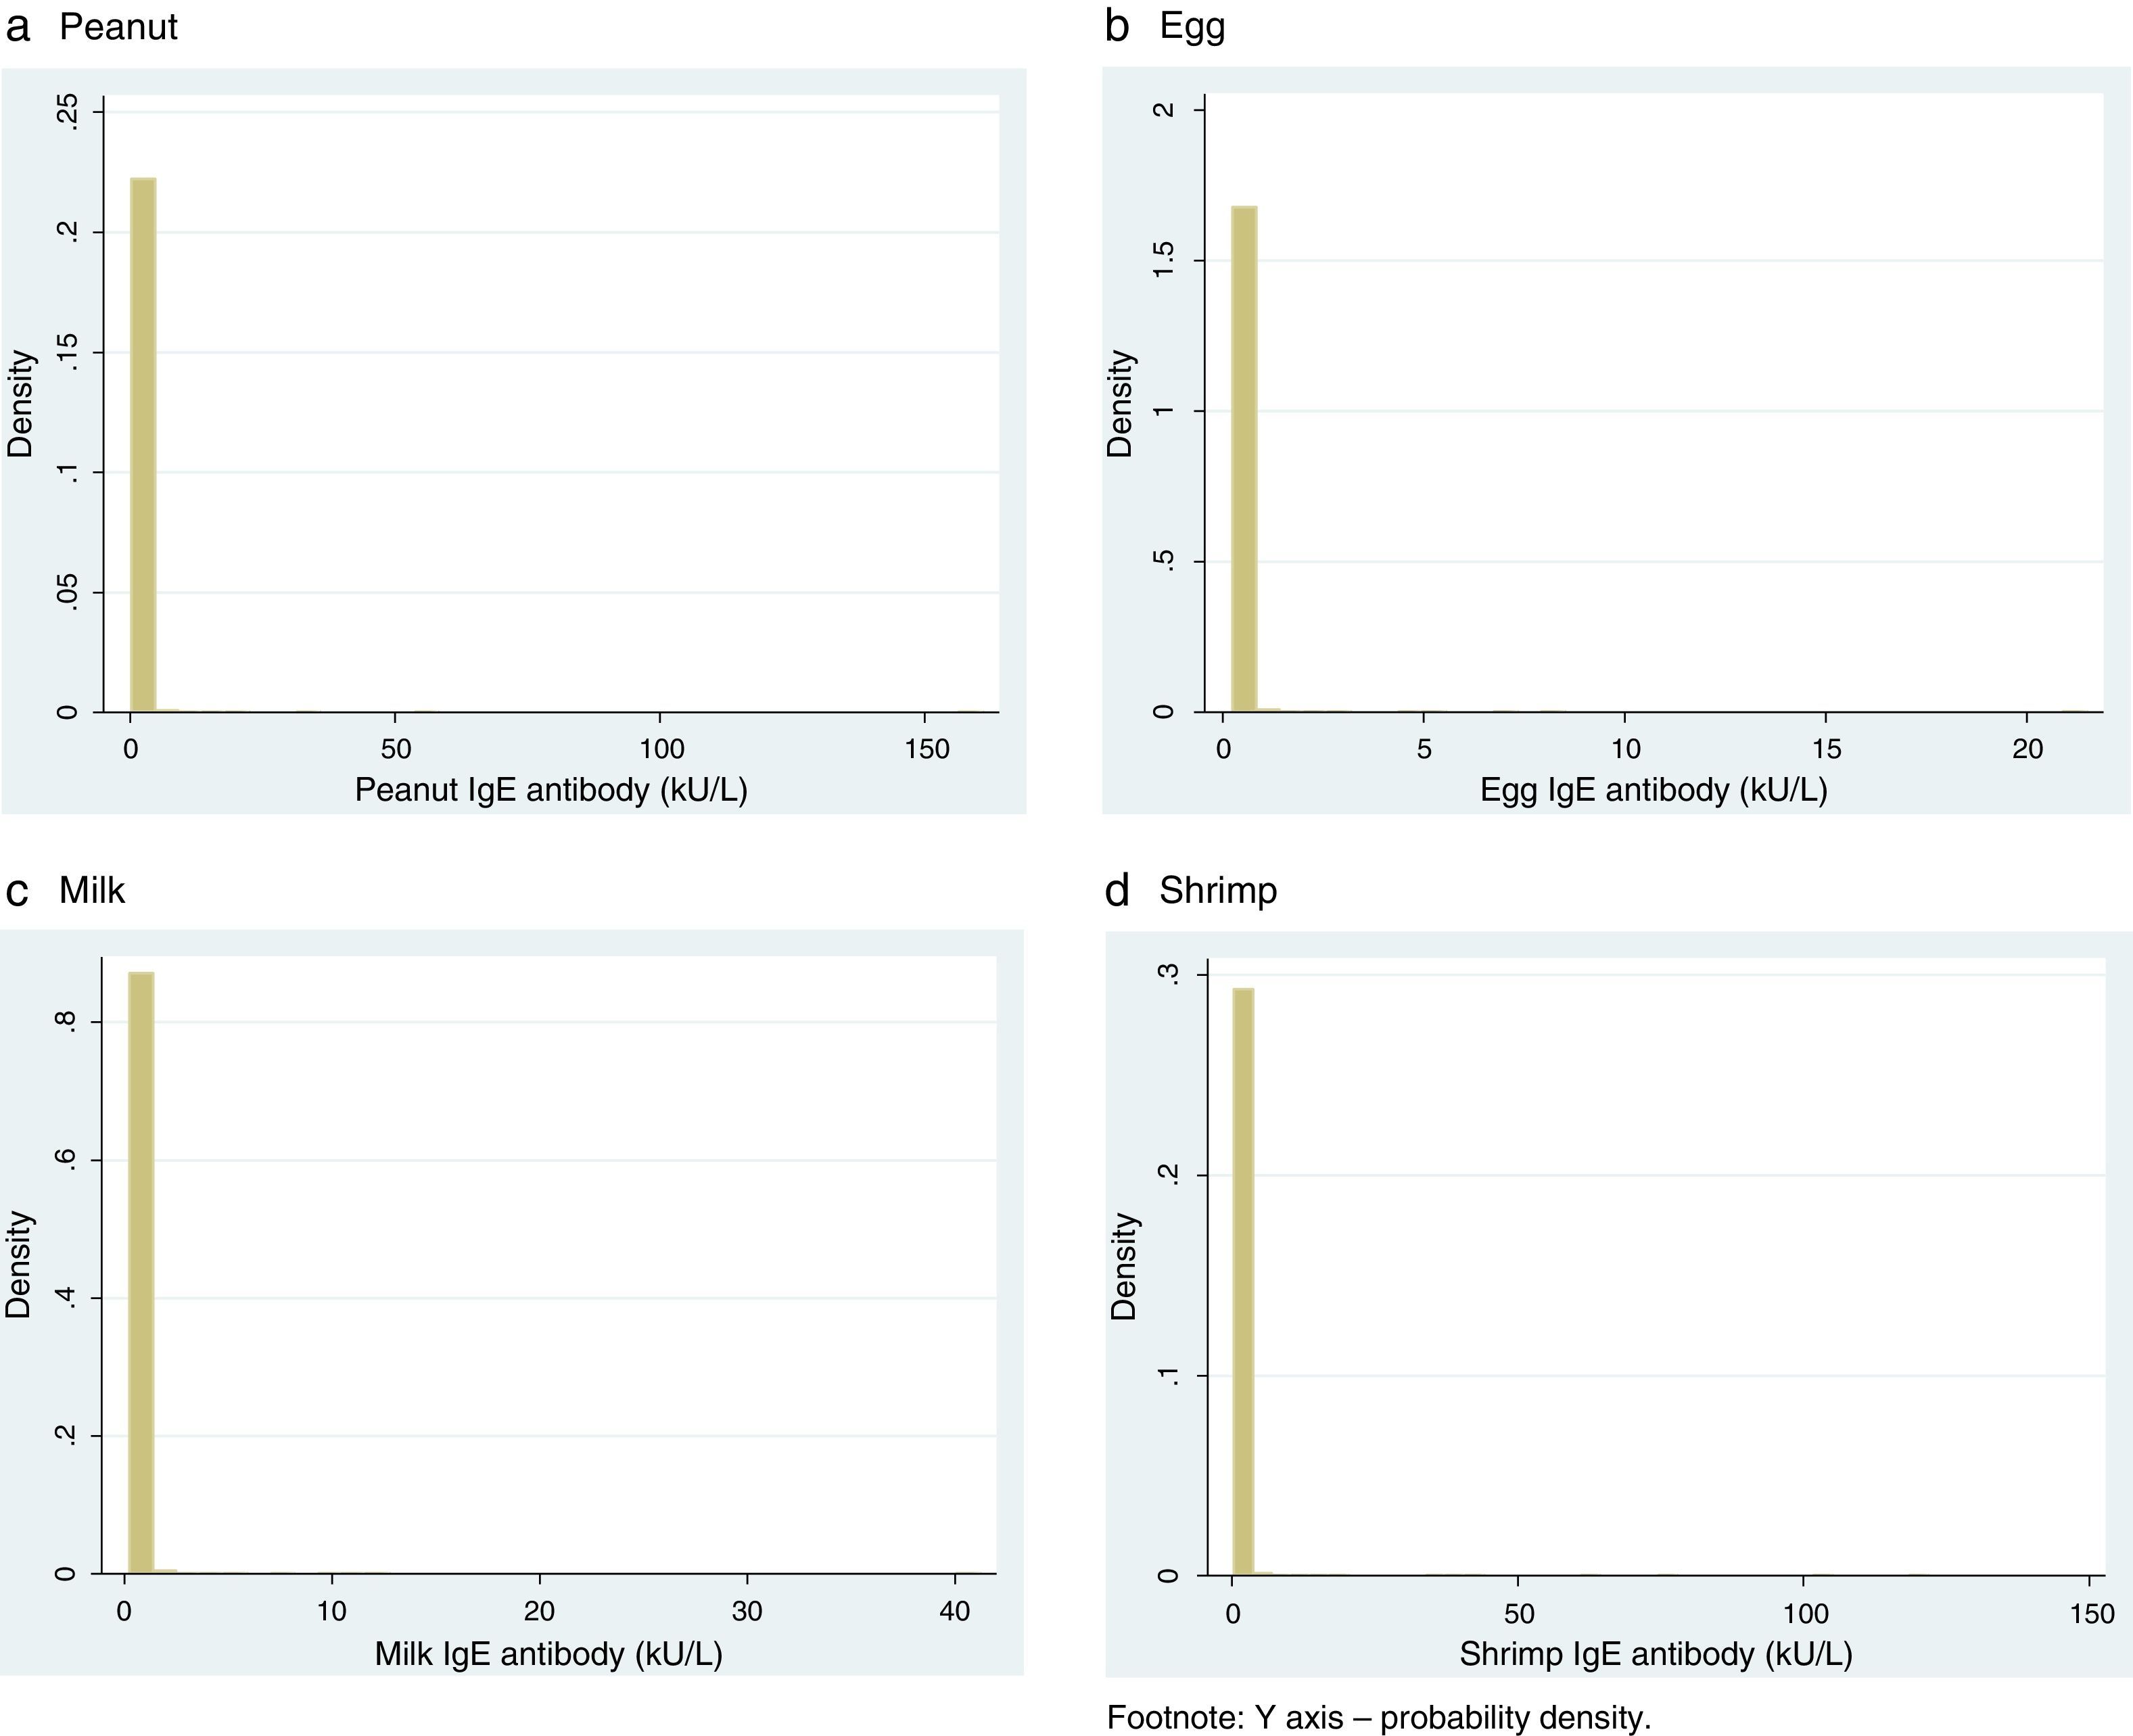
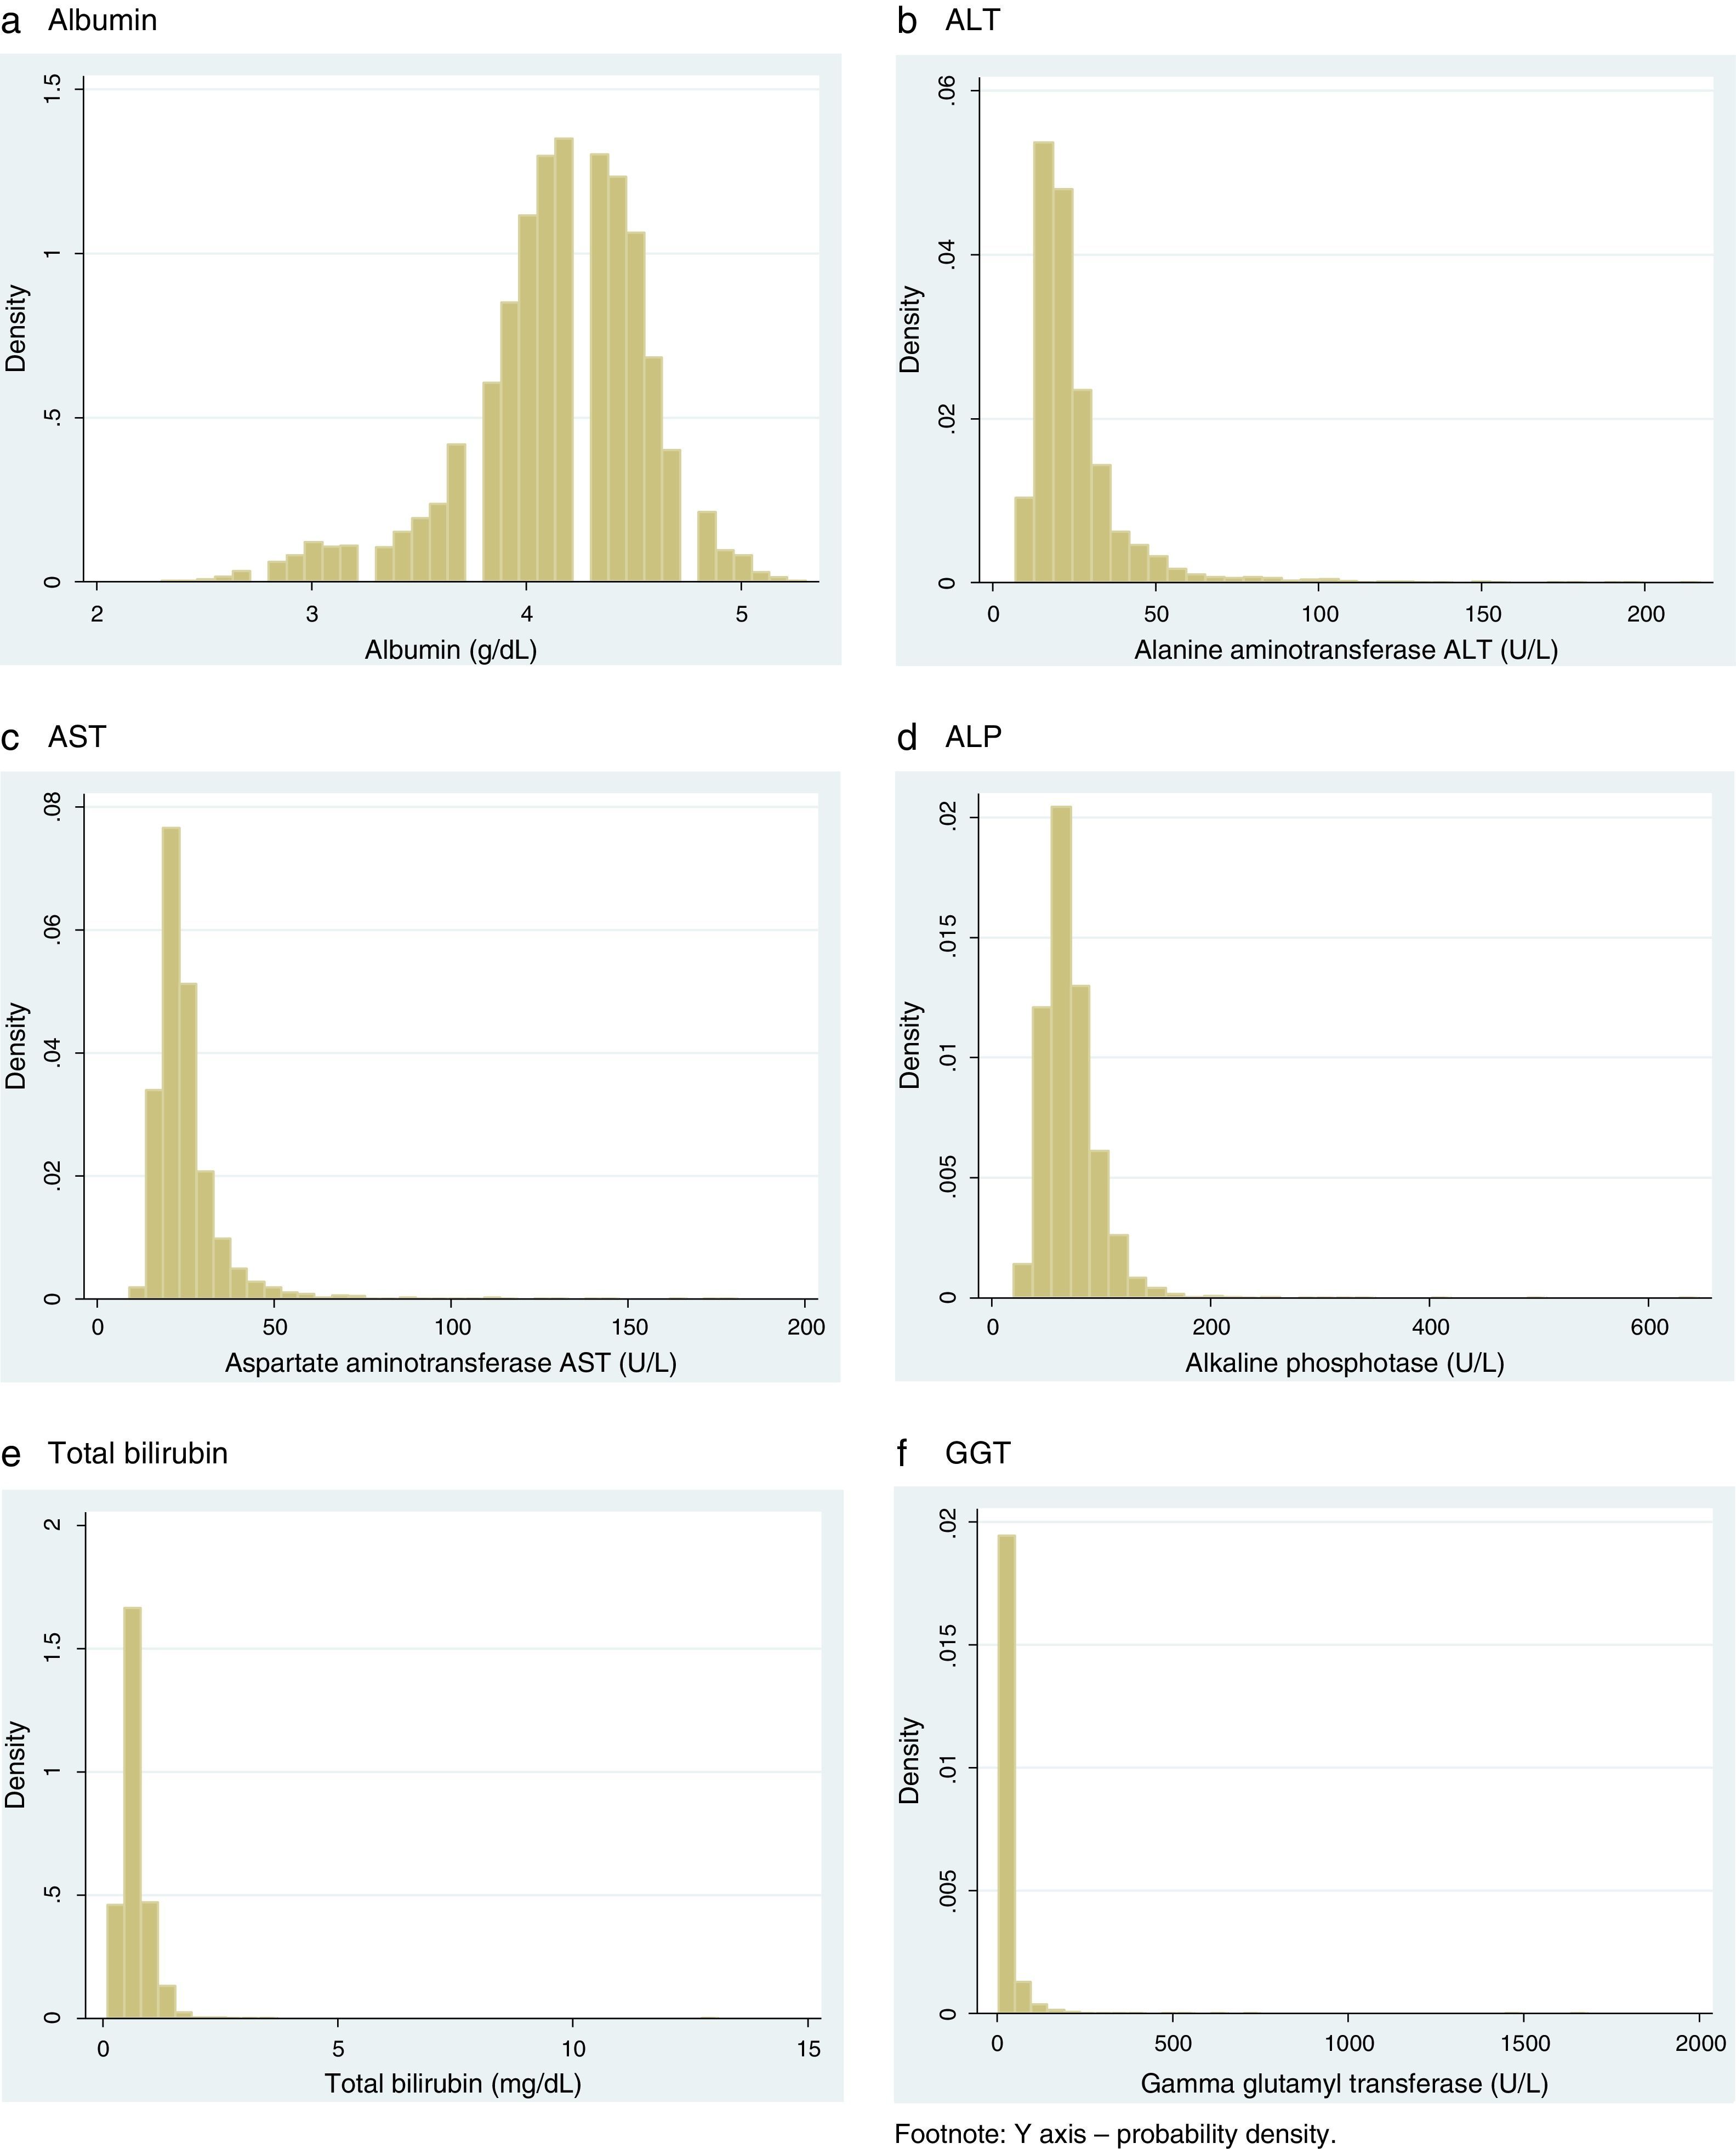
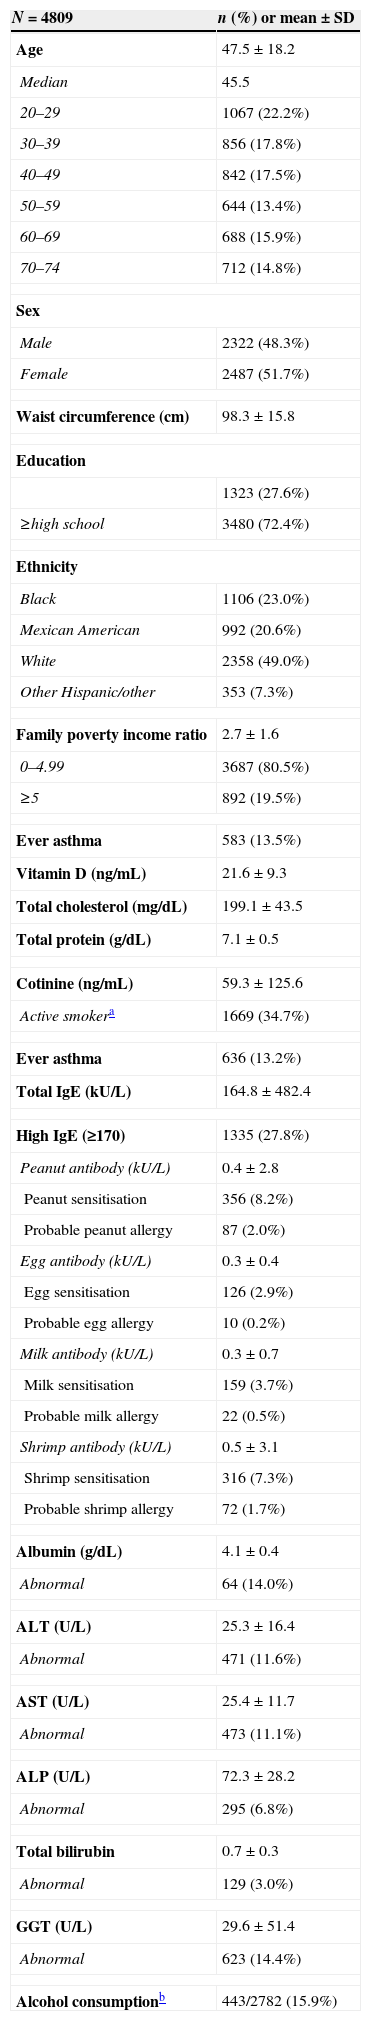
ResultsTable 1 presents the characteristics of included participants. In general, the mean age was 47.5±18.2 while the mean waist circumference was 98.3±15.8cm. 583 (13.5%) had ever asthma since childhood. The mean values of vitamin D, total cholesterol, and total protein were 21.6±9.3ng/mL, 199.1±43.5mg/dL, and 7.1±0.5g/dL, respectively. 1335 (27.8%) had high IgE while the average values were 164.8±482.4kU/L. 356 (8.2%) had peanut sensitisation, 126 (2.9%) had egg sensitisation, 159 (3.7%) had milk sensitisation, and 316 (7.3%) had shrimp sensitisation. Figs. 1 and 2 show the distribution of serum total and food-specific IgE concentrations from the included participants while Fig. 3 indicates the distribution of liver status tests.
Characteristics of included participants (N=4979).
| N=4809 | n (%) or mean±SD |
|---|---|
| Age | 47.5±18.2 |
| Median | 45.5 |
| 20–29 | 1067 (22.2%) |
| 30–39 | 856 (17.8%) |
| 40–49 | 842 (17.5%) |
| 50–59 | 644 (13.4%) |
| 60–69 | 688 (15.9%) |
| 70–74 | 712 (14.8%) |
| Sex | |
| Male | 2322 (48.3%) |
| Female | 2487 (51.7%) |
| Waist circumference (cm) | 98.3±15.8 |
| Education | |
| 1323 (27.6%) | |
| ≥high school | 3480 (72.4%) |
| Ethnicity | |
| Black | 1106 (23.0%) |
| Mexican American | 992 (20.6%) |
| White | 2358 (49.0%) |
| Other Hispanic/other | 353 (7.3%) |
| Family poverty income ratio | 2.7±1.6 |
| 0–4.99 | 3687 (80.5%) |
| ≥5 | 892 (19.5%) |
| Ever asthma | 583 (13.5%) |
| Vitamin D (ng/mL) | 21.6±9.3 |
| Total cholesterol (mg/dL) | 199.1±43.5 |
| Total protein (g/dL) | 7.1±0.5 |
| Cotinine (ng/mL) | 59.3±125.6 |
| Active smokera | 1669 (34.7%) |
| Ever asthma | 636 (13.2%) |
| Total IgE (kU/L) | 164.8±482.4 |
| High IgE (≥170) | 1335 (27.8%) |
| Peanut antibody (kU/L) | 0.4±2.8 |
| Peanut sensitisation | 356 (8.2%) |
| Probable peanut allergy | 87 (2.0%) |
| Egg antibody (kU/L) | 0.3±0.4 |
| Egg sensitisation | 126 (2.9%) |
| Probable egg allergy | 10 (0.2%) |
| Milk antibody (kU/L) | 0.3±0.7 |
| Milk sensitisation | 159 (3.7%) |
| Probable milk allergy | 22 (0.5%) |
| Shrimp antibody (kU/L) | 0.5±3.1 |
| Shrimp sensitisation | 316 (7.3%) |
| Probable shrimp allergy | 72 (1.7%) |
| Albumin (g/dL) | 4.1±0.4 |
| Abnormal | 64 (14.0%) |
| ALT (U/L) | 25.3±16.4 |
| Abnormal | 471 (11.6%) |
| AST (U/L) | 25.4±11.7 |
| Abnormal | 473 (11.1%) |
| ALP (U/L) | 72.3±28.2 |
| Abnormal | 295 (6.8%) |
| Total bilirubin | 0.7±0.3 |
| Abnormal | 129 (3.0%) |
| GGT (U/L) | 29.6±51.4 |
| Abnormal | 623 (14.4%) |
| Alcohol consumptionb | 443/2782 (15.9%) |


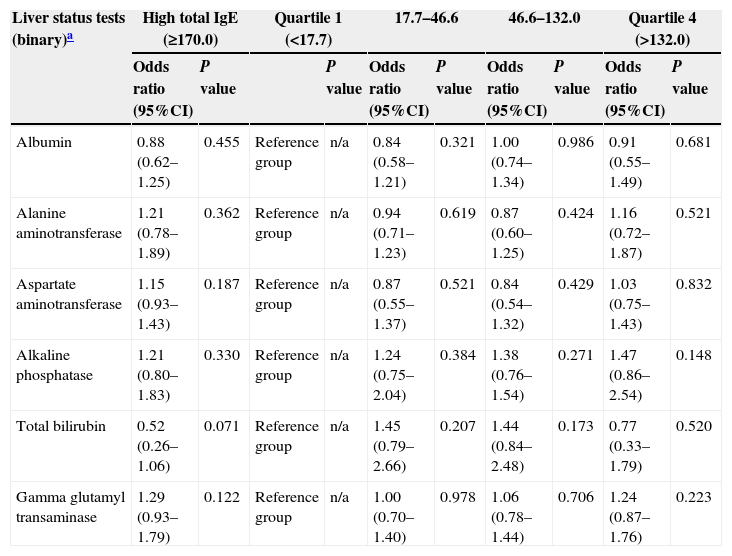
Table 2 shows that no correlation between liver status tests and serum total IgE concentrations was observed while Table 3 displays some associations of liver status tests and food sensitisation. After adjusting for age, sex, ethnicity, vitamin D, waist circumference, family poverty income ratio, total cholesterol, ever asthma, total protein, and survey weighting, abnormal GGT was significantly correlated with food sensitisation (peanut: OR 2.17, 95%CI 1.60–2.94, P<0.001; egg: OR 2.55, 95%CI 1.32–4.90, P=0.008; milk: OR 2.59, 95%CI 1.56–4.31, P=0.001; shrimp: OR 1.81, 95%CI 1.29–2.55, P=0.002). Moreover, both abnormal albumin and ALT were correlated with egg sensitisation (OR 1.96, 95%CI 1.12–3.43, P=0.022 and OR 2.06, 95%CI 1.04–4.09, P=0.040, respectively).
Associations between liver status tests and presence of high IgE.
| Liver status tests (binary)a | High total IgE (≥170.0) | Quartile 1 (<17.7) | 17.7–46.6 | 46.6–132.0 | Quartile 4 (>132.0) | |||||
|---|---|---|---|---|---|---|---|---|---|---|
| Odds ratio (95%CI) | P value | P value | Odds ratio (95%CI) | P value | Odds ratio (95%CI) | P value | Odds ratio (95%CI) | P value | ||
| Albumin | 0.88 (0.62–1.25) | 0.455 | Reference group | n/a | 0.84 (0.58–1.21) | 0.321 | 1.00 (0.74–1.34) | 0.986 | 0.91 (0.55–1.49) | 0.681 |
| Alanine aminotransferase | 1.21 (0.78–1.89) | 0.362 | Reference group | n/a | 0.94 (0.71–1.23) | 0.619 | 0.87 (0.60–1.25) | 0.424 | 1.16 (0.72–1.87) | 0.521 |
| Aspartate aminotransferase | 1.15 (0.93–1.43) | 0.187 | Reference group | n/a | 0.87 (0.55–1.37) | 0.521 | 0.84 (0.54–1.32) | 0.429 | 1.03 (0.75–1.43) | 0.832 |
| Alkaline phosphatase | 1.21 (0.80–1.83) | 0.330 | Reference group | n/a | 1.24 (0.75–2.04) | 0.384 | 1.38 (0.76–1.54) | 0.271 | 1.47 (0.86–2.54) | 0.148 |
| Total bilirubin | 0.52 (0.26–1.06) | 0.071 | Reference group | n/a | 1.45 (0.79–2.66) | 0.207 | 1.44 (0.84–2.48) | 0.173 | 0.77 (0.33–1.79) | 0.520 |
| Gamma glutamyl transaminase | 1.29 (0.93–1.79) | 0.122 | Reference group | n/a | 1.00 (0.70–1.40) | 0.978 | 1.06 (0.78–1.44) | 0.706 | 1.24 (0.87–1.76) | 0.223 |
Note: All adjusting for age, sex, ethnicity, family income poverty ratio, waist circumference, total serum cholesterol, asthma, vitamin D, and total protein.
Associations between liver status tests and presence of food sensitisation (≥0.35kU/L).
| Liver status tests (binary)a | Peanut sensitisation | Egg sensitisation | Milk sensitisation | Shrimp sensitisation | ||||
|---|---|---|---|---|---|---|---|---|
| Odds ratio (95%CI) | P value | Odds ratio (95%CI) | P value | Odds ratio (95%CI) | P value | Odds ratio (95%CI) | P value | |
| Albumin | 0.99 (0.61–1.59) | 0.961 | 1.96 (1.12–3.43) | 0.022 | 1.32 (0.86–2.05) | 0.191 | 1.31 (0.75–2.31) | 0.317 |
| Alanine aminotransferase | 1.35 (0.85–2.14) | 0.182 | 2.06 (1.04–4.09) | 0.040 | 1.60 (0.76–3.35) | 0.197 | 1.73 (0.87–3.47) | 0.112 |
| Aspartate aminotransferase | 1.01 (0.67–1.52) | 0.967 | 1.37 (0.71–2.67) | 0.326 | 1.44 (0.69–2.99) | 0.303 | 1.56 (0.92–2.64) | 0.090 |
| Alkaline phosphatase | 1.65 (0.96–2.84) | 0.068 | 1.40 (0.65–3.00) | 0.366 | 1.81 (0.82–3.99) | 0.132 | 1.43 (0.73–2.79) | 0.276 |
| Total bilirubin | 1.28 (0.59–2.77) | 0.514 | 1.43 (0.46–4.40) | 0.510 | 0.99 (0.33–2.92) | 0.979 | 1.32 (0.62–2.79) | 0.447 |
| Gamma glutamyl transaminase | 2.17 (1.60–2.94) | <0.001 | 2.55 (1.32–4.90) | 0.008 | 2.59 (1.56–4.31) | 0.001 | 1.81 (1.29–2.55) | 0.002 |
Note: All adjusting for age, sex, ethnicity, family income poverty ratio, waist circumference, total serum cholesterol, asthma, vitamin D, and total protein. The bold values are significant associations.
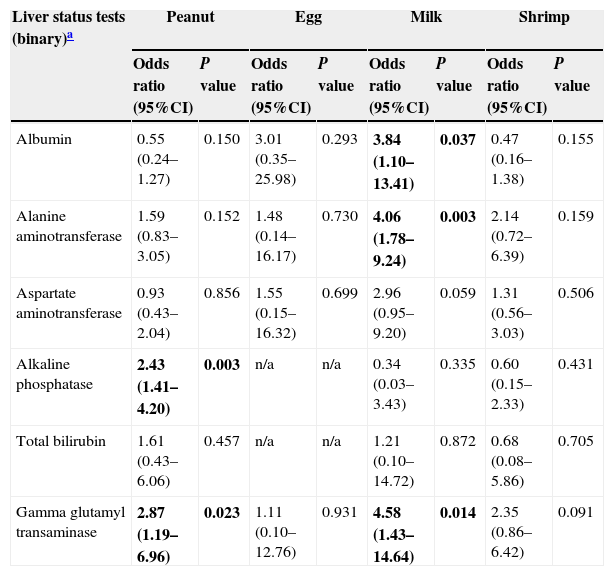
In addition, Table 4 also indicates some associations between liver status tests and probable food allergy. For example, abnormal GGT was significantly correlated with probable peanut allergy (OR 2.87, 95%CI 1.19–6.96, P=0.023) and probable milk allergy (OR 4.58, 95%CI 1.43–14.64, P=0.014). Moreover, abnormal ALP was also correlated with probable peanut allergy (OR 2.43, 95%CI 1.41–4.20, P=0.003) while abnormal albumin and ALT were found to be correlated with probable milk allergy (OR 3.84, 95%CI 1.10–13.41, P=0.034 and OR 4.06, 95%CI 1.78–9.24, P=0.003, respectively).
Associations between liver status tests and presence of probable food allergy (≥2kU/L).
| Liver status tests (binary)a | Peanut | Egg | Milk | Shrimp | ||||
|---|---|---|---|---|---|---|---|---|
| Odds ratio (95%CI) | P value | Odds ratio (95%CI) | P value | Odds ratio (95%CI) | P value | Odds ratio (95%CI) | P value | |
| Albumin | 0.55 (0.24–1.27) | 0.150 | 3.01 (0.35–25.98) | 0.293 | 3.84 (1.10–13.41) | 0.037 | 0.47 (0.16–1.38) | 0.155 |
| Alanine aminotransferase | 1.59 (0.83–3.05) | 0.152 | 1.48 (0.14–16.17) | 0.730 | 4.06 (1.78–9.24) | 0.003 | 2.14 (0.72–6.39) | 0.159 |
| Aspartate aminotransferase | 0.93 (0.43–2.04) | 0.856 | 1.55 (0.15–16.32) | 0.699 | 2.96 (0.95–9.20) | 0.059 | 1.31 (0.56–3.03) | 0.506 |
| Alkaline phosphatase | 2.43 (1.41–4.20) | 0.003 | n/a | n/a | 0.34 (0.03–3.43) | 0.335 | 0.60 (0.15–2.33) | 0.431 |
| Total bilirubin | 1.61 (0.43–6.06) | 0.457 | n/a | n/a | 1.21 (0.10–14.72) | 0.872 | 0.68 (0.08–5.86) | 0.705 |
| Gamma glutamyl transaminase | 2.87 (1.19–6.96) | 0.023 | 1.11 (0.10–12.76) | 0.931 | 4.58 (1.43–14.64) | 0.014 | 2.35 (0.86–6.42) | 0.091 |
Note: All adjusting for age, sex, ethnicity, family income poverty ratio, waist circumference, total serum cholesterol, asthma, vitamin D, and total protein. The bold values are significant associations.
In this present national, population-based, cross-sectional epidemiological study, it was observed that liver enzyme levels were correlated with serum food-specific IgE levels in general adults. To be specific, abnormal GGT was correlated with food sensitisation in peanut, egg, milk, and shrimp and probable peanut and milk allergy. Abnormal albumin and ALT were correlated with egg sensitisation and probable milk allergy.
Serum GGT in relation to food sensitisation and probable allergyGGT is an enzyme that transfers gamma-glutamyl functional groups and can be found in many tissues. It is currently the most sensitive enzymatic indicator of liver disease, with normal values rarely found in the presence of hepatic disease (http://www.cdc.gov/nchs/nhanes/nhanes2005-2006/BIOPRO_D.htm). It is known that if the liver is dysfunctional, the immune system would produce antibodies against the excessive or unknown molecules.18 However, so far, there has not been sound scientific literature to describe the potential relationship of abnormal GGT and presence of food sensitisation or allergy. In the present study, the significant associations of serum GGT and peanut and egg sensitisation and probable milk allergy were consistent with the observations made in a case report in Australia.8
Serum albumin in relation to food sensitisation and probable allergyIt is known that serum albumin is the most abundant blood plasma protein and is produced in the liver. It normally constitutes about 50–60% of human circulating plasma proteins but is not typically stored in the liver.19 Previously, it was observed that serum albumin alone is an uncommon cause of allergic sensitisation in airways, but these allergenic proteins likely play a significant role as cross-reacting allergens in individuals sensitised to several types of animal dander.20 With the ingestion of meats or dairy products, strong IgE activity and other cross-reactivity were also observed in adults.21 Milk sensitisation due to elevated serum albumin was recorded in two case reports from Spain and Italy,22,23 and the authors concluded that observed elevated serum albumin was likely coming from raw and semi-meats. Having cooked meats could prevent from the elevation of serum albumin leading to cross-sensitivity. In the current analysis, abnormal albumin was associated with egg sensitisation and probable milk allergy and these results are in response to the above-mentioned case reports.
Serum ALT in relation to food sensitisation and probable allergyALT is the third liver status test that was observed to be associated with egg sensitisation and probable milk allergy. ALT is a transaminase enzyme and can be found in serum and in various bodily tissues, being most commonly associated with the liver. It is also a common clinical measure for evaluation of hepatocellular injury that can be used to screen liver problems or liver damage. Previous studies have shown that elevated ALT values occurred in children with intolerance to many different types of proteins,24 although they tended to be clinical observations with small sample size. The present study has the similar findings in general adults in a national and population-based setting with larger sample size, but still, the causality can only be established once longitudinal analysis or clinical studies can be conducted to confirm.
Strengths and limitationsThere are a few strengths and limitations worthy of note in this study. First, this is the largest population-based study to date that investigated the relationships between liver conditions and serum total and food-specific IgE concentrations in adults and the results can be representative of the US population due to its national survey design. Second, exposure and outcome measures were objectively and clinically determined which could provide a reliable interpretation for human health. There are two limitations in the current study. There are hundreds of foods that could induce allergy, but they were not available in this dataset. However, the included foods in this study have been known to be responsible for about 80–90% of allergic reactions and mostly observed in care reports. In addition, there was no access to data with regard to clinical histories consistent with true food allergy as opposed to just positive blood tests. In the present study, probable food allergy as the study outcome was modelled. However, with the apparent small number of events, the results were not perfectly convincing. Therefore, it is not possible to use true food allergy criteria, such as being suggested by Liu et al,2 as the clinical end point. Future epidemiological and/or clinical research overcoming these limitations is suggested.
ConclusionAbnormal liver conditions were found to be correlated with presence of food sensitisation and probable food allergy in the NHANES. However, due to the study design in nature, it is not possible to establish the causal relationship. By conducting this epidemiological study, it is hoped to raise attention and discussion into the relationship of liver conditions and allergic reactions both in adults and children. Future research with longitudinal design or in clinical settings is therefore warranted before drawing a firm conclusion and illustrating the real biological mechanisms.
Ethical disclosuresConfidentiality of dataThe authors declare that they have followed the protocols of their work centre on the publication of patient data and that all the patients included in the study have received sufficient information and have given their informed consent in writing to participate in that study.
Right to privacy and informed consentThe authors have obtained the informed consent of the patients and/or subjects mentioned in the article. The author for correspondence is in possession of this document.
Protection of human and animal subjectsThe authors declare that the procedures followed were in accordance with the regulations of the responsible Clinical Research Ethics Committee and in accordance with those of the World Medical Association and the Helsinki Declaration.
Conflict of interestThe author declares she has no conflict of interest.
IS is supported by the Global Platform for Research Leaders scheme.
