


Fusarium Head Blight is an important wheat disease in the Argentine Pampas region, being Fusarium graminearum the predominant pathogen. DNA polymorphism of the isolates was analyzed by IGS-RFLP and ISSR. IGS-RFLP and ISSR profiling were carried out using six endonucleases and eight primers, respectively. IGS-RFLP yielded 41 bands, 30 of which were polymorphic while ISSR produced 87 bands with 47 polymorphic bands. Both markers showed genetic variability among the analyzed isolates; however, IGS-RFLP was more efficient than ISSR, showing a higher polymorphic average (59.91%) than the latter (44.11%). The averages of polymorphic information content (PIC) were 0.211 and 0.129, respectively. Twenty haplotypes were identified by IGS-RFLP and 15 haplotypes by ISSR. Genotype clustering within dendrograms was different for both types of markers. The genetic groups obtained by IGS-RFLP showed a partial association to geographic origin. This is the first report on genetic variability of F. graminearum isolates from wheat in Argentina using IGS-RFLP and ISSR markers.
La fusariosis de la espiga de trigo es una importante enfermedad para la región pampeana Argentina; Fusarium graminearum es el principal patógeno asociado. Se estudió el polimorfismo del ADN de un conjunto de aislamientos utilizando las técnicas de IGS-RFLP e ISSR. La técnica de IGS-RFLP produjo 41 bandas, 30 de ellas fueron polimórficas. El análisis de los ISSR mostró 87 bandas con 47 bandas polimórficas. La primera de estas metodologías fue más eficiente, ya que detectó mayor promedio polimórfico (59,91%) que la segunda (44,11%). Los valores promedio del contenido de información polimórfica (PIC) fueron 0,211 y 0,129, respectivamente. Se identificaron 20 haplotipos por IGS-RFLP, mientras que el análisis de los ISSR reveló 15 haplotipos. La agrupación de genotipos obtenida en ambos dendrogramas fue diferente. Los grupos genéticos obtenidos por la técnica de IGS-RFLP mostraron una asociación parcial con el origen geográfico. Este es el primer reporte que analiza la variabilidad genética en poblaciones de F. graminearum de trigo empleando marcadores IGS-RFLP e ISSR en Argentina.
The Fusarium graminearum species complex (FGSC) is a group of mycotoxigenic fungi that are the primary cause of Fusarium Head Blight (FHB) of wheat worldwide, resulting in severe yield losses and overall reduction in seed quality due to contamination of grains with mycotoxins1. Within this complex, F. graminearum is the most dominant, widespread and destructive pathogen of wheat-growing areas that have humid to semi-humid climate11 FHB is an important wheat disease in the Pampas region of Argentina, being F. graminearum the predominant associated pathogen5. The Argentinian wheat cropping area is very extensive, distributed in five provinces having different ecological conditions (Pampas region: Buenos Aires, Córdoba, Santa Fe, Entre Ríos and La Pampa)1.
Several molecular techniques have been used to analyze F. graminearum isolates and to provide information about the population structure worldwide, such as amplified fragment length polymorphisms (AFLP), restriction fragment length polymorphisms (RFLP), random amplified polymorphic DNA analysis (RAPD) and inter-simple sequence repeats (ISSR). These techniques have revealed different levels of genetic variability among isolates of worldwide locations15. The studies recorded in Argentina regarding genetic variability among F. graminearum isolates have been based on AFLP molecular markers1,12. Due to the variability in the intergenic region (IGS) of nuclear ribosomal DNA among genetically related groups, the IGS-RFLP marker analysis of this region has proven to be a useful method in studies of genetic diversity of Fusarium spp6. The analysis based on ISSR-PCR molecular markers is considered a reliable method in population genetic studies of fungi, in which the selection of ISSR primers does not require previous knowledge of the sequence and generates specific and reproducible patterns due to the highly stringent conditions of the reaction7. The aim of this study was to examine the intraspecific genetic variability of a collection of F. graminearum sensu lato isolates obtained from infected wheat grains of different locations in the Argentine Pampas region, using two molecular techniques of different discriminatory power, such as restriction analysis of the nuclear ribosomal DNA intergenic spacer region (IGS-RFLP) and inter-simple sequence repeat (ISSR) molecular markers.
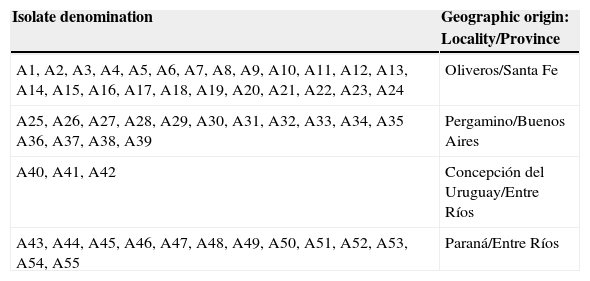
F. graminearum isolates were obtained from grain wheat samples from diverse geographic locations with different probability of infection in accordance with the climate models of disease incidence. The wheat samples (consisting of three replicates, mechanically harvested) belonged to 26 commercial cultivars used for standard production practices during the 2007 wheat growing season. Cultivar samples obtained from nurseries at Instituto Nacional de Tecnología Agropecuaria (INTA), Experimental Stations of Marcos Juárez, Pergamino, Oliveros, Paraná, Concepción del Uruguay, Balcarce and Barrow (integrated farm), and silos of Servicio Nacional de Sanidad y Calidad Agropecuaria (SENASA). Sixty nine samples from 26 wheat cultivars in 15 locations were analyzed and a total of 55 F. graminearum isolates were identified as previously reported, and then the respective monoconidial cultures were carried out5 (Table 1). For molecular identification Fg16N F/R clade specific (F. graminearum sensu lato) primers were used10.
Fusarium graminearum isolates used in this study
| Isolate denomination | Geographic origin: Locality/Province |
|---|---|
| A1, A2, A3, A4, A5, A6, A7, A8, A9, A10, A11, A12, A13, A14, A15, A16, A17, A18, A19, A20, A21, A22, A23, A24 | Oliveros/Santa Fe |
| A25, A26, A27, A28, A29, A30, A31, A32, A33, A34, A35 A36, A37, A38, A39 | Pergamino/Buenos Aires |
| A40, A41, A42 | Concepción del Uruguay/Entre Ríos |
| A43, A44, A45, A46, A47, A48, A49, A50, A51, A52, A53, A54, A55 | Paraná/Entre Ríos |
For DNA extraction, the monoconidial F. graminearum isolates were grown on Petri dishes (2% potato-agar) at 26°C during 5 days. Ten millimeter plugs were cut out from the outer edge of each fungal colony and cultured on flasks containing Potato dextrose broth medium (Oxoid) at 26°C in darkness for 4 days on an orbital shaker at 100rpm. Mycelium was harvested by filtration onto filter paper (Whatman N°1). Then, it was rinsed with sterile water, stored at −20°C and lyophilized. About 100mg of powered mycelia were used for DNA isolation following a modified version of the cetyltrimethylammonium bromide (CTAB) method9.
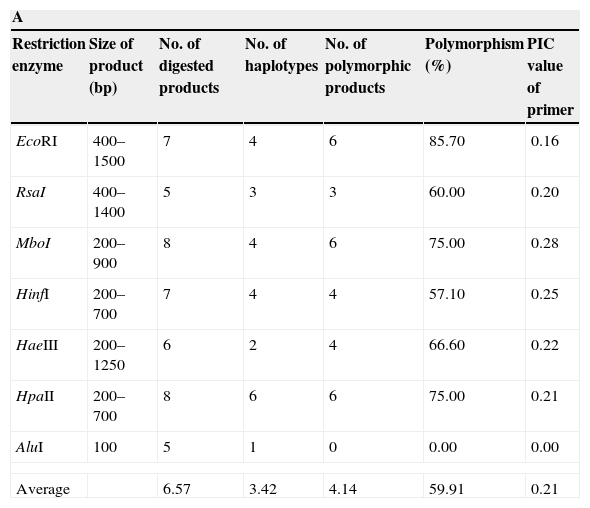
The IGS region of the rDNA was amplified using primers CNL12 (5′-CTGAACGCCTCTAAGTCAG-3′) and CNS1 (5′-GAGACAAGCATATGACTACTG-3′).2 Each amplification reaction included 20ng of template DNA and the following concentrations of other constituents: 0.2M of each of the four dNTPs, 1.5mM of MgCl2, 0.5mM of each of the primers, 1U Taq polymerase and the appropriate buffer (Invitrogen, Carlsbad, USA) up to a total volume of 50μl. Amplification was performed in a thermocycler (Eppendorf AG, Hamburg Germany) as follows: 1 cycle of 2.5min at 94°C, 30 cycles of 1min at 95°C, 1min at 62°C, 2min at 72°C and, finally 1 cycle of 10min at 72°C. PCR products for each F. graminearum isolate were digested individually with seven different restriction enzymes EcoRI, RsaI, MboI, HpaII, HaeIII, AluI and HinfI (Fermentas, Vilnius, Lithuania) (Table 2A). Separately, aliquots (10μl) of the amplification products were digested in buffer with 5 units of each enzyme at 37°C for 2h.
List of endonucleases and characteristics of the digested PCR products obtained in F. graminearum isolates (A) List of primers, their sequences and characteristics of the amplification products obtained by eight selected ISSR primer combinations in F. graminearum isolates (B)
| A | ||||||
|---|---|---|---|---|---|---|
| Restriction enzyme | Size of product (bp) | No. of digested products | No. of haplotypes | No. of polymorphic products | Polymorphism (%) | PIC value of primer |
| EcoRI | 400–1500 | 7 | 4 | 6 | 85.70 | 0.16 |
| RsaI | 400–1400 | 5 | 3 | 3 | 60.00 | 0.20 |
| MboI | 200–900 | 8 | 4 | 6 | 75.00 | 0.28 |
| HinfI | 200–700 | 7 | 4 | 4 | 57.10 | 0.25 |
| HaeIII | 200–1250 | 6 | 2 | 4 | 66.60 | 0.22 |
| HpaII | 200–700 | 8 | 6 | 6 | 75.00 | 0.21 |
| AluI | 100 | 5 | 1 | 0 | 0.00 | 0.00 |
| Average | 6.57 | 3.42 | 4.14 | 59.91 | 0.21 | |
| B | |||||||
|---|---|---|---|---|---|---|---|
| ISSR Marker | Primer sequence 5′-3′ | Size of product (bp) | No. of amplification bands | No. of haplotypes | No. of polymorphic product | Polymorphism (%) | PIC value of primer |
| 828 | TGTGTGTGTGTGTGTGA | 290–1900 | 15 | 2 | 10 | 66.60 | 0.15 |
| 835 | AGAGAGAGAGAGAGAGYC | 230–1300 | 15 | 2 | 3 | 20.00 | 0.26 |
| 846 | CACACACACACACACART | 320–1200 | 15 | 8 | 12 | 80.00 | 0.16 |
| 826 | ACACACACACACACACC | 300–1210 | 12 | 7 | 3 | 25.00 | 0.16 |
| 850 | GTGTGTGTGTGTGTGTYC | 250–1280 | 11 | 5 | 7 | 63.63 | 0.07 |
| 854 | TCTCTCTCTCTCTCTCRG | 490–1710 | 9 | 2 | 7 | 77.70 | 0.09 |
| 845 | CTCTCTCTCTCTCTCTRG | 230–590 | 5 | 2 | 1 | 20.00 | 0.02 |
| 840 | GAGAGAGAGAGAGAGAYT | 180–1200 | 5 | 1 | 0 | 0.00 | 0.00 |
| Average | 10.87 | 3.62 | 5.37 | 44.11 | 0.13 | ||
PCR amplification of ISSR loci was carried out in a 20μl reaction volume containing PCR buffer, 1U Taq polymerase (Invitrogen), 0.2mM each dNTP, 1.5mM MgCl2, 0.35mM of ISSR primer and 10ng of genomic DNA. PCR was performed in a thermocycler (Eppendorf AG, Hamburg Germany). PCR amplification conditions were: initial denaturation of 94°C for 1min followed by 35 cycles of 94°C for 1min, 55°C for 30s, 72°C for 1min and with a final extension of 7min at 72°C. ISSR-PCR was performed using eight ISSR primers: 826 (5′-ACACACACACACACACC-3′), 828 (5′-TGTGTGTGTGTGTGTGA-3′), 835 (5′-AGAGAGAGAGAGAGAGYC-3′), 840 (5′-GAGAGAGAGAGAGAGAYT-3′), 845 (5′-CTCTCTCTCTCTCTCTRG-3′), 846 (5′-CACACACACACACACART-3′), 850 (5′-GTGTGTGTGTGTGTGTYC-3′) and 854 (5′-TCTCTCTCTCTCTCTCRG-3′) (Table 2B). These primers were selected based on the results of initial screening of 50 ISSR primers against a set of representative F. graminearum isolates7.
Restriction fragments and ISSR-PCR products were subjected to electrophoresis on 2% agarose gels. Sizes of fragments were determined by comparison to a standard DNA molecular weight marker, 100-bp DNA ladder (Invitrogen, Carlsbad, USA). Gels were stained with ethidium bromide and photographed using a Fotodyne system (Hartland, WI). IGS-RFLP and ISSR fingerprints were analyzed with the Gel Compare program using a robust hyperbole to estimate the size of each fragment.
For data analysis, each clear band generated by IGS-RFLP and ISSR with a different electrophoretic mobilities was scored as “1” or “0” based on their presence or absence, respectively. Only reproducible bands were considered for analysis and fragments of the same size were considered homologous. The reproducibility of IGS-RFLP and ISSR fingerprints was examined by repeating the PCR amplifications or restriction digestion twice and consistently observed the same fragment(s) from a given isolate with each primer or enzyme used.
A genetic distance matrix was calculated using the Dice coefficient. Based on this coefficient, a dendrogram was constructed by the unweighted pair group method with arithmetic average (UPGMA). The reliability of the dendrogram was established by the cophenetic correlation coefficient (CCC) using the nonparametric Mantel test computing 1000 random permutations. All these analyses were performed using Statistical Software NTsys 2.1 program13 and bootstrap values were calculated for 1000 replicates. Correlation of matrices generated for IGS-RFLP and ISSR were calculated using the Antel test.
Molecular profile characteristics, such as total number of bands, total number of haplotypes, number of polymorphic products and polymorphism information content (PIC) values were tabulated separately for IGS-RFLP and ISSR analysis. The genotypic diversity (G) of the population was estimated according to Stoddart and Taylor and expressed as percentage14.
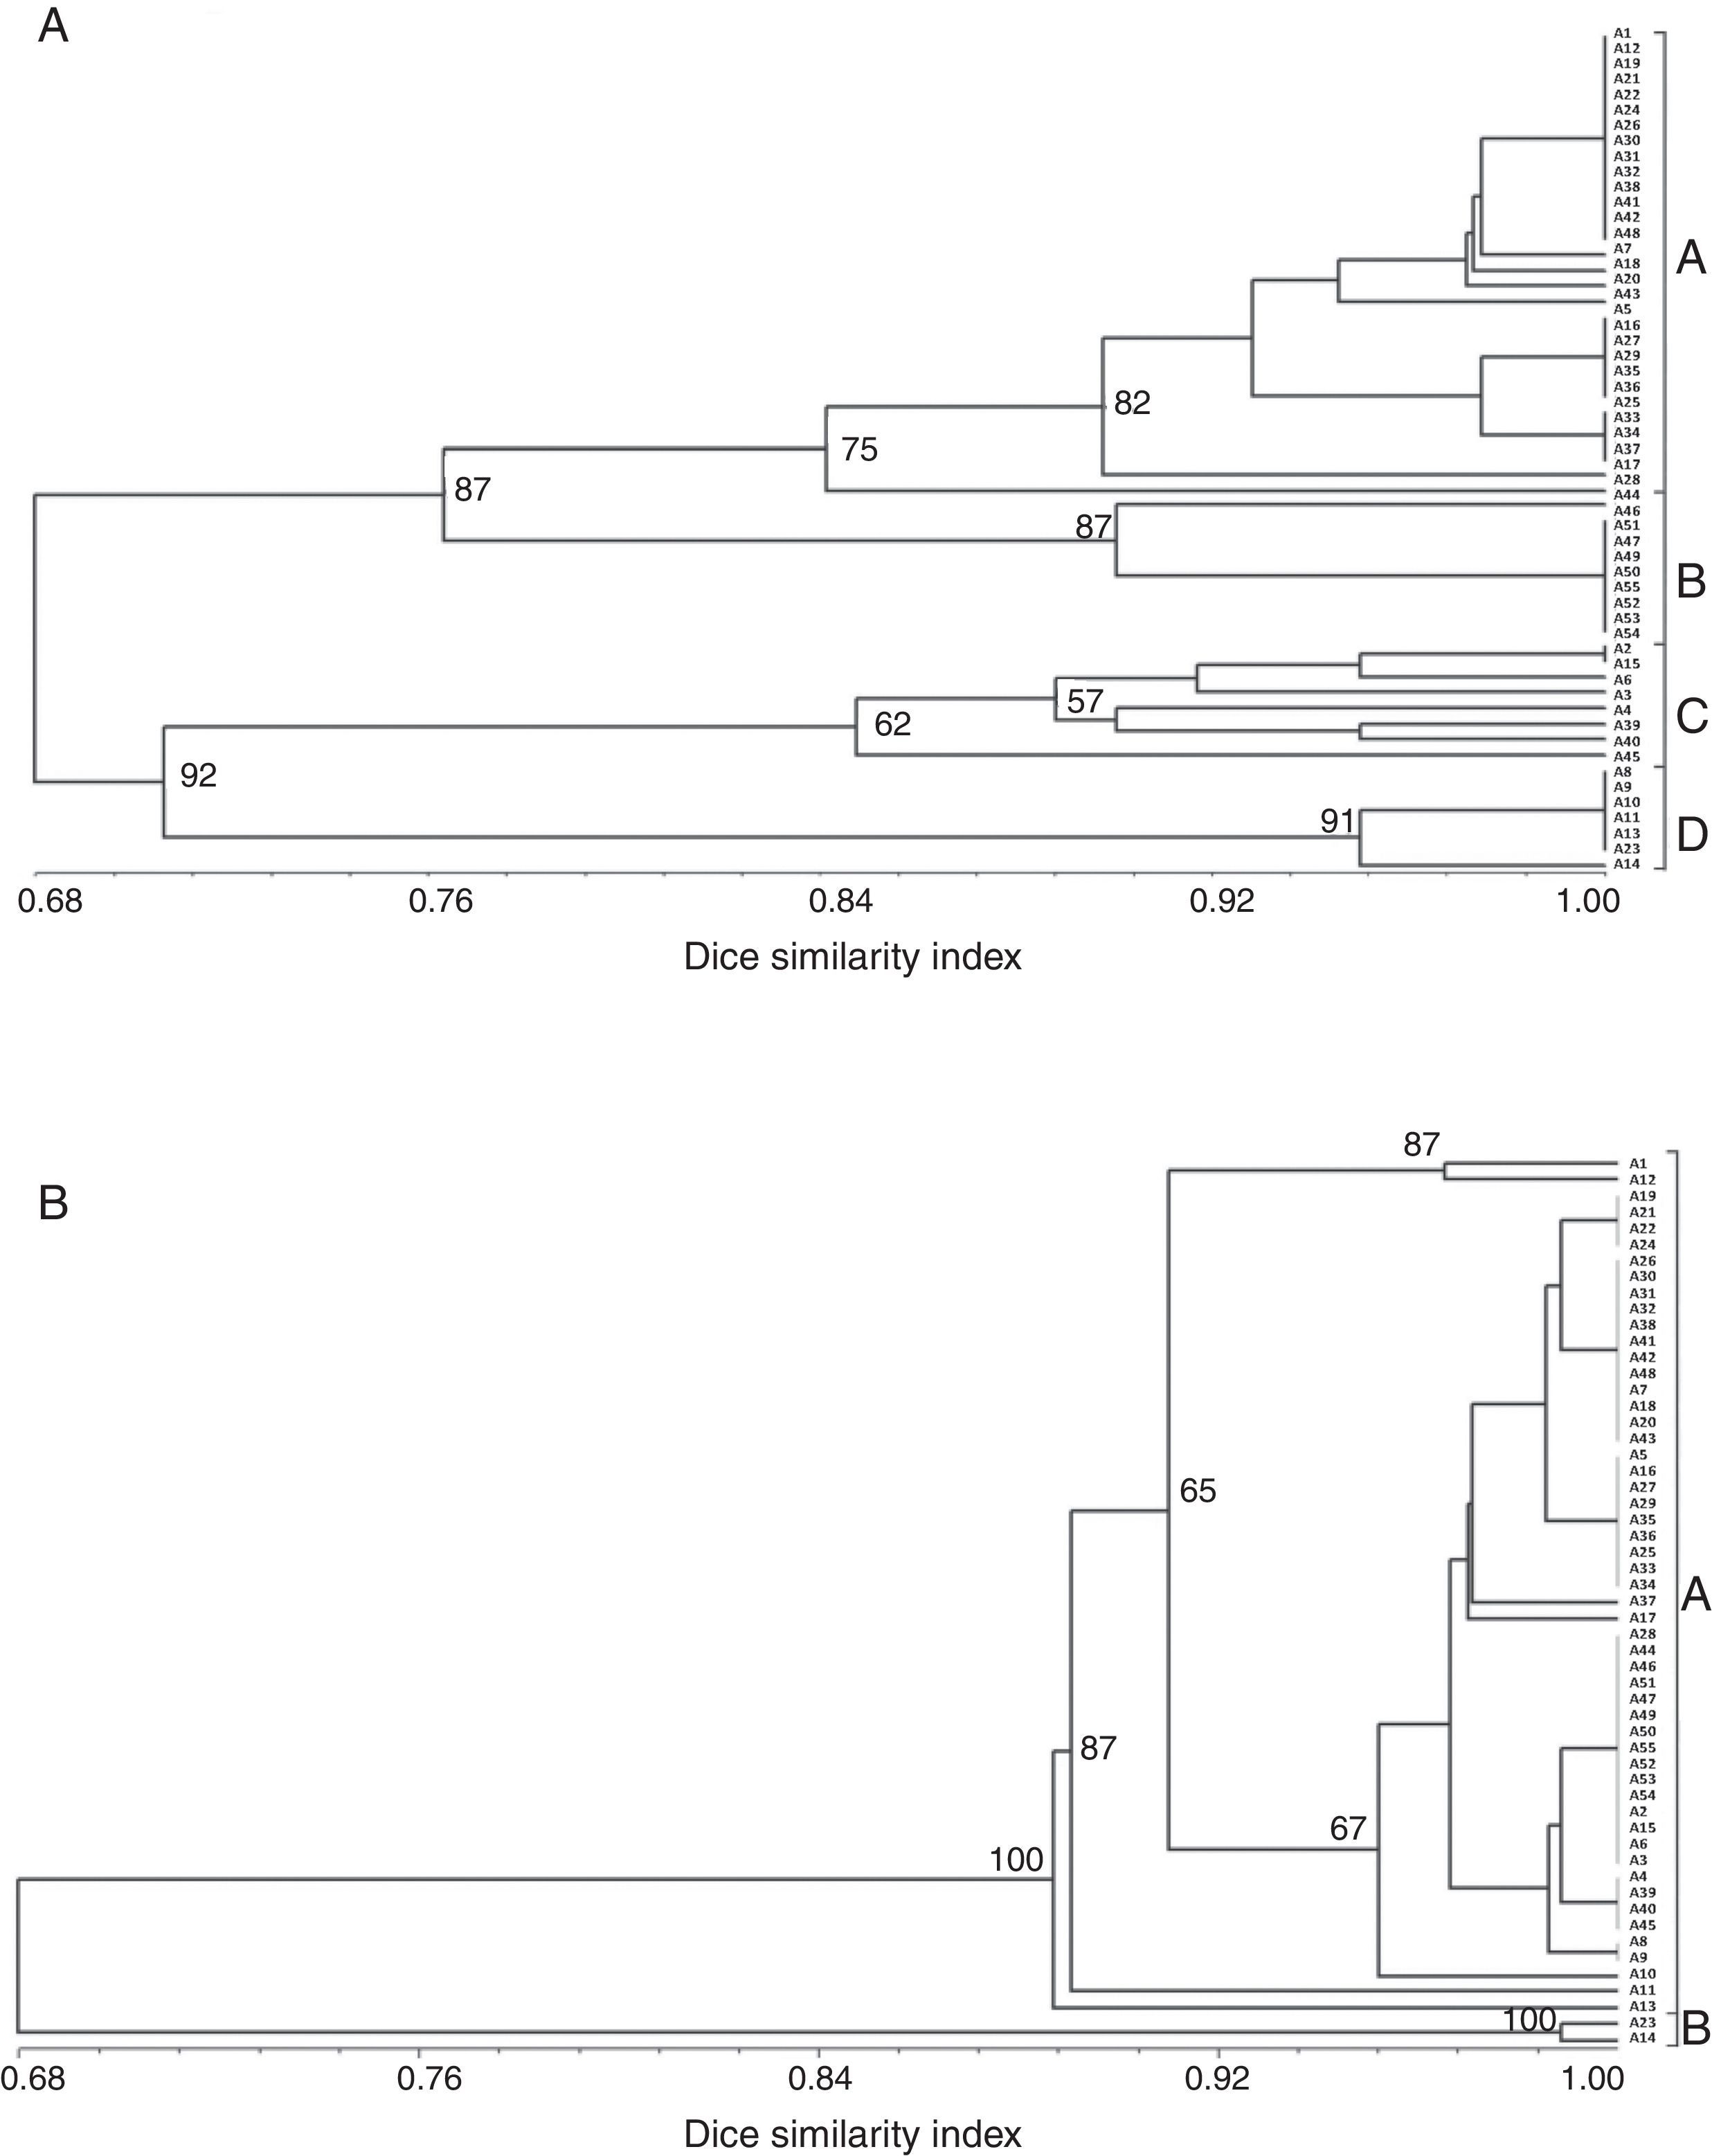
The amplification of a single DNA fragment of about 2.4kb for each one of the 55 isolates was obtained using oligonucleotide primers CNL12 and CNS1 the cophenetic correlation coefficient (CCC) using the nonparametric Mantel test computing. Six restriction enzymes (EcoRI, RsaI, MboI, HpaII, HaeIII, HinfI) digested the PCR products into 24 patterns and 41 bands, thirty of which (73%) were polymorphic and ranged from 200 to 1500pb, except AluI, which generated fragments shorter than 100pb, thus, it was discarded in this analysis because they were not clearly resolved by electrophoresis in agarose gels (Table 2A). The six enzymes used showed different polymorphism that ranged between 57.1 and 85.7%. The highest rate of IGS-RFLP detection (85.7%) was observed with DNA digested with EcoRI. HpaII enzyme generated 8 restriction fragments and 6 haplotypes. Moreover, only 2 and 3 haplotypes were observed with HaeIII and RsaI, respectively. The remaining enzymes: HinfI, EcoRI and MboI showed 4 haplotypes each. The cluster analysis was performed using data from the six restriction enzymes and the dendrogram is shown in Fig. 1A. The calculated value of CCC (r=0.928) indicates that the dendrogram is a good representation of the genetic relationship of the isolates. The F. graminearum isolates were clustered in four groups considering a similarity level>0.68; each one was named A to D. Cluster A supported by a bootstrap value of 75%, included 30 isolates from all localities sampled, cluster B supported by a bootstrap value of 87% included 10 isolates, all of them from Paraná, cluster C supported by a bootstrap value of 62% included eight isolates from three localities and cluster D supported by a bootstrap value of 91% included seven isolates, all of them from Oliveros. Of 55 isolates analyzed, 20 haplotypes were identified, showing that 36% of the isolates had a unique banding pattern, although isolates with the same haplotype were found in each group. These results allow to infer that there is a partial relationship between geographic origin and haplotype, since the isolates belonging to clades B and D were only from Paraná and Oliveros localities respectively. However in clades A and C there were certain isolates that did not follow any such patterns and were clustered randomly, being from different geographic origin. On the other hand, other isolates from different geographic origin had the same haplotype. A low genetic diversity (G) of 26.26% was estimated for this population using IGS-RFLP.
 IGS-RFLP analyzed data d and (B) ISSR data using Dice coefficient. The numbers on the branches represent bootstrap support values.")
Eight ISSR primers that produced clear and reproducible bands were selected for amplifying DNA samples of F. graminearum isolates. The ISSR analysis of all isolates resulted in a total of 87 bands, 47 of which (54%) were polymorphic. The polymorphic bands ranged in size from 180 to 1900bp (Table 2B). The 846 (CA)8RT primer showed the highest polymorphism (80%), generating 15 bands and 8 haplotypes. Moreover, 840 (GA)8YT primer generated only 5 bands, which did not show any polymorphisms. The cluster analysis of ISSR data by the UPGMA method resulted in a dendrogram that separated the isolates into 15 haplotypes and two main clusters A and B, both supported by a bootstrap value of 100% and considering a similarity level>0.68 (Fig. 1B). CCC (r=0.991) value indicates that the dendrogram is a good representation of the genetic relationship of the isolates. The 15 haplotypes identified showed that 27% of the isolates had a unique banding pattern and a low genotypic diversity (G) of 25.77%. Cluster A included most of the isolates from different localities (53) and Cluster B only two isolates (A2 and A3), both from Oliveros locality. The comparison of matrices generated by IGS-RFLP and ISSR showed a low correlation value (r=0.175).
Few studies about F. graminearum genetic variability have been recorded in South America, including Argentina. The analysis of genetic diversity among local populations using AFLP markers determined a high level of genotypic diversity.1,12 In this study, IGS-RFLP and ISSR markers showed genetic variability among analyzed F. graminearum isolates. Although in this study we used a clade primer set, which would allow amplification of the F. graminearum species complex, extensive studies carried out in the Argentinian wheat region only show the presence of F. graminearum sensu stricto in wheat. Moreover, other reports have also shown that other species can often co-occur with F. graminearum sensu stricto in the same geographic areas. In Argentina, only Fusarium meridionale and Fusarium bothii were reported on maize in the north western, subtropical region.1
Although a low genotypic variability was found in the population analyzed (around 26–27%) using IGS-RFLP and ISSR, both techniques allowed reproducible and informative polymorphisms. IGS-RFLP detected a higher polymorphic average (59.91%) than ISSR (44.11%). Moreover IGS-RFLP was able to discriminate 55 isolates in 20 haplotypes, whereas ISSR resolved only 15 haplotypes. The average PIC score for the IGS-RFLP marker (0.211) was higher compared to the ISSR marker (0.129), indicating that IGS-RFLP is more informative than ISSR. A low genotypic diversity of around 26% from all populations was calculated. Our results are in agreement with other surveys that reported a limited level of genetic diversity and asexual proliferation in F. graminearum populations from eastern China3, Canada and Hungary15. In our study, the presence of predominant clonal isolates identified by the two techniques could be attributed to various reasons. Maybe the pathogen could survive in a vegetative state in crop debris during the wheat growing season and unfavorable climatic conditions for the development of perithecia occurred. Furthermore, the crop rotation strategies used in the sampling area could influence the distribution of haplotypes and their dispersion in the study areas. Finally, asexual proliferation could be of epidemiological significance since this mechanism can be a dispersal strategy for rapid amplification of strongly fit individuals, such us the producers of certain types of toxins4.
The analysis of comparison of matrices generated for both markers showed a low correlation value (r=0.175). A possible explanation for these results would be that both markers had different targets in the genome and their ability to resolve genetic diversity among isolates could be more directly related to the number of polymorphisms detected with a marker rather than to the technique that was used.
In this research, the clustering of the isolates based on IGS-RFLP data exhibited a genetic variation pattern that was only partially related to the geographic origin of the isolates in agreement with other studies8. It is noted that for IGS-RFLP, the detected genetic variability levels and the partial relationship with the geographic origin of F. graminearum may be due to several factors such as spore dispersal among localities through the wind, specific agricultural practices and/or ecological conditions prevailing in the areas where these isolates were collected, which would be related to the local adaptation of isolates and the differential behavior or the possibility of infection. The dispersion among recorded values of genetic variability worldwide for F. graminearum could be due to other kind of factors, such as the sampling conducted and the type of analysis performed. Therefore, the divergence among data makes it difficult to compare results and relate genetic structures with the geographical origin.
To our knowledge, this is the first research work that examines F. graminearum isolates using IGS-RFLP and ISSR markers in Argentina. Therefore, the use of other molecular markers such as IGS-RFLP and ISSR in our study would allow to implement an alternative approach to the study of the variability of local F. graminearum isolates.
Ethical disclosuresProtection of human and animal subjectsThe authors declare that this research has not been conducted with experiments on humans or animals.
Confidentiality of dataThe authors declare that this article does not appear patient data.
Right to privacy and informed consentThe authors declare that no patient data appear in this article.
Conflict of interestThe authors declare that they have no conflicts of interest.
We thank Consejo Nacional de Investigaciones Científicas y Tecnológicas (Grant PIP 1422, PIP 0477), Fundación para Investigaciones Biológicas Aplicadas (FIBA) and FONCYTPICT 2011-0851 for the financial support and technical assistance provided by Bernardina Catalina López.
