


Digital technology innovation has become a key driver of sustainable development, but its impact on the circular economy has been little explored theoretically or empirically. This study uses panel data from 279 cities in China from 2011 to 2022 to measure the circular economy development index in four key dimensions: production systems, living systems, development momentum, and development benefits. Combining panel fixed effect, mediation effect, spatial econometric, and threshold models, we quantify the mechanism of the impact of digital technology innovation on the circular economy and analyze its spatial spillover effects. The results show that digital technology innovation significantly promotes the development of the circular economy in Chinese cities by reducing energy consumption intensity and promoting industrial structure upgrading. Moreover, digital technology innovation has a spatial spillover effect on the circular economy and promotes the development of the circular economy in surrounding cities through the “demonstration effect.” Heterogeneity analysis of geographical location and resource endowment shows that digital technology innovation plays the most significant role in promoting the circular economy in eastern, central, and non-resource-based cities. In addition, with digital technology innovation and natural resource dependence as threshold variables, the impact of digital technology innovation on the circular economy shows the characteristics of a U-shaped relationship and a marginal decline, respectively. These findings have multiple theoretical implications. Our support for a broad framework for comprehensively evaluating the impact of digital technology innovation on circular economy development makes a significant contribution to the literature on digital technology and the circular economy. This study emphasizes the digitalization of urban sustainable development and provides practical guidance for policymakers on implementing differentiated decisions related to the circular economy. The study explores relevant scholarly debate and provides valuable insights and a basis for cities to implement strategic decisions regarding the development of the circular economy.
With global resource consumption exceeding the Earth’s renewable capacity, waste generation is expected to reach 3.8 billion tons by 2050 (UNEP, 2024), leading to sustainability challenges such as climate change and ecological degradation. The circular economy (CE) is undergoing a major shift from the traditional “take, make, dispose” model to a resource-renewable system (Viles et al., 2022). This shift has gained unprecedented momentum worldwide, and according to the 2025 Circular Economy Global Market Report, its size will grow from US$463.07 billion in 2024 to US$517.79 billion in 2025, with a compound annual growth rate of 11.8 %. In addition, the CE has received widespread attention from governments, practitioners, and researchers (Baars et al., 2021; Liu et al., 2022). Meanwhile, the transformative digital technologies ushered in by the fourth industrial revolution, including artificial intelligence, blockchain, the Internet of Things (IoT), and big data analytics, have fundamentally reshaped production processes and lifestyles and promoted widespread economic and social changes (De Villiers et al., 2021). However, although people are increasingly realizing that digital technology can accelerate the transition to a CE, there is still insufficient real-world evidence of this relationship, especially regarding the path mechanism, spatial effects, and impact of digital technology innovation on the CE. Such research can provide practical guidance for policymakers and help the world transition smoothly to a sustainable CE model.
China provides an excellent research context for examining these relationships. As a world manufacturing power, China produces 28.7 % of global output, but it also contributes 31.1 % of global carbon emissions (IEA, 2025). Its CE transformation has far-reaching implications for sustainable global development. China’s 14th Five-Year Plan emphasizes digital technology innovation as an important driving force for the transformation and upgrading of traditional industries, future economic growth, and sustainable global development (Asgari & Asgari, 2021; George et al., 2021). The deep integration of the government’s “Digital China” initiative and “dual carbon” goals has created a unique policy environment for China. The two goals are highly coordinated at the strategic level and are both given priority. This coordinated development strategy has achieved remarkable results. From 2011 to 2023, the proportion of GDP represented by China’s digital economy soared from 11.6 % to 42.8 %, making the digital economy an important engine of economic growth (CITCA, 2024). In 2023, the total amount of recycled resources was approximately 376 million tons, with an increase of 1.5 % over 2022 (CMRA, 2024). A benign interactive trend between the economy and the environment has been formed, and the role of digital technology innovation cannot be ignored.
The theoretical foundations linking digital innovation to CE transitions are well established yet empirically underexplored. Digital technologies enable real-time resource tracking, predictive maintenance, and platform-based sharing models that fundamentally alter traditional linear production systems (Al-Raeei, 2024). From the perspective of its impact mechanism, digital technology not only optimizes the industrial structure but also enhances the technological innovation capabilities of traditional industries, thereby promoting industrial upgrading (Hao et al., 2023; Xie et al., 2024). Digital technology plays a vital role in environmental governance by regulating pollution levels and improving enterprises’ environmental management capabilities (Li et al., 2020; Yang et al., 2024). In addition, digital technology has brought positive changes to the field of green finance, creating a wider range of green financing opportunities by expanding green credit services (Feng et al., 2022; Hossain et al., 2024). These multifaceted mechanisms suggest that the impact of digital technology innovation on CE development works through complex and interrelated pathways, which require comprehensive empirical research.
In terms of research perspectives, many scholars have constructed theoretical frameworks covering the IoT (Ding et al., 2023), big data (Awan et al., 2021), the digital economy (Nham, 2022; Schöggl et al., 2023), and the CE (Liu et al., 2022). These studies provide an important theoretical basis for understanding the role of digital technology in promoting sustainable development. In addition, the literature has explored the complex relationship between digital technology and green development (Lyu et al., 2024; Ma & Zhu, 2022), environmental performance (Li et al., 2020; Zheng et al., 2024), and sustainable development (Ma & Zhang, 2025), revealing the key role of digital technology in promoting the coordinated development of the economy and environment. However, emerging economies are lagging behind in developmental terms, and their economic growth is highly dependent on resource input (Ma et al., 2025; Wang et al., 2025b), facing many challenges in the process of sustainable transformation. How to promote the transformation of cities in line with a CE development model is not only an important topic of theoretical research but also a key direction of practical exploration.
Although research in this area is continuously deepening, three critical gaps persist. First, most studies have remained at the conceptual stage or relied on case studies, failing to provide empirical evidence of the systemic impact of digital technology innovation on CE transformation. Second, spatial dimensions have been largely neglected, despite the importance of inter-city spillovers and regional coordination for CE transitions. Third, potential threshold effects and heterogeneous impacts across different geographic regions and resource endowments have received limited attention, reducing the practical applicability of findings for targeted policy interventions. To fill these research gaps, the present study uses panel data from 279 cities in China from 2011 to 2022 to conduct an in-depth exploration of the relationship between digital technology innovation and the CE and systematically examine its impact mechanism, spatial spillover effect, heterogeneity, and threshold effect.
This study makes four key contributions to the literature. First, we construct a new analytical framework and build an indicator system for the CE in four dimensions: production systems, life systems, development momentum, and development benefits. This provides a scientific quantitative method and theoretical support for achieving sustainable development. Diverging from previous studies, we use the entropy weight technique for order preference by similarity to ideal solution (TOPSIS) method to evaluate the level of CE development. This method compensates for the shortcomings of the traditional entropy weighting method and can better reflect the changes in the importance of each indicator in different periods. Second, this is the first empirical study on the impact of digital technology innovation on the CE. We use a mediation effect model to reveal two key paths through which digital technology innovation supports the development of the CE, namely reducing energy consumption and upgrading industrial structure. These findings help to better understand the intrinsic connection between the two. Third, we advance the spatial economics literature by incorporating geographic interdependencies into the analysis of CE development. Using spatial econometric models, we examine whether and how the benefits of digital technology innovation transcend administrative boundaries, providing important insights for regional policy coordination and collaborative governance. Fourth, by examining the threshold effects and heterogeneous impacts in different urban environments, we reveal the complex nonlinear characteristics of the relationship between digital innovation and the CE and show how the effectiveness of digital technology innovation varies depending on conditions such as geographical location and resource endowment.
This study has direct policy implications for governments worldwide, as it seeks evidence-based strategies to integrate digital technologies and the CE. Based on these important findings, the study responds to the current academic debate, enriches research on the impact of digital technology innovation on the CE, and provides a guiding framework for relevant government departments to formulate strategic policies that promote the development of the CE in a targeted and localized manner, thereby achieving sustainable development goals.
The structure of this paper is organized as follows. Section 2 provides a theoretical analysis and formulates hypotheses. Section 3 details the research design, encompassing the methodology and data sources. Section 4 reports the empirical analysis. Section 5 provides further discussion. Section 6 presents the conclusion and policy implications. The overall research framework is illustrated in Fig. 1.
Literature review and hypothesis developmentDigital technology innovation and CE
The literature to date has focused on the digital economy. For instance, Zhang et al. (2024a) argued that the digital economy utilizes data resources as a key element and digital technology as a driving force to achieve deep integration between the digital and real economies. Furthermore, as an emerging economic development model, the digital economy leverages the Internet and big data technology to reorganize factor resources, optimize traditional production processes, enhance production efficiency, and foster the coordinated development of the urban CE (Lyu et al., 2024; Ma & Zhang, 2025). Additionally, by establishing digital platforms, enterprises can integrate information resources across stages of the industrial chain and reduce information search costs (Fu et al., 2024). This facilitates efficient resource sharing and information transmission, enhances the coordination efficiency of the industrial chain, and ultimately improves green total factor productivity.
The theoretical impact of digital technology innovation, as the core engine of the digital economy, on the CE can be analyzed in four dimensions: production systems, living systems, development momentum, and development benefits. First, digital technology innovation promotes the sustainability of production systems by optimizing production processes, improving production efficiency, and reducing resource waste. For example, artificial intelligence can significantly improve energy utilization efficiency and reduce pollution emissions in the production process (Zeng & Zhang, 2024; Zhou et al., 2024). Second, digital technology innovation provides support for realizing sustainable living systems through the application of technologies such as smart monitoring, smart homes, telemedicine, and smart cities. The application of these technologies not only reduces residents’ energy consumption but also improves social welfare (Rusch et al., 2023; Xie et al., 2024). Third, digital technology innovation provides momentum for the development of the CE by promoting technological innovation, enhancing corporate competitiveness, and promoting industrial upgrading. For example, high-quality innovation practices enhance not only enterprises’ market competitiveness but also their sustainable development (Pu et al., 2023; Quttainah & Ayadi, 2024). Fourth, digital technology innovation can realize the development benefits of the CE by improving resource utilization efficiency, reducing environmental pollution, and enhancing social welfare, thus providing important support for achieving sustainable development goals (Ma et al., 2025; Xue et al., 2025). Based on the above analysis, our first hypothesis is as follows.
H1 Digital technology innovation can promote urban CE development.
Currently, digital technology is widely applied across various sectors, including public services, industrial development, and transportation, transforming production processes and daily life (Wang et al., 2025b). Due to its high levels of penetration, mobility, and synergy, digital technology transcends geographical, temporal, and spatial constraints, facilitating the efficient flow and allocation of resources (Bai et al., 2024). For example, in the transportation sector, digital technology mitigates congestion and lowers carbon emissions by optimizing traffic control and transportation demand management (Lv & Shang, 2023). This technology not only overcomes regional, temporal, and spatial constraints on resource allocation but also minimizes resource and energy waste, thereby reducing carbon emissions and promoting the development of a low-carbon economy (Ma & Zhang, 2025; Zheng et al., 2024).
Furthermore, digital technology exhibits substantial cross-industry and cross-regional spillover effects. It enhances the efficiency of acquiring, storing, and utilizing non-fossil energy while simultaneously reducing energy consumption costs through technological innovation and economies of scale (Fu et al., 2024). For instance, IoT-based energy systems enable real-time energy monitoring and control, enhancing efficiency and optimizing cost management in energy digital transformation (Ahmad & Zhang, 2021). This technological spillover effect also mitigates the adverse impact of traditional fossil fuel-based energy structures, such as coal, on the urban low-carbon CE. By optimizing resource allocation and reducing energy consumption intensity (ECI), digital technology innovation acts as a catalyst for sustainable progress (Hossain et al., 2024). Drawing on these observations, we formulate our second hypothesis.
H2 Digital technology innovation indirectly promotes the CE by reducing ECI.
The Kuznets hypothesis, as reflected in industrial upgrading, indicates that the share of value added from the tertiary sector increases with economic development (Guo & Shahbaz, 2024). From the perspective of digital industrialization, advancements in digital technology drive the emergence of industries centered around digital innovation (Xie et al., 2024). Such industrial information technologies not only enhance resource utilization and reduce energy consumption but also boost productivity by optimizing resource allocation and fostering urban CE development (Cagno et al., 2021; Khan et al., 2021). From the perspective of industrial digitalization, digital technology innovation steers industrial transformation toward high-tech intensity and innovation-driven growth. This transformation fosters the digitalization of traditional industries, including smart manufacturing and IoT applications in production, e-commerce and smart retail in commerce, and fintech innovations in the finance sector (Sarkar et al., 2024).
As the service sector expands, its role in driving CE development strengthens. First, digital industrialization encompasses advanced productive and high-end services, and digital technology innovation promotes the growth of high-end service sectors (Liu et al., 2024). Second, the application of digital technology is a key driver of the evolution of innovative business models. The advancement of digital technology such as big data and artificial intelligence has accelerated the expansion of knowledge-intensive service industries and driven ongoing industrial transformation (Chen et al., 2021; Zhang et al., 2024b). Finally, digital technology innovation lowers technical barriers between the modern urban service sector and advanced manufacturing, fostering their integrated development (Xie et al., 2024). Drawing on these analyses, we formulate our third hypothesis.
H3 Digital technology innovation indirectly promotes CE through industrial structure upgrading.
Digital technology can transcend temporal and spatial limitations, boosting the effectiveness of information dissemination and increasing the breadth and depth of regional connectivity. Chen et al. (2022) and others demonstrated that carbon emissions exhibit significant spatial spillover effects and path-dependent characteristics. Digital technology increases the mobility of knowledge and technology (Li et al., 2024). Moreover, technological innovation spillover is a multifaceted process affected by various factors, such as geographical and economic proximity, with varying modes and degrees of impact (Lundquist & Trippl, 2013). Therefore, through digital technology innovation, cities can leverage spatial spillover effects to influence resource allocation and energy consumption in the integration of manufacturing and digital technology (Wang et al., 2025a), fostering a coordinated CE development trend across cities (Cheng et al., 2023). Furthermore, with its extensive scope, digital technology exerts significant penetration and radiation effects on various industries. Digital technology innovation not only advances local low-carbon circular technologies but also generates positive spillover effects that encourage green innovation behaviors in neighboring regions, thereby promoting the development of the CE (Ma & Zhu, 2022). Drawing on these analyses, we formulate our fourth hypothesis.
H4 Digital technology innovation drives the CE in neighboring cities through spatial spillover effects.
We employed an empirical approach to examine the connection between digital technology innovation and CE. The spillover effects of technology innovation are shaped by a range of factors and involve intricate dynamics. Following Ma et al. (2025), we developed the following baseline regression model:
where i and t represent the city and year, respectively. CEit indicates the development level of the CE. DTIit measures the level of digital technology innovation. Xit stands for the control variables, specifically the level of industrial enterprise development (IND), marketization level (MAL), foreign direct investment (FDI), government fiscal decentralization (GFD), and city size (CIS). μi is the city fixed effect, δt is the year fixed effect, and εit is the random error term.
To mitigate potential endogeneity concerns, we employed the product of each city’s postal and telecommunications business volume in 1984 and its annual per capita telecommunications business revenue as an instrumental variable for digital technology innovation (Luo et al., 2024) and constructed a two-stage least squares (2SLS) regression model.
where IVit represents the instrumental variable.Mediation effect model

To explore the mechanism of the impact of digital technology innovation on CE, we constructed a mediation effect model based on Yang et al. (2024b) and Zheng et al. (2024). The model was designed to elucidate the pathways through which digital technology innovation affects CE development.
where Mit represents the mediating variables, namely energy consumption intensity (ECI) and industrial structure upgrading (ISU). As the estimated coefficient α1 for digital technology innovation in Model (1) was significant, if β1 and γ2 were simultaneously significant, we could assumed that digital technology innovation influences urban CE through these mediating variables.Spatial econometric model

Digital technology can overcome spatial constraints and accelerate cooperation and exchange between regions through its permeability and integration, thereby generating spatial spillover effects (Cheng et al., 2023). Therefore, we used spatial econometric models for empirical analysis, including a spatial error model (SEM), spatial lag model (SLM), and spatial Durbin model (SDM). As the SDM incorporates both spatial lag terms and spatial error terms of variables, it is the most widely used of these three models (Bai et al., 2024). The SDM model we constructed is presented as follows:
where ρ is the spatial autoregression coefficient, γ2 is the elasticity coefficient of the spatial interaction term of digital technology innovation, and γ4 is the elasticity coefficient of the spatial interaction term of the control variable. W is a different spatial weight matrix. Referring to Chen and Yao (2024), we constructed a geographic distance matrix (WG), an economic distance matrix (WE), and an economic geography matrix (WM). See Appendix A for the specific setting method.Threshold model
To explore the possible nonlinear association between digital technology innovation and the CE, we employed a panel threshold model to identify and test threshold effects in the variables (Han et al., 2024). This model is particularly suitable for analyzing how the impact of digital technology innovation on urban CE changes across threshold levels.
where Tit denotes the threshold variables, comprising digital technology innovation (DTI) and natural resource dependence (NRD). I ( ) denotes the indicator function, taking the value of 1 if the condition within the parentheses is met, and 0 otherwise. Eq. (7) represents a single-threshold model, which can be expanded to a double-threshold or multi-threshold model as needed during the empirical analysis.Variable measurementDependent variable
The CE is a regenerative economic model that replaces the linear “take, make, dispose” model with closed-loop processes of reducing, reusing, and recycling throughout production and consumption cycles (Morseletto, 2020; Viles et al., 2022). It operates within the broader sustainable development framework, contributing to environmental sustainability through reduced resource extraction and waste, economic sustainability via new business models and efficiency gains, and social sustainability through job creation in the recycling and remanufacturing sectors (Elsawy & Youssef, 2023).
The CE differs from related concepts: unlike the green economy’s focus on low-carbon transitions, it emphasizes material cycles and resource productivity; unlike the sharing economy’s “access over ownership” model, it encompasses entire material lifecycles; and while industrial ecology concerns industrial ecosystems, the CE extends to consumption patterns and urban systems (Rusch et al., 2023; Viles et al., 2022).
Previous studies have mainly used the pressure–state–response (PSR) framework to evaluation the CE (De Pascale et al., 2021; Wang et al., 2021). However, the PSR framework lacks indicators of economic vitality, development potential, and governance capacity, resulting in a narrow evaluation scope. To comprehensively evaluate and compare levels of urban CE development, we constructed a CE indicator system based on the whole process from input to output. Drawing on the literature (Fan & Fang, 2020; Kulakovskaya et al., 2023) and considering the United Nations’ Sustainable Development Goals, we designed an indicator system with 22 third-level indicators in four dimensions, namely production systems, living systems, development momentum, and development benefits, to more comprehensively reflect the level of CE development (Table 1).
Evaluation index system for circular economic development in Chinese cities.
| First-level indicators | Second-level indicators | Third-level indicators | Attributes | References |
|---|---|---|---|---|
| Production system | Production behavior | Total investment in industrial pollution control | + | George et al. (2021); Yang et al. (2024a) |
| Fertilizer usage per unit of cultivated land | − | Ma and Zhu (2022) | ||
| Production structure | Ratio of employees in the tertiary sector to total employment | + | Ma and Zhu (2022) | |
| Ratio of the tertiary sector’s value added to GDP | + | Ma and Zhu (2022) | ||
| Life system | Livable environment | Green coverage rate in urban built-up areas | + | Ma and Zhang (2025) |
| Rate of harmless treatment for domestic waste | + | Ma and Zhang (2025) | ||
| Area of public green space per capita | + | Ma and Zhang (2025) | ||
| Lifestyle | Domestic water consumption per capita | − | Ma and Zhu (2022) | |
| Energy consumption for domestic use per capita | − | Ma and Zhu (2022) | ||
| Development momentum | Technological innovation | Total investment in research and development | + | Ma and Zhu (2022); Pan et al. (2021) |
| Ratio of environmental protection spending to general public budget expenditure | + | Ma and Zhu (2022); Pan et al. (2021) | ||
| Green finance | Ratio of environmental protection firms’ market value relative to the total market value of listed companies | + | Lv et al. (2021) | |
| Green credit balance | + | Lv et al. (2021) | ||
| Green insurance coverage | + | Lv et al. (2021) | ||
| Development benefits | Green benefits | Ratio of days with good air quality | + | George et al. (2021) |
| Annual mean concentration of PM2.5 particles | + | Yang et al. (2024a); Zheng et al. (2024) | ||
| Low carbon benefits | Carbon dioxide emission intensity of GDP | − | George et al. (2021); Ma et al. (2025) | |
| Smoke and dust emissions per unit of GDP | − | Yang et al. (2024a) | ||
| Circular benefits | Rate of comprehensive utilization of industrial solid waste | + | Ding et al. (2023); Fan and Fang (2020) | |
| Rate of harmless treatment of domestic waste | + | Ding et al. (2023); Fan and Fang (2020) | ||
| Social benefits | Disposable income per capita for urban residents | + | Ma and Zhu (2022); Pan et al. (2021) | |
| Urbanization rate | + | Ma and Zhu (2022); Pan et al. (2021) |
Note: + represents a positive indicator, where a larger value is better; - represents a negative indicator, where a smaller value is better.
To evaluate the importance of each indicator, we modified the TOPSIS model using entropy weighting (EW), thereby enhancing the scientific rigor of the measurement model. Unlike subjective assignment methods, the EW-TOPSIS model provides a more comprehensive, objective, and scientific reflection of the level of CE development in each city. The detailed calculation process of the EW-TOPSIS model is provided in Appendix B.
Independent variableAuthorized patents are a key indicator of innovation output. Referring to Arora et al. (2021), we used the number of authorized digital technology patents to measure digital technology innovation. Based on the International Patent Classification (IPC) numbers from the “Digital Economy Core Industry Classification and International Patent Classification Reference Table” (2023) issued by the State Intellectual Property Office, we identified digital technology innovation patents that align with the technical features of digital innovation activities at the IPC level. These patent data offer a relatively clear and precise depiction of the digital attributes of digital technology innovation activities (Chen et al., 2022; Yang et al., 2024b), thereby enabling precise identification of digital technology innovation levels across cities.
Mediating variablesReducing energy consumption intensity (ECI) is a critical means of achieving carbon neutrality. Previous theoretical analysis has indicated that digital technology innovation promotes CE development by enhancing resource allocation efficiency, lowering energy use, and diversifying forms of energy consumption (Ma & Zhang, 2025). We used the electricity consumption per unit of GDP in each city as an indicator of energy consumption intensity (Hossain et al., 2024).
Achieving China’s “dual carbon” goals hinges significantly on industrial structure upgrading (ISU). As previously discussed, the processes of digital industrialization and industrial digitization propel industrial structures toward greater technological intensity and innovation orientation. Building on the methodology of Zhou et al. (2013), we used the proportions of GDP represented by the primary, secondary, and tertiary sectors to assign corresponding weights for measuring ISU.
Control variablesTo comprehensively analyze the factors influencing urban CE development, we selected the following control variables based on previous studies (Hao et al., 2023; Lyu et al., 2024; Yang et al., 2024a; Yang et al., 2024b). The level of industrial enterprise development (IND) was measured by the logarithm of the total profit of industrial enterprises above a designated size in each city. The marketization level (MAL) was assessed based on the ratio of private enterprise employment to total employment within a city. Foreign direct investment (FDI) was gauged by the logarithm of foreign capital utilization in each prefecture-level city. Government fiscal decentralization (GFD) was determined by the ratio of local government fiscal revenue to its fiscal expenditure. City size (CIS) was calculated using the logarithm of the year-end population in each city.
Data sourcesTo ensure data availability and consistency, we conducted empirical analysis using sample data from 279 cities at prefecture level and above in mainland China from 2011 to 2022. The study excluded Hong Kong, Macao, and Taiwan. Digital technology innovation patent data were sourced from the official website of the State Intellectual Property Office. Other data were obtained from various statistical yearbooks, including the China City Statistical Yearbook, China Urban Construction Statistical Yearbook, China Statistical Yearbook, China Energy Statistical Yearbook, and China Electricity Yearbook, as well as province- and prefecture-level city yearbooks and statistical bulletins. The results of the descriptive statistical analysis are summarized in Table 2.
Descriptive statistics of variables.
Considering the measurement structure of digital technology innovation and CE development level, we used the natural breakpoint method to classify the evaluation values into five intervals for analysis (Fig. 2). Figs. 2-a, 2-b, and 2-c indicate that from 2011 to 2022, the digital technology innovation levels of Chinese cities exhibited significant characteristics of agglomeration and diffusion, with overall innovation levels gradually improving. Cities with high digital technology innovation levels are primarily concentrated in the eastern coastal regions, particularly in the Yangtze River Delta, Pearl River Delta, and Beijing. However, there is a pronounced gap in digital technology innovation between regions. Underdeveloped regions have weaker digital infrastructure and lower levels of digital economic development, resulting in poorer digital technology innovation capabilities.

Figs. 2-d, 2-e, and 2-f show that from 2011 to 2022, the CE development levels of Chinese cities generally increased, with high-level cities forming spatial agglomerations in the eastern coastal regions and regional disparities continuing to widen. In 2011, most cities had low CE development levels. In 2017, the majority of cities showed a medium level of CE development, with some cities reaching a high level. By 2022, the number of low-level cities had further decreased, while the number of high-level cities had significantly increased. However, during this period, the gap between eastern coastal cities and those in central and western regions gradually widened. A possible explanation is that economically developed regions have advantages in terms of production systems, living systems, and development momentum, thereby forming green development benefits and promoting economic development toward a low-carbon CE.
Baseline resultsTable 3 presents the results of the baseline regression of the impact of digital technology innovation on CE. Columns (1) and (2) show the results for the uncontrolled variables, and columns (3) and (4) indicate the control variables, with column (4) controlling for the fixed effects of city and year. The coefficients of digital technology innovation are all significant and positive, indicating that digital technology innovation has significantly promoted the development of the CE in Chinese cities. Specifically, column (4) shows that for every 1 % increase in digital technology innovation, the level of CE development increases by 25.8 %, verifying Hypothesis 1. A possible explanation is that digital technology innovation can promote the upgrading of low-end industries and promote greener production methods. At the same time, it can drive economic activities toward digitalization and intelligence, thereby changing production methods and living systems and exerting a positive impact on development.
Benchmark regression results.
Note: ***, **, and * indicate statistical significance at the 1 %, 5 %, and 10 % levels, respectively. Robust standard errors are in parentheses.
This finding is consistent with and builds on recent literature on the environmental impact of digital technology. Lyu et al. (2024) established a connection between digitalization and green development, and Zheng et al. (2024) revealed the role of the digital economy in improving environmental performance. Unlike previous studies, which have tended to focus on a single environmental outcome, our study considered multiple such outcomes and thus deepens understanding of the role of digital technology innovation in CE development. In particular, we quantified the comprehensive effects of digital technology innovation on CE in multiple dimensions, capturing the systematic impact of digital technology innovation on production systems, living systems, development dynamics, and development benefits.
Endogeneity treatment and robustness testsInstrumental variable methodAlthough we adopted a panel two-way fixed effect model, the potential problem of endogeneity could not be ignored. The development of the CE is inseparable from digital technology innovation, which is in turn inseparable from the development of the circular economy. Therefore, there is a causal relationship between digital technology innovation and the CE. In addition, many factors affect the CE, and it was difficult to control for omitted variable bias with the control variables involved in the current study. Given these potential problems of reverse causality and omitted variable bias, we alleviated the risk of endogeneity using instrumental variables (IVs) and 2SLS for estimation. Following Luo et al. (2024), we used the postal and telecommunications business volume of each city in 1984 as an instrumental variable. However, as the data were cross-sectional, we used the postal and telecommunications business volume of each prefecture-level city in 1984 and the per capita telecommunications income of the previous year to construct an interaction term as an IV for digital technology innovation. The main basis for selecting this IV was as follows. First, based on the historical time series correlation, the development of the postal and telecommunications business in 1984 provides a good construction foundation and technical reserve for current digital technology innovation, supporting the correlation hypothesis. Second, as we used historical data from 1984 and per capita telecommunications revenue data for the previous year, the current random disturbance term during the sample period was an exogenous variable, satisfying the exogeneity assumption.
Table 4 shows the results of the 2SLS regression model. The IV tests showed that the p-value associated with the Kleibergen–Paap rk LM statistic was 0.000, thereby rejecting the null hypothesis of under-identification. Furthermore, the Kleibergen–Paap rk Wald F statistic was 472.917, which is above the critical threshold for the 10 % significance level according to the Stock–Yogo test. This result effectively rejected the null hypothesis that the selected IVs had weak identification. These findings indicated a strong correlation between the IVs and the endogenous variables, confirming the validity of the IV method (Xue et al., 2025; Zheng et al., 2024). In the first stage (2SLS-1), the IV had a positive and significant regression coefficient, indicating a strong positive correlation between the IV and digital technology innovation. In the second stage (2SLS-2), digital technology innovation significantly promoted CE development. When endogeneity was considered, the results of the IV estimation confirmed that the benchmark regression results were still reliable.
Endogeneity test results.
Note: ***, **, and * indicate statistical significance at the 1 %, 5 %, and 10 % levels, respectively. Robust standard errors are in curved brackets. p-values are shown in square brackets.
As an additional robustness check, we used a fixed effect model with the system-generalized method of moments (SYS-GMM) technique for regression analysis. In column (3), the p-value for AR(1) was 0.000, while that for AR(2) was 0.810. The Hansen test yielded a p-value of 0.180. The results of the Arellano–Bond autocorrelation test and the Hansen over-identification test validated the effectiveness of the SYS-GMM model (Lyu et al., 2024). The results showed that digital technology innovation continued to have a significant positive impact on CE, which was consistent with the original benchmark regression results and supported the validity of our findings.
Replacing dependent variableThe core goal of the CE is to achieve sustainable economic, social, and environmental development through the efficient and circular use of resources. Green total factor productivity (GTFP) is an economic indicator that comprehensively considers resource utilization efficiency and environmental impact and can fully reflect a region’s performance in terms of resource utilization and environmental protection. Therefore, GTFP can, to a certain extent, reflect the degree of greening of resource utilization, which is consistent with the goal of the CE (Morseletto, 2020; Viles et al., 2022). To ensure that the regression results were not sensitive to the selection of dependent variable indicators, we calculated GTFP using the super-efficiency SBM model, with undesired outputs as an alternative proxy for CE development (Hao et al., 2023). The input factors used to calculate GTFP included labor (measured by the number of urban unit employees), capital (measured by fixed asset investment), and energy (measured by total urban power supply). The desirable output indicator was a gross regional product, while the undesirable outputs included wastewater discharge, sulfur dioxide emissions, and smoke emissions (Chen & Yao, 2024; Lyu et al., 2024). As shown in column (1) of Table 5, the regression coefficient between digital technology innovation and GTFP was still positive and significant. This consistency between indicators with related concepts but different methodologies enhanced the reliability and robustness of the research results.
Robustness test results.
Note: ***, **, and * indicate statistical significance at the 1 %, 5 %, and 10 % levels, respectively. Robust standard errors are in parentheses.
Given that the macro-environment of each province may influence urban CE development, we incorporated the interaction effect of province and year as a fixed effect to address this issue. This control measure helped to mitigate the influence of macro-environmental factors and ensured the robustness of the regression results. The results in column (2) of Table 5 indicate that after controlling for macro-environmental factors, digital technology innovation can still promote the development of urban CE.
Controlling for other potential factorsWe further controlled for other potential factors that may influence urban CE development, such as financial development, which offers financial backing for urban infrastructure and may influence CE. To account for this, we incorporated the financial development level as an extra control variable, which was assessed by the proportion of total deposits and loans of financial institutions relative to annual GDP. The findings in column (3) of Table 5 demonstrate that the positive effect of digital technology innovation on urban CE persists even after accounting for financial development.
Deleting special samplesChina’s four municipalities (Beijing, Shanghai, Tianjin, and Chongqing) often have higher economic growth than prefecture-level cities due to their unique political and economic characteristics. As a result, their CE development levels may deviate substantially from those of typical prefecture-level cities. Therefore, we excluded the samples of these municipalities in a robustness test (Ma & Zhu, 2022). The results, shown in column (4) of Table 5, indicated that the coefficient of digital technology innovation on CE continued to be positive and significant, reinforcing the robustness of our conclusions.
Mechanism verificationWe hypothesized that digital technology innovation promotes urban CE development through two main pathways: reducing energy consumption intensity and facilitating industrial structure transformation and upgrading. Accordingly, we empirically examined the aforementioned impact mechanisms and discuss them in detail in this section. To this end, we introduced energy consumption intensity (ECI) and industrial structure upgrading (ISU) as mediating variables and used a mediation effect model to analyze their potential mechanisms of action. The findings are detailed in Table 6.
Results for mediating effects.
Note: ***, **, and * indicate statistical significance at the 1 %, 5 %, and 10 % levels, respectively. Robust standard errors are in parentheses.
The regression results in column (1) indicated a negative and significant coefficient of digital technology innovation on ECI, indicating that digital technology innovation effectively reduces ECI. When digital technology innovation and ECI were included simultaneously in the model to explain the CE, the results, shown in column (2), indicated that the coefficient of digital technology innovation on urban CE was still positive and significant. This result suggests that digital technology innovation promotes urban CE development by reducing ECI. Specifically, digital technology innovation enables enterprises to adopt advanced technologies to improve resource utilization efficiency and accurately measure and control pollutant emissions in the production process, thereby improving overall production management efficiency and reducing ECI. This is consistent with the research of Ma and Zhang (2025) and Zheng et al. (2024), who pointed out that the adoption of digital technology and advanced management concepts can enable enterprises to effectively reduce industrial pollution emissions and reduce urban carbon emission intensity. However, building on the literature, our study further analyzed the positive impact of digital technology innovation from the perspective of energy intensity. Our findings not only confirmed the effectiveness of digital technology innovation in reducing ECI but also revealed its significant role in promoting the development of the urban CE. Digital technology innovation can thus bring significant CE benefits to urban development and promote sustainable development in terms of pollution-related externalities (Wang et al., 2025b). Therefore, Hypothesis 2 was confirmed.
The regression results reported in column (3) showed that the coefficient of digital technology innovation on ISU was positive and significant, indicating that digital technology innovation significantly promotes ISU. Reported in column (4), the joint analysis of digital technology innovation and ISU showed that the coefficients of both variables were positive and significant. This suggests that digital technology innovation promotes urban CE development by promoting ISU, thus confirming the mediating role of ISU in the relationship between digital technology innovation and urban CE development. Therefore, Hypothesis 3 was verified. Specifically, digital technology innovation relies on intelligent equipment and digital platforms to promote the precise management and efficient use of resources. For example, digital technology can provide technical support for the development of the CE by optimizing resource allocation and utilization, reducing waste, and improving resource recycling. This not only improves the efficiency of traditional industries but also promotes the development of emerging industries, thereby promoting ISU. Although previous studies have pointed out the positive role of digital technology in ISU (Li et al., 2020; Xie et al., 2024), as well as the applications of digital technology in resource management and the green economy (Cagno et al., 2021; Khan et al., 2021), our study is the first to systematically analyze how digital technology innovation promotes the CE by advancing ISU. This finding not only supports the results of previous literature but also expands understanding of the role of digital technology innovation in the field of the CE, especially in terms of the connection between ISU and CE development.
Spatial spillover effectWe used the global Moran’s I index to evaluate the spatial dependence of CE in Chinese cities, with the findings depicted in Fig. 3. The detailed calculation method for this index is provided in Appendix C. From 2011 to 2022, Moran’s I index was positive and significant, indicating spatial correlation in CE development across Chinese cities. Specifically, under the geographic weight matrix (WG), Moran’s I index initially rose, then fell and subsequently increased again. Under both the economic weight matrix (WE) and the combined economic–geographic weight matrix (WM), the index followed a similar trend, characterized by an M-shape. Overall, the upward trend of Moran’s I index suggests that spatial correlation in CE development gradually intensified over the study period.

To account for the evident spatial dependence observed in Chinese urban CE development, we employed spatial econometric modeling. The results, reported in Table 7, indicated that the SDM was more suitable for this study than the SLM and SEM. The results of the Wald and LR tests were significant at the 1 % level, suggesting that the SDM possessed superior explanatory capacity. According to the Hausman test, which yielded a value significant at the 1 % level, fixed effect regression analysis was most appropriate (Cheng et al., 2023).
We used three spatial weight matrices for analysis, and the estimation results are shown in the SDM model in Table 8. Reported in columns (1), (3), and (5), the estimated coefficients of digital technology innovation were positive and significant, indicating that digital technology innovation significantly promotes local CE. Reported in columns (2), (4), and (6), the spatial lag term (Wx) related to digital technology innovation was also positive and significant, indicating that digital technology innovation promotes not only local CE development but also the CE of neighboring cities, through spatial spillover effects. Therefore, Hypothesis 4 was verified. The reason may be that the widespread penetration and dissemination of digital technology break regional boundaries, promote the circulation and sharing of information, and increase the diffusion of technological innovation (Li et al., 2024). In addition, there is a radiation and demonstration effect between neighboring cities. Regional development usually takes cities with similar geographical locations and economic strength as benchmarks, with a significant demonstration effect on neighboring cities. Studies have analyzed the spatial pattern characteristics of high-quality urban development in China (Pan et al., 2021) and revealed the spatial spillover effects of the digital economy on green innovation, carbon intensity, and carbon emission efficiency (Bai et al., 2024; Ma & Zhu, 2022). Our study sheds further light on the role of the “demonstration effect” in regional economic development and expands understanding of the spatial spillover effects of digital technology innovation in the regional economy.
Spatial Durbin model effect estimation results.
Note: ***, **, and * indicate statistical significance at the 1 %, 5 %, and 10 % levels, respectively. Robust standard errors are in parentheses. Main denotes the estimated coefficient of the variable; Wx denotes the spatial lag coefficient of the variable.
China is a geographically vast country with significant differences in development trajectories, institutional environments, and technological capabilities. Eastern regions are generally characterized by higher levels of economic development and more advanced technological infrastructure, which may lead to differences in the impact of digital technology innovation on regions. To examine how these regional differences affect the relationship between digital technology innovation and CE, we divided the sample into eastern, central, and western regions according to China’s standard geographic classification. The regression results are shown in columns (1) to (3) of Table 9. The results suggest that digital technology innovation significantly promotes CE development in the eastern and central regions but has a less significant impact on the western region, with the promotion effect being more prominent in the eastern region.
Heterogeneity test results.
Note: ***, **, and * indicate statistical significance at the 1 %, 5 %, and 10 % levels, respectively. Robust standard errors are in parentheses.
These findings extend the results of George et al. (2021) regarding energy efficiency and those of Xue et al. (2025) regarding climate change, showing that the environmental benefits of digital technology have significant spatial heterogeneity. However, our study reveals a more subtle result. The advantages of the eastern region are due not only to superior digital infrastructure but also to the complementarity between digital transformation and the existing CE foundation. Eastern cities have well developed recycling networks, waste management systems, and industrial symbiosis, which digital innovation can optimize and expand. In contrast, the industrial structure of western cities is dominated by extractive industries and primary processing, and the human capital and institutional capabilities required to implement digital solutions are relatively insufficient, thus limiting the innovation potential of digital technologies.
Urban resource heterogeneityFrom the perspective of resource endowment characteristics, there are significant differences between resource-based cities and non-resource-based cities in terms of economic structure and resource dependence. Resource-based cities are more dependent on traditional resource industries, and the application and impact of digital technology innovation in these cities may be more limited. In contrast, non-resource-based cities may have a higher degree of acceptance and application of new technologies and thus be more proactive in the CE transformation. Therefore, we divided 279 cities into resource-based cities and non-resource-based cities based on the National Sustainable Development Plan for Resource-Based Cities (2013–2020). The results, reported in columns (4) and (5) of Table 9, showed that CE has a significant promoting effect.
Our results are consistent with those of Hao et al. (2023) and Zheng et al. (2024), who studied the “resource curse” in environmental performance. We further found that this curse extends to cities’ ability to achieve sustainable development transformation through digital technology innovation. First, the economic development model of resource-based cities is centered on the linear “extraction–production–disposal” model: a traditional development model characterized by high levels of pollution and consumption. Second, the workforce skills and entrepreneurial ecosystems of resource-based cities are often focused on traditional industries, lacking the capabilities needed for digital circular integration. In non-resource-based cities, in contrast, industrial diversity can create opportunities for digital circularity. Their more balanced economic structures enable digital technologies to connect industries, promote digital technology innovation, and drive circular economic transformation.
Threshold effect analysisThe previous analyses indicate that digital technology innovation can promote urban CE development, but this relationship may be nonlinear. To explore this further, this section reports our use of a threshold model for analysis. In addition to using digital technology innovation as a threshold variable, we selected natural resource dependence (NRD) as a threshold variable, measured by the ratio of mining employment to total employment. To investigate the potential nonlinear link between digital technology innovation and CE, we used the bootstrap approach to conduct 1000 threshold effect tests. The results in Table 10 show that both digital technology innovation and NRD display double threshold effects. The threshold values for digital technology innovation were 0.269 and 0.404, while those for NRD were 0.020 and 0.120.
Threshold model test results.
Column (1) of Table 11 shows the results with digital technology innovation as a threshold variable. We observed a U-shaped relationship between digital technology innovation and CE. Specifically, when digital technology innovation was below the first threshold of 0.269, its coefficient was 0.109; between 0.269 and 0.404, its coefficient dropped to 0.028; when digital technology innovation exceeded 0.404, its coefficient was 0.073. This is not completely consistent with the results of Chen and Yao (2024). Although they found a U-shaped relationship between the digital economy and carbon productivity, they concluded that the digital economy promotes carbon productivity linearly only after exceeding a certain threshold. Expanding on this, we incorporated digital technology innovation into the analysis of the urban CE system. The research conclusions deepen understanding of the development stage of digital technology innovation, assisting in the formulation of targeted strategies the development of circular economy. The emergence of this U-shaped relationship may be because digital technology innovation played a significant driving role in the early stage of Chinese cities’ development, prompting relevant departments to actively apply digital technology to urban construction, thereby significantly increasing the level of urban CE. However, with the advancement of digital technology innovation, related technologies and supporting infrastructure may not be sufficient to meet the needs of urban CE development, weakening their role in promoting the CE. With a further increase in the level of digital technology innovation, the integration of digital technology and CE development continues to deepen and its contribution to the CE gradually increases.
Threshold effect regression results.
Note: ***, **, and * indicate statistical significance at the 1 %, 5 %, and 10 % levels, respectively. Robust standard errors are in parentheses.
Column (2) of Table 11 reveals the results with NRD as the threshold variable. The positive effect of digital technology innovation on CE showed a monotonically decreasing trend. When NRD was less than 0.020, the promotion effect of digital technology innovation was the largest, with a coefficient of 0.108; when NRD was between 0.020 and 0.120, the coefficient was 0.049; when NRD was greater than 0.120, the coefficient decreased to 0.034. This gradient effect reveals how resource dependence gradually constrains the circular effect of digital technology innovation through entrenched linear economic structures, limited economic diversity, and economic barriers formed by extractive industry interests. However, even cities with high dependence levels show positive effects, indicating that digital technology innovation can promote the CE in all environments, but its effectiveness varies. Although some studies have pointed out the impact of resource endowment on urban sustainable development (Hao et al., 2023; Zheng et al., 2024), most have analyzed a single dimension and failed to explore the nonlinear mechanism between that dimension and digital technology innovation. This study is the first to analyze the impact characteristics of NRD as a threshold variable. This finding not only supports previous results but also expands understanding of the role of NRD in the relationship between digital technology innovation and urban sustainable development.
Conclusion and policy implicationsConclusionDeveloping a CE is an important path to address global climate change and promote sustainable development. Utilizing panel data from 279 Chinese cities spanning 2008 to 2022, we constructed indicators of digital technology innovation and the CE to elucidate the pathways through which digital technology innovation impacts the CE across three dimensions: ECI, ISU, and spatial spillover effects. The key findings are summarized as follows.
First, the baseline regression analysis indicated that digital technology innovation has a statistical significance positive effect on urban CE, a finding corroborated by endogeneity and robustness tests. Further examination of the underlying mechanisms showed that digital technology innovation fostered urban CE by reducing ECI and facilitating ISU. These findings not only validate the positive role of reduced energy consumption intensity but also underscore the significance of industrial structure upgrading in advancing CE development.
Second, under various spatial matrix configurations, digital technology innovation exhibited a demonstration effect in its spatial spillover impact on urban CE, with spillovers positively influencing the CE of neighboring cities. This study extends the literature by employing a multidimensional spatial matrix, demonstrating that spatial spillover effects are contingent on economic and geographical proximity. This implies that cities can leverage spatial spillover effects to enhance the benefits of the CE and bridge the “digital divide.”
Third, considering urban geographical heterogeneity, the results suggest that digital technology innovation significantly inhibits CE in the eastern and central regions of China, while its impact on the western region remains statistically nonsignificant. From the perspective of urban resource heterogeneity, digital technology innovation significantly promotes CE in non-resource-based cities but fails to generate a substantial “green dividend” for resource-based cities.
Fourth, the impact of digital technology innovation on urban CE exhibits nonlinear characteristics. Using digital technology innovation and NRD as threshold variables, we found that the impact of digital technology innovation on urban CE manifested as a U-shaped relationship and diminishing marginal effects, respectively. Consequently, certain cities should reduce their reliance on natural resources and harness digital technology to overcome the constraints of the resource curse.
Policy implicationsFirst, the government should seize the opportunities afforded by digital technology innovation and take the lead in promoting CE development. Currently, digital technology is a strategic priority and a focal point of competition globally. Therefore, the government should deeply integrate digital technology innovation with CE development and establish a green, low-carbon digital technology innovation system. It should fully leverage the opportunities presented by the digital transformation of the CE and integrate digital technology innovation into urban low-carbon circular planning. Additionally, enterprises should enhance the innovation of efficient, clean, and intensive digital technologies, accelerate R&D and promotion, and develop a green digital technology model.
Second, the government should explore the pathways through which digital technology innovation promotes the CE and maximize its role in green transformation. It should improve green standards for technological innovation and use digital technology innovation to drive urban CE development. For example, digital technology innovation should be actively integrated into pathways that reduce energy consumption and upgrade industrial structures. Meanwhile, regions should align with national macro-policies, apply for favorable national policies, and promote CE development through digital technology innovation, considering both internal and external factors.
Third, a digital technology innovation spillover network should be constructed to accelerate the circulation of digital technology innovation outcomes. The government should enhance regional cooperation and coordination and encourage neighboring cities to establish digital innovation technology cooperation mechanisms. Regions lagging behind in digital technology innovation should foster an innovation-friendly environment, mobilize market forces, and enhance regional and industry cooperation. The demonstration effect of digital technology innovation should be leveraged to enhance inter-city linkages and promote sustainable urban development. For example, digital industrial parks should be established and green technologies should be shared to optimize resources and facilitate technology sharing.
Fourth, the government should fully leverage the marginal effects of digital technology innovation and provide policy support for its development. As digital technology innovation progresses, the government should enhance oversight to ensure alignment with sustainable development goals. It should direct enterprises to allocate resources efficiently and reduce excessive dependence on natural resources. It should also incentivize R&D investments, foster digital technology innovation, mitigate diminishing marginal effects, and offer strong support for sustainable urban development.
Future research directionsThis study evaluated urban CE development from a novel perspective encompassing production systems, living systems, development momentum, and development benefits; reconstructed an innovation-driven development evaluation system; and empirically investigated the influence of digital technology innovation on urban CE development. However, the study also has some limitations. First, it used city-level panel data from China, which may not capture the diverse impacts of national characteristics. Future research should explore the generalizability of these findings to other developed and developing countries. Second, this research focused on the effects of digital technology innovation on CE development and the mechanisms driving these impacts (e.g., ECI and ISU). However, other mechanisms may also be at play. Future research should further explore these additional pathways. Third, we concentrated exclusively on how urban digital technology innovation affects CE development, with minimal examination from an enterprise-level standpoint. Future research should broaden its focus to incorporate the enterprise dimension and thoroughly investigate the inherent development and patterns of digital technology innovation. By exploring the relationship between digital technology innovation and enterprise-level CE development in depth, future research can derive more detailed and comprehensive conclusions.
CRediT authorship contribution statementJinhui Zheng: Writing – original draft, Methodology, Formal analysis, Data curation. Meiyu Guo: Writing – review & editing, Writing – original draft, Conceptualization. Kevin Lo: Writing – review & editing, Supervision, Investigation.
This research is supported by the Philosophy and Social Sciences Project of Zhejiang Province, China (No. 23YJZX21YB), the Social Science Association Project of Zhejiang Province, China (No. 2025N086), the General Research Fund (No. 12616222) and Early Career Scheme (No. 22611624) of Hong Kong Research Grants Council, and the Guangdong Natural Science Fund (No. 2025A1515010017).
First, we defined the geographical distance matrix as Eq. (A1). In this matrix, Dijσ represents the straight-line distance between cities i and j, geographic centers of gravity. σ denotes the attenuation index, which is commonly set to 2.
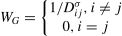
Second, we used the inverse of the absolute magnitude of the two cities’ differences in per capita GDP to construct an economic distance matrix, as shown in Eq. (A2), where GDPi‾ refers to the city’s average per capita GDP value between 2011 and 2022.

Finally, there may be bias in the type of distance if only geographic or economic distance is analyzed. To more comprehensively consider the dual effects of geographic and economic distance, we constructed a nested matrix of economic geography, as shown in Eq. (A3).
where α= 0.5.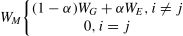
We used the EW-TOPSIS model to evaluate the CE level of cities. Each indicator was standardized by mathematical transformation and the indicators were divided into positive and negative indicators, with the inter-group range method used for processing. Formula (B1) shows the standardization procedure for positive indicators, and formula (B2) shows the standardization procedure for negative indicators.


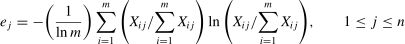
The information entropy value for the jth metric is calculated as follows:
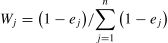
The weight of the jth indicator is calculated as follows:
The overall evaluation level for the ith city is calculated as follows:

Eq. (C1) is Moran’s I formula. S2 represents the variance of x.
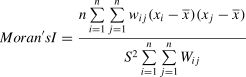
The value of Moran’s I index ranges from −1 to 1. An index value greater than 0 indicates positive spatial correlation, a value less than 0 indicates negative spatial correlation, and a value of 0 indicates no spatial correlation.