


This study examines the relationship between environmental innovation and firm valuation between 2019 and 2023, within a broader framework that includes governance and macroeconomic variables. This study employs Bayesian model averaging and random forest methodologies to analyse how environmental innovation impacts the market value of European companies in the industrial and information technology (IT) sectors, taking into account firms’ existing performance levels. The findings reveal significant differences in the factors driving valuation in the two sectors: environmental product scores positively influence market value for overvalued industrial companies, and profitability is the primary determinant of value for IT firms. There are distinct patterns between overvalued and undervalued companies in both sectors. Financial leverage and governance quality are more important for undervalued firms in the industrial sector; market risk plays a bigger role for their counterparts in the IT sector. Environmental variables are only moderately important determinants of value when compared to financial metrics, but their influence varies by firm sector and performance. These results empirically demonstrate that the relationship between environmental innovation and financial value is highly context-dependent. For corporate managers, the findings suggest that a sector-specific and performance-targeted approach to environmental innovation is required. For policymakers, they suggest regulatory frameworks should be tailored to economic sectors and support environmental innovation by firms in the short run before expecting long-term benefits.
Corporate finance shapes firms’ strategic decisions and is crucial given its significant impact on the economy and society in general. A company’s financial performance is closely linked to its ability to adapt to market demands, respond to regulatory pressures, and address environmental and societal challenges. Assessing corporate value and ensuring sustainable development requires that corporate behavior be analyzed through financial indicators and economic models.
The imperative to integrate environmental sustainability into financial objectives has ignited interest in the link between environmental innovation and firm performance. Recent research has revealed a positive relationship between eco-innovation and corporate performance, with company size amplifying the relationship (Mansour et al., 2024). The authors built their analysis on the Porter hypothesis that well-designed environmental regulations can improve competitiveness by encouraging innovation that balances out compliance costs. There is also emerging evidence that innovation in pollution prevention is positively associated with financial and environmental performance, an impact channeled through improved sales and cost efficiency; however, technologies designed to control pollution have a less significant effect (Cheng et al., 2024). The literature suggests that firm characteristics have a substantial influence on the relationship between environmental innovation and performance. Larger firms benefit more from regulation-driven environmental innovation while smaller firms gain an advantage from customer-driven environmental initiatives (Andries & Stephan, 2019).
Our research extends the literature by examining how environmental innovation impacts the financial performance and market valuation of European companies in two economic sectors: Industrials and Information technology (IT). We have employed Tobin’s Q, a widely used financial ratio first introduced by Tobin (1969) that divides the market value of a company’s assets to their replacement cost. A Tobin’s Q that is higher than one shows that the market value placed on the company’s assets exceeds their replacement cost. A value below one implies that the market undervalues the company’s assets.
In our case, we explored the impact of companies’ macroeconomic, financial, governmental, and environmental scores on their Tobin’s Q; the results are compared between and within the industrial and IT sectors. The impact of governance, environmental, and macroeconomic factors on Tobin’s Q and financial performance at the company level has been widely studied (Aybars et al., 2019). Higher environmental scores and better performance are generally associated with improved company value (Tobin’s Q) and, in many cases, better financial performance; however, the effects can vary by context, firm size, and ESG dimension.
There is a generally positive relationship between strong corporate environmental performance and financial performance (Manrique & Martí‐Ballester, 2017; Abgineh et al., 2023; Li et al., 2025; Jiaman et al., 2025). This relationship may be mixed or vary based on the time horizon or the existence of environmental protocols; according to the neoclassical school, the latter may impose additional costs (Palmer et al., 1995) and reduce production (Horváthová, 2010; Earnhart, 2018; Hang et al., 2018). Several studies (Moneva & Ortas, 2010; Manrique & Martí‐Ballester, 2017; Rahat & Nguyen, 2024) have found a significant positive relationship between environmental performance and financial performance, suggesting that companies with strong environmental practices achieve better financial results. Bătae et al. (2021) found that improving the environmental responsibility of the banking and financial services sector is linked to higher operating performance.
Others have identified a nonlinear U-shaped or inverse U-shaped relationship (Trumpp & Guenther, 2017; Zhang et al., 2020), suggesting that companies with poor environmental performance experience adverse financial effects, while those with superior environmental performance experience positive financial outcomes. However, excessive investment in environmental initiatives may eventually reduce financial returns, especially where environmental uncertainty is high. Ai et al. (2024) suggested that there might be a U-shaped relationship between green innovation and corporate financial performance. At certain levels, green innovation may negatively impact financial performance before becoming beneficial, mainly due to risk accumulation.
The relationship between environmental innovation and financial performance has recently begun to attract attention in the literature and is reflected in industry practices. Environmental innovation refers to a company’s capacity to develop and implement technologies, processes, or products that reduce environmental impacts and create new market opportunities through eco-design and sustainable solutions (Ozusaglam, 2012). Building the capacity to engage in solid environmental innovation is expected to foster efficiency, reduce costs, and improve the company’s position in the market (Tseng et al., 2019). Similarly, Lopes and Basso (2024) found that eco-innovation becomes crucial for fostering firms’ operational performance.
Zheng and Iatridis (2022) conducted a meta-analysis of studies addressing the relationship between eco-innovation and financial performance, noting the different types of eco-innovation and measures of financial performance employed. The authors identified a generally positive relationship between eco-innovation and firm performance; however, this relationship is not always linear. In addition, Zheng and Iatridis (2022) observed a moderating effect and noted that the positive impact of eco-innovation on firm performance varied by sector. Specifically, firms in the Industrials sector experienced the most significant economic, environmental, and operational improvements from eco-innovation; service firms experienced enhanced social performance. In their meta-analysis, Hizarci-Payne et al. (2021) showed that advanced organizational eco-innovation exerted the strongest influence on firm performance. The authors suggested that the correlation between eco-innovation and firm performance varies significantly, depending on the measures of firm performance used, and that the size of this association differs between developing and developed countries.
Regarding the relationship between the macroeconomic variables and corporate performance, macroeconomic stability and growth have been found to improve financial outcomes and support environmental investment (Solaymani & Montes, 2024). The relationship is dynamic, context-dependent, and moderated by industry competition, corporate governance, and economic development. GDP growth, interest rates, inflation, and unemployment significantly influence corporate performance, shaping profitability, strategic decisions, and market confidence. Fluctuations in these variables can create opportunities and risks for firms, and managers must filter out “volatility” to assess the company’s intrinsic competitiveness and sustainable profits (Oxelheim, 2003; Lakra, 2024). For instance, in their study of Chinese nonfinancial companies, Yang and Chen (2022) found that macroeconomic conditions based on economic growth and financial development can positively impact companies’ allocation of financial assets. Similarly, Fajri et al. (2024) found that economic growth positively impacts corporate financial performance in ASEAN countries; the authors found that inflation can positively impact return on assets but does not significantly impact market capitalization.
Concerning the association between government effectiveness, stability, and corporate financial performance, the literature indicates that the regulatory environment can shape the financial performance of corporations (Moneva & Ortas, 2010), particularly those in the financial sector. Effective governance and stable government policies are linked to improved financial stability and performance. More specifically, high-quality governance, which includes effective government policies and regulatory frameworks, positively influences financial stability and, in turn, improves performance (Pillai & Al-Malkawi, 2017; Malik et al., 2021). Improving corruption control at the national level has been shown to have a significant and positive impact on the financial performance and market value of companies in Latin America (Junior et al., 2024). Empirical analysis has also shown that guaranteeing the rule of law partially controls corruption and, by extension, improves financial performance (Hongdao et al., 2018; Ali & Khan, 2022; Mohd‐Rashid et al., 2022).
This study makes several significant contributions to the literature on environmental innovation and financial performance. First, it combines two complementary approaches, Bayesian model averaging (BMA) and random forests (RFs), to allow for probabilistic selection of variables and to capture nonlinear relationships between environmental innovation and financial performance (proxied by Tobin’s Q) that may have been missed by traditional econometric approaches. Second, it offers insights into the differences between two key economic sectors for European countries: Industrials and IT. The study identifies common grounds for valuation in these sectors but also differences in how environmental innovations impact performance. Third, based on Tobin’s Q, we have distinguished between overvalued (Q > 1) and undervalued (TBQ < 1) firms. In doing so, we uncover the role of environmental innovation in investors’ existing perceptions of company value. Fourth, the analysis covers the period from 2019 to 2023 and thus captures investor priorities immediately after the signing of the Paris Agreement and during and following the COVID-19 pandemic. Finally, we consider how governance quality interacts and compares with environmental innovation in influencing firm valuations in the two sectors and at different levels of performance.
Methodology and dataOur sample, selected from LSEG-Refinitiv, comprised listed companies with headquarters in a European country and with an ESG score for 2023. This ensured that only companies with measurable ESG performance data were considered, supporting the robust achievement of the research objective. The data were collected for the years 2019 to 2023. The final sample comprised 810 companies, of which 565 were from the Industrials sector and 245 from the IT sector. We limited the investigation to these sectors because of their high exposure to the risks of climate change and environment-related liabilities and because they have made efforts to mitigate their impact through environmental innovation (Alola & Rahko, 2024; Dwivedi et al., 2021).
The companies in the sample had headquarters in 25 European jurisdictions, 23 in the Industrials sector, and 20 in the IT sector. The countries most represented in the sample were the United Kingdom (160 companies, 19.75 %), Sweden (128 companies, 15.8 %), and Germany (125 companies, 15.43 %). The companies were distributed across industries within the two sectors. Fourteen industries were represented in the Industrials sector: machinery (136 companies) and construction and engineering (63 companies). Six industries were represented in the IT sector, with most in software and electronic equipment (68 companies)and instruments & components (63 companies). We used the GICS classification of sectors and industries.
Our research goal was to identify the importance of firms’ environmental commitment and, in particular, their environmental innovation in driving their market valuation. The framework for analysis took account of proper governance and macroeconomic constraints. We built our approach based on two methodologies. First, we addressed model uncertainty using BMA, which helped us identify the variables that are most present in the Tobin’s Q prediction models. Second, we employed RFs, which is an unsupervised machine-learning methodology that ranks variables and shows their relevant importance in explaining Tobin’s Q.
The approaches are complementary. BMA provides a probabilistic framework for variable selection when multiple model specifications are being considered. RFs can capture nonlinear relationships and interactions between variables that might be ignored in linear parametric models. Combining these methods allowed us to detect the robust determinants of Tobin’s Q and gain an understanding of the complex interplay between variables that might be more difficult to recognize using traditional econometric approaches. These complementary methodological directions strengthen the validity of our findings regarding the most important drivers of the variation in Tobin’s Q in our sample.
Model averaging (Leamer, 1978) is a statistical method to address model uncertainty. BMA mitigates uncertainty about the predictors that should be included. It can be used for inference, prediction, or model selection. Inferences may be made about models from posterior model probabilities, the importance of posterior inclusion probabilities (PIPs) as predictors, and regression coefficients from their posterior distributions. With BMA, predictors can be included as a group, and there are multiple methods of handling interaction terms. It also accommodates various priors for models and regression coefficients. The BMA estimate of β is:
where β^BMA is the coefficient estimate for a specific variable, calculated as the weighted average of coefficient estimates across all models; P designates potential explanatory variables, and j is the number of models (there are 2P possible model combinations with each variable either included or excluded); M is the model, and P(MJ|D) is the posterior probability of model MJ given the data, D. In the BMA, the latter represents the weight allocated to each model based on how well it fits the data, and incorporates likelihood and prior model probabilities; models with higher posterior probabilities contribute more to the final estimate of the coefficient. Finally, β^MJ is the coefficient estimate for a specific variable in Model MJ; if the variable were not included, its coefficient for the model was recorded as zero.
Our investigation of the factors affecting Tobin’s Q followed a multivariate approach that integrated candidate variables. The selection of variables for inclusion in the BMA process was based on a critical review of the literature. The dependent variable is the firm’s Tobin’s Q value. Table 1 presents the explanatory-variable candidates, their definitions, measures, and data sources.
Candidate variables.
The variables included were then grouped. First, we referred to environmentally-related performance that showed the company’s environmental commitment either at an aggregate level (ENV) or a disaggregated level (EIS, EPS, EMT). In the second set, we included GOV as a measure of companies’ governance mechanisms and a macro-level variable that reflected the commitment to the rule of law (RL) of the country in which the company was headquartered. The literature shows that this commitment creates an environment in which corporate governance mechanisms can function properly and effectively. For example, Bhagat and Hubbard (2022) have shown that compliance with the rule of law ensures enforcement of contracts, property rights, and corporate regulations. Chen and Yang (2017) argued that respect for the rule of law makes it easier for firms to manage resources efficiently and pursue growth opportunities by successfully aligning the interests of managers and shareholders.
Third, we included a package of financial variables as moderators of the relationship between Tobin’s Q and environmental and sustainability-related factors that reflect different areas of corporate performance: liquidity (CR), solvency (TDCE), efficiency (TAT), profitability (EBITDAM), and market risk (BETA). This is common practice in the financial performance literature, including in empirical studies (Dasilas & Karanović, 2025; Makpotche et al., 2024). Fourth, the real (inflation-adjusted) risk-free rate (RF) was included to capture the general economic and market conditions in the countries in which the companies were headquartered.
Once the variables were shown to establish a long-run equilibrium relationship, the RF methodology was employed for predictive modeling. This methodology was proposed by Breiman (2001) based on its versatility and robustness to multicollinearity, as well as its ability to capture complex nonlinear relationships among variables without explicitly specifying those. RF models can handle high-dimensional data and account for potential interaction effects between variables without requiring a manual identification of these effects. Additionally, RFs provide a measure of variables’ importance that is not impacted by their scale and unit of measurement. This produces an objective ranking of predictors that complements the BMA probability-based findings. Moreover, since RFs are based on ensemble modeling, which aggregates predictions from many decision trees, it helps alleviate overfitting and produces more stable results than single-tree methods, such as C&RT or CHAID models; see, in this respect, the insightful works of Fratello and Tagliaferri (2018), Ziegler and König (2014), or Genuer and Poggi (2020).
The use of RF algorithms has intensified in recent financial studies, in recognition of their solid predictive performance (Kumbure et al., 2022). Scholars have applied RFs to investigate corporate profitability (Almaskati, 2022; Horobet et al., 2023), sovereign default risk (Belly et al., 2023), bank failures (Rustam & Saragih, 2018), the evolution of stock prices (Meher et al., 2024), inflation (Mirza et al., 2024), competitiveness, and foreign direct investments (Horobet et al., 2021). In this strong line of financial research that incorporates RFs, there is an emerging trend of using these and other machine-learning models to predict or incorporate ESG scores and their components in stock valuation.
For example, D’Amato et al. (2022) examined the relationship between structural financial elements and ESG performance metrics provided by Thomson Reuters Refinitiv for corporations included in the STOXX 600 Index. The authors found that information from financial statements, and in particular from the balance sheet, was a significant factor for understanding and interpreting the ESG ratings for these companies. Relatedly, Chowdury et al. (2023) explored over 6000 firms across 73 countries and showed that the RF classifier most accurately predicts ESG ratings (78.5 % accuracy), with historical ESG scores, firm size, and debt-to-equity ratio the most influential predictors. Martin-Cervantes and Valls Martínez (2023) studied the relevance of ESG scores for betas and unveiled that ESG scores are the main determinant of the value and sign of betas for stocks in the S&P 500 index between 2015 and 2019.
We applied the RF algorithm for each year in the sample period to investigate the evolution of variables’ predictive importance over the period (including that following the adoption of the Paris Agreement and including the Covid-19 pandemic) and the stability of this predictive importance over time. We were especially interested in the interaction between environmental innovation variables (ESI, EPS, supported by management and encapsulated in EMT) and governance quality (GOV), as well as the trends in this importance over time. Additionally, we explored the difference in importance of environmental, governance, and financial variables over time and across the sectors investigated. To this end, in addition to implementing RF models that included EIS as the main environmental innovation variable, we performed robustness checks by substituting EIS with EPS and then ENV. As in the BMA analysis, the RF implementation measured the variable importance (VI) for all companies and differentiated between companies with a Tobin’s Q higher than and lower than one, thereby incorporating investors’ assessments of corporate value. All remaining variables presented in Table 1 were included in the RF analysis.
For each year in our sample period (2019–2023), we calculated the VI score, which takes a value between 0 and 1, higher values indicating a stronger predictive power for Tobin’s Q. This normalization of VI is also suitable for assessing importance across models. All variables were continuous and were winsorized and further normalized. One-third of observations were utilized for model training, and 50 % of the data were reserved for validation (test) purposes. For each implementation of the RF algorithm, we began with 500 trees and imposed a percentage decrease in training error of 3 % for cycles of 10 trees.
Empirical resultsDescriptive resultsThis section presents the variables included in the statistical and econometric analyses determining Tobin Q. The goal of determining the candidate variables was explained above. Table 2 displays the main descriptive statistics for the variables of interest.
Descriptive results.
The Tobin’s Q mean was 2.1 with a relatively high standard deviation of 2.7, indicating considerable variation across companies. Regarding the environmental and sustainability-related variables, there were approximately 3500 observations for EIS, GOV, ENV, SOC, EMT, and EPS with average values ranging from 31.9 (EIS) to 52.997 (SOC), suggesting firms’ moderate performance in ESG-related dimensions. The mean value for TURN was approximately 5.84 million, and the standard deviation was considerable (21.6 million), with a maximum of nearly 591 million, indicating strong skewness and the presence of very large firms in the sample. RL and CR had average values of 1.416 and 1.985, respectively. The variable TDCE had a large maximum value (638.938) and a mean of 1.313, suggesting the influence of outliers. EBITDAM had a negative mean (−10.726) and a high standard deviation (436.259), indicating wide fluctuations in profitability across firms. The average for TAT was 0.937, with a modest spread, while BETA had a mean of 1.148, with values ranging from −3.224 to 8.539, reflecting heterogeneity in market risk exposure. Finally, RF shows minimal variation, with a mean of 0.029 and a standard deviation of 0.022.
BMA and model specification findingsThe importance of the candidate explanatory variables was estimated next, as explained in the methodology section. Table 3 presents the summary results of the BMA model, and Fig. 1 provides a visual representation of the findings to enhance clarity and understanding.

The high PIP for EPS, TURN, and RF confirms their robustness across multiple model specifications and that they have a central role in shaping industry-level outcomes. Concerning the sign, while EPS positively contributed to the model, the negative coefficient of RF highlights the adverse effect of risk rates or preferences on the financial score. Despite its minimal coefficient, TURN appears systematically across all models, suggesting its fundamental relevance in explaining company-level performance. EMT and EIS appeared in lower-ranked models but still exhibited high PIP values (0.983 and 0.943, respectively), indicating a potentially important influence. The negative impact of both variables suggests possible complexities in translating environmental innovation and management tools into measurable performance benefits. For instance, companies that devoted more resources to environmental performance and innovation might have fewer resources to allocate to corporate and financial performance.
It is also important to note that the impact of investments in management and innovation may be delayed (Jo et al., 2014). They may also be a financial burden in the year they are made and could impact financial sustainability in the short term. These findings suggest that policy frameworks should prioritize conventional financial indicators and account for institutional capacity and innovation readiness when designing sustainable industrial strategies. The variable-inclusion map is a visual complement to the BMA results presented in Table 3, illustrating the consistency and direction of each predictor’s influence across the top 42 visited models.
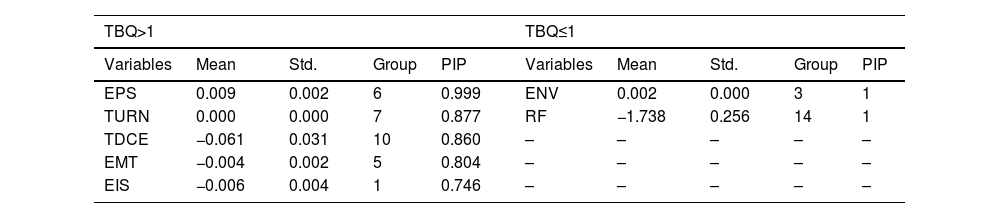
We then differentiated between companies in the Industrials sector based on whether their Tobin’s Q was higher or lower than one. These results are presented in Table 4 and Figs. 2A and 2B
.")
.")
Among companies in the Industrials sector with a Tobin’s Q higher than 1, EPS emerged as the most robust predictor (PIP = 0.999), followed by TURN (PIP = 0.877), TDCE (PIP = 0.860), EMT (PIP = 0.804), and EIS (PIP = 0.746). The positive sign of EPS indicates that the strength of the environmental product score plays a substantial role in performance for overvalued companies. At the same time, the negative coefficients on TDCE, EMT, and EIS suggest that debt levels and specific environmental management and innovation strategies may negatively impact value for firms in this group.
In contrast, for companies with a Tobin’s Q <1, the only variables with meaningful inclusion are ENV and RF, with PIP equal to 1. Notably, ENV shows a small but consistently positive effect, while RF exerts a strong and negative influence, potentially indicating that more risk-averse financial environments disproportionately affect lower-growth firms in the Industrials sector. The variable-inclusion maps in Figs. 2A and 2B reinforce these findings, visually confirming the divergence in relevant predictors between the two subgroups.
We then analyzed the possible factors determining Tobin’s Q within companies in the IT sector. The BMA results for the overall sample and the subsamples of firms with TBQ > 1 and TBQ ≤ 1 are presented in Tables 5 and 6, respectively. Across the full IT sample, RF stood out (PIP = 1) with a substantial negative coefficient (−30.673), indicating that macro risk was a strong and consistent determinant of financial scores in the IT sector. Moreover, although its coefficient was negligible, TURN also showed robust inclusion (PIP = 0.944), suggesting that scale and revenue remained relevant but not necessarily directional.
When differentiating between companies by valuation, for overvalued IT firms (TBQ > 1), RF remained a dominant factor (PIP = 1), as did CR, which had a positive and highly significant effect (coefficient = 0.397, PIP = 0.997) – see Table 6; these results point to the importance of macroeconomic conditions and government effectiveness for market confidence. TURN appeared moderately important (PIP = 0.805), reinforcing its general relevance in the sector. By contrast, for undervalued IT companies (TBQ ≤ 1), RF remained influential (PIP = 0.890), albeit with a smaller magnitude. No other variables met the inclusion threshold, suggesting that financial conditions play a dominant role in shaping valuations where growth expectations are limited. These findings emphasize that in the IT sector, particularly for companies with strong growth potential, firm value is closely tied to macro-financial conditions, underlining the need for targeted financial management strategies and macroeconomic awareness.
Random forests results
.")
.")
This section presents the main findings of the RF implementation, focusing on three main directions: (1) the evolution of VI between 2019 and 2023, distinguishing between the results for all companies in each sector, the companies with Tobin’s Q higher than 1, and those for which it is lower than or equal to 1; (2) the stability of VI over time; and (3) the differences in VI between variables representing environmental innovation and governance and traditional financial variables. Appendix Tables A-1 and A-2 show the VI for all models and years for the Industrials and IT sectors, respectively.
Variable importance over timeThe VI was obtained by applying the Model 1 in the RF algorithm to all companies in the Industrials sector, as represented in Fig. 4A, and then for companies for which Tobin’s Q was higher than and lower than one, as represented in Fig. 4B When all companies in the Industrials sector were considered, TURN was consistently the most important (VI ≈ 1.0) throughout the period. Company size was thus the dominant predictor of Tobin’s Q in this sector. The second and third most important predictors of Tobin’s Q in the sector were TDCE and CR, although these exhibited significant volatility over time. These peaked in 2021 and 2022, suggesting their decreasing relevance until 2023. The variables EIS and EMT maintained a relatively low level of importance over the period compared to financial variables, although EIS showed modest growth through 2021 (the peak year for EIS and EMT) before slightly declining in 2022 and 2023. Of the two variables from the macro spectrum, RL was more important than RF in all years (going from 0.530 in 2019 to 0.569 in 2023 and peaking at 0.612 in 2021); this was consistent with the significant increase in the VI of GOV from 0.277 in 2019 to 0.514 in 2023.
.")
.")
Fig. 4B represents the important VI differences for companies in the Industrials sector based on their Tobin’s Q values. For overvalued firms (TBQ > 1), EBITDAM, CR, and TDCE were the key predictors of Tobin’s Q, while company size (TURN) had a moderate to high VI, but this declined over time. This suggests that investors prioritized profitability, liquidity, and financial structure for companies that were already valuable. For undervalued firms (TBQ ≤ 1), the same variables were the most important for predicting Tobin’s Q; however, their VI was more volatile over time. This may indicate a change in the focus of investors over time. At the same time, GOV showed a consistent increase from 2019 to 2023, suggesting that the governance factor rose in importance over time.
Another interesting result was the importance of EIS and EMT for undervalued companies: in addition to their growth pattern over the period being different, their VI was higher in 2023 than for overvalued companies, while being constantly lower in the previous years. The increasing importance of EIS and EMT may position them as value drivers for companies that are attempting to improve their market position, but may also signal potential greenwashing, with undervalued companies stressing their commitment to environmental innovation as a lever of value.
The results for Model 2 for all companies in the Industrials sector are presented in Fig. 5A. The key variables identified in Model 1 (TURN, EBITDAM, CR, and TDCE) were confirmed. However, CR and TDCE showed a nonlinear pattern, peaking in 2021 and 2022 and then drastically diminishing in importance in 2023. Other variables, GOV, TAT, and EMT, exhibited a similar pattern. However, EPS had consistently lower predictive power than EIS over the period, signaling that investors paid attention to the entire range of environmental innovation and not only to environmental products. The evolution of GOV was similar to that in Model 1, but the value of VI was lower. This may suggest that investors associate governance with environmental innovation to a higher degree than for environmental products offered to customers by the companies in the Industrials sector.
.")
Comparing the VI for overvalued firms (TBQ > 1) and undervalued firms (TBQ ≤ 1) in the Industrials sector revealed by Model 2 and illustrated in Fig. 5B, we see distinct patterns in the drivers of company value in these two categories. For overvalued companies, liquidity (CR) and profitability (EBITDAM) maintained the highest level of importance (near or at 1) between 2019 and 2023, suggesting that for these companies, investors primarily valued operational efficiency and short-term financial health. For undervalued firms, by contrast, financial leverage (TDCE) was the dominant factor between 2020 and 2023. Other financial drivers––BETA, CR, EBITDAM––displayed a nonlinear trend over time (peaking in 2021 or 2022 and then declining in importance in 2023). Notably, market risk (BETA) was consistently more important for undervalued than for overvalued companies, suggesting that investors increased their scrutiny of risk for these firms.
.")
Notably, governance scores (GOV) were considerably more important for undervalued firms (0.640 in 2023 versus 0.290 for overvalued firms), indicating that improved corporate governance may be a critical approach for the former companies to rise in market perception. Environmental variables (EPS, EMT) show rather similar importance for both categories of firms, but lower than VI for financial indicators, thus confirming the results of Model 1. Another interesting finding refers to turnover (TURN): while its VI declined from 2020 to 2023 for overvalued companies, it remained more important over time for undervalued firms, which suggests that size had greater explanatory power for valuation in underperforming firms than in overperforming ones.
The results for Model 3 are shown in Fig. 6A for all firms in thendustrials sector and in Fig. 6B, which compares overvalued and undervalued firms. Model 3 did not explicitly consider any environmental-innovation variables; these were replaced with the environmental score (ENV) that included ESI and EPS, but also refers to other environmental concerns and commitments. When all companies were considered, EBITDAM showed a consistent maximum VI (1.00) in almost all years, indicating that profitability remained the primary driver of firm value in the sector in both turbulent and normal economic conditions. Similarly, liquidity (CR) had a high VI, peaking in 2022 with a maximum VI of 1.00, suggesting the heightened relevance for investors of strong short-term financial health. Financial leverage (TDCE) also showed a high VI, peaking at 0.899 in 2021, similar to that for asset turnover (TAT), although it fluctuated considerably over time. Additionally, company size (TURN) exhibited a positive trend from 2019 to 2023, from 0.429 in 2019 to 0.761 in 2023, indicating that larger firms in the Industrials sector were more attractive for investors than smaller firms. Market risk (BETA) had a declining VI over time (from 0.564 in 2020 to 0.383 in 2023), potentially signaling a lowering of investor concerns regarding systematic risk in the post-pandemic period, coupled with increasing VI for other factors.
.")
.")
Environmental (ENV) and governance (GOV) scores were moderately important, in the range of 0.3 to 0.5, between 2019 and 2023. Two observations are important here. First, their VI is generally below that for financial variables, suggesting that ESG considerations are considered supplementary to financial metrics in valuations in the Industrials sector. Second, both ENV and GOV showed year-to-year variation, which implies that their importance changed over time, depending on the agenda of investors and evolving sustainability challenges and societal priorities.
As for Models 1 and 2, Fig. 6B reveals important differences in VI between over- and undervalued industrial companies. For overvalued firms, profitability (EBITDAM) and liquidity (CR) were the most important over time, suggesting that investors reward successful companies’ operational efficiency and solid management of short-term liabilities. In contrast, financial leverage (TDCE) was the dominant variable for undervalued firms (it had the maximum VI of 1.00 in three out of five years), confirming the high relevance of debt management for underperforming companies in terms of market value. Interestingly, environmental factors (ENV) showed a consistently higher VI for undervalued firms, particularly in 2023 (0.582 versus 0.346). This reinforces the results in Models 1 and 2 and suggests a greater marginal value of sustainability initiatives for underperforming companies, possibly associated with greenwashing.
As in Model 2, governance (GOV) had a substantially higher and growing VI in the sample of undervalued firms, indicating that struggling companies should recognize the importance of improved corporate governance for a higher valuation. Inversely, market risk (BETA) was unimportant for overvalued firms but exhibited a much higher VI for undervalued companies (reaching 0.790 in 2023). This validates the results of the previous two models and indicates the greater sensitivity of investors to systematic risk when valuing underperforming firms. Together, these rather divergent patterns within the Industrials sector reveal a distinct set of factors in the valuation framework for overvalued industrial firms, which is dominated by traditional financial variables. By contrast, for underperforming companies, governance, environmental commitment, and risk play an increasingly important role in market valuation.
Next, we considered the IT sector. Fig. 7A presents the evolution of VI resulting from Model 1 for all companies in the sector, and Fig. 7B presents VI for over- and undervalued firms. By far, the most striking result depicted in Fig. 7A is the maximum VI of EBITDAM in all five years included in the analysis, positioning profitability as the dominant and consistent determinant of firm valuation in the IT sector. This result suggests that investors in technology companies prioritize their earnings potential before and above all other factors. Company size (TURN) shows a high VI over time, although declining from 0.931 in 2019 to a more moderate level of 0.570 by 2023. Liquidity (CR) and operational efficiency (TAT) displayed similar patterns to TURN, both having a high VI in 2019 and 2020 before dropping significantly thereafter. These findings might indicate that investors’ focus had shifted from size, liquidity, and efficiency of asset use to other performance metrics for an IT sector that is maturing.
.")
.")
Governance (GOV) exhibited moderate importance over the period but did fluctuate. The peak VI is in 2020 (0.573) and reaches 0.543 in 2023, indicating the constant but periodic attention of investors to corporate governance issues. Environmental variables (EIS and EMT) were less important than financial variables in all years included in the analysis, although the VI for EMT increased more than two times from 0.183 in 2019 to 0.403 in 2020. This suggests that commitment to environmental innovation was considered an important valuation factor for firms in the IT sector, although it remained secondary to financial performance.
The differences in VI between the over- and undervalued firms in the IT sector revealed by Fig. 7B are more pronounced than in the Industrials sector. For companies with Tobin’s Q greater than 1, profitability dominated the VI spectrum since 2020, showing consistent maximum values. This indicates that earnings potential is the top metric for successful technology companies that are recognized as such by market investors. At the same time, undervalued IT companies saw their valuation highly determined by financial leverage (TDCE) in 2022 and 2023 (the RF algorithm could not be applied to these firms before 2021 due to the low number of companies in the sample). This suggests that debt structure shapes market perceptions in the case of undervalued tech companies. That market-risk sensitivity (BETA) was more important for undervalued firms also indicates that risks, in this case market risks, were more carefully scrutinized by investors in these companies than in their overvalued counterparts. Notably, company size (TURN) maintained a high VI for undervalued IT firms; the difference from highly-valued firms was particularly striking in 202, 0.873 versus 0.360, suggesting that economies of scale are important for these firms in terms of their valuation potential.
By contrast to the Industrials sector, environmental innovation (EIS) and environmental management (EMT) showed a higher VI for overvalued firms in all years except 2023, but these were still moderate to low. This finding suggests that environmental innovation, supported by proper management of environmental strategies, reinforced the valuation of overvalued firms over time, and undervalued firms have turned to them more recently to build value. Social factors (SOC) similarly gained importance for underperforming firms by 2023 (0.518 versus 0.395 for high-TBQ companies), indicating another potential lever for improved market valuation. However, governance quality (GOV) favored overvalued firms in all years.
The results of Model 2 for all European companies in the IT sector are shown in Fig. 8A, validating the findings of Model 1. Profitability (EBITDAM) had the maximum VI (1.00) in all five years, confirming it as the single most important determinant of market value for IT firms. Company size (TURN) was also highly important over time, although it displayed a declining trend from 0.817 in 2019 to 0.509 in 2023. In a similar manner, liquidity (CR) had a dramatic decline in VI from 0.848 in 2019 to only 0.322 in 2023, indicating investors shifting away from good short-term financial management to other significant drivers of value. Financial leverage (TDCE) joined the previous variables in a declining pattern (0.622 in 2019 to 0.350 in 2023), while operational efficiency (TAT) had moderate importance throughout the period, although with fluctuations.
.")
Environmental innovation performance, proxied by EPS, and environmental management, proxied by EMT, were less important than financial variables, alongside governance (GOV), despite the modest increase in VI for EMT from 2019. Social factors (SOC) demonstrated declining VI over time (0.499 to 0.394).
The results shown in Fig. 8B reveal different valuation factors for over- and undervalued European IT companies. For overvalued firms, profitability (EBITDAM) remained the most important variable (VI = 1.00) in all years, suggesting that investors consistently factored in the profit potential and good cost management of these tech companies. However, for undervalued IT firms, the dominance of profitability in 2021 left room for financial leverage (TDCE) as the main determinant of Tobin’s Q in 2022 to 2023, indicating an increased concern for risk management in more recent years for undervalued IT companies.
. This table presents variable importance scores for predicting Tobin's Q for European IT companies from 2019–2023, showing similar patterns to previous tables but with some notable differences.")
In the same vein, market risk (BETA) had a higher VI for undervalued IT firms in 2021 and 2022, although in 2023, VI reached only a moderate level (0.311). While governance (GOV) was clearly, albeit moderately, important for overperforming IT firms over time, social factors (SOC) displayed higher VI for undervalued firms toward the end of the sample period in 2023, suggesting the latter as a potential path for improved valuation. The attention to risk management for undervalued companies was indirectly suggested by the declining importance of company size (TURN) by 2023 (0.772 versus 0.166 in 2021). For EPS, as a proxy of environmental innovation in Model 2, there were no significant differences between the two categories of companies, and the same was true for EMT. Moreover, VI values were moderate to low in all years, indicating that environmental considerations were still marginal to valuation regardless of the level of Tobin’s Q.
Profitability (EBITDAM) maintained maximum importance over the entire period for IT firms, as indicated by the results for Model 3 shown in Fig. 9A. These confirm the findings of the previous two models regarding profitability as the most important valuation factor for IT companies. Similarly, the importance of TDCE declined significantly from 2019 to 2023, suggesting a change in how investors viewed financial leverage in valuations in the IT sector. Liquidity (CR) showed an even abrupt decline in VI from 0.991 in 2019 to 0.301 in 2023, alongside company size (TURN), operational efficiency (TAT), and social factors (SOC), evidencing a pattern of VI. We interpret this as a fundamental change in the IT sector value drivers over time, where profitability remained paramount but traditional financial variables became progressively less instrumental in valuation. The environmental score (ENV) was moderately important over time and reached a maximum level of 0.527 in 2020.
.")
Fig. 9B shows differences between over- and undervalued IT firms for Model 3. While for overvalued companies, profitability (EBITDAM) was the most important factor over time, for undervalued companies, there was a considerable shift in valuation factors toward 2023. As such, market risk (BETA) was the most important valuation driver for undervalued firms from 2021 to 2022, but financial leverage (TDCE) took the lead in 2023. This suggests that investors were more concerned about debt structure than systemic risk in recent years. Environmental scores (ENV) had consistently higher VI for overvalued IT firms over the period (0.404 versus 0.296 in 2023), indicating that sustainability commitments tended to favor better performers more than undervalued companies. Similarly, governance (GOV) had higher VI for overvalued firms (0.509 versus 0.228 in 2023).
Variable importance stability.")
Another perspective on the evolution of VI for the environmental-innovation and governance variables as compared to traditional financial variables is offered by Fig. 10 for the Industrials sector and Fig. 11 for the IT sector. The mean, minimum, and maximum values were aggregated across all RF models that included these.


For all industrial companies (results in the top panel), EBITDAM (profitability) showed the highest mean importance (0.981) with minimal variation, supporting its consistent significance over time. CR (liquidity) and TURN (company size) also showed high mean importance (0.800 and 0.668, respectively) with rather moderate ranges. Similarly, TDCE (indebtedness) exhibited substantial importance (mean of 0.765), but its variation was wider, suggesting greater variation in its importance over time. A comparison of the two categories of firms based on the Tobin’s Q value (shown in the bottom panels) reveals several notable differences. For overvalued firms (left panel), EBITDAM had the highest mean VI with low variation across years and models, while CR displayed a slightly lower but still considerable mean VI. For undervalued firms (right panel), TDCE had the highest mean importance (0.902), exceeding that of CR (mean of 0.768) and EBITDAM (mean of 0.696), suggesting that financial risk management is essential for undervalued industrial companies.
The environmental innovation variables (EIS, EPS) consistently showed moderate to low mean importance for all categories of firms, although, other than EPS for undervalued firms, the variation of their VI tended to be less than that of traditional financial variables. EMT follows the same pattern. However, ENV had a higher mean VI than EIS, EPS, and EMT, and exhibited variation, suggesting that investors valued the entire spectrum of corporate environmental issues and commitments instead of considering each component of the environmental strategy separately.
As regards the two macro-level variables included in the analysis, Fig. 10 shows a moderate VI level for the rule of law (RL), with a mean of 0.562 for the full sample, 0.426 for overvalued firms, and 0.383 for undervalued firms. For all groups, variation was presented around the mean and was significantly higher for undervalued companies, which may suggest that while regulatory environments matter for valuation across companies, their importance does not significantly differ based on companies’ valuation status. Overall, RF exhibited a low mean VI compared to most financial variables, with values around 0.3 to 0.45 for all panels and years. However, there were noticeable differences in the importance of RF between the two valuation categories: for overvalued companies, RF shows a relatively consistent VI, while undervalued firms exhibit greater sensitivity to this indicator, as is also suggested by its larger range. We interpret this finding as pointing toward interest rates and macroeconomic conditions as more important variables for undervalued companies than overvalued ones, suggesting that macroeconomic prospects may be seen by investors as playing a more significant role for underperforming companies.
A similar picture is shown in Fig. 11 for European companies in the IT sector. For all companies (see top panel), profitability (EBITDAM) stands out with close to maximum mean VI and very low variation; this makes it, by far, the most important predictor of valuation in the sector. Unlike the industrial sector, other financial variables displayed more moderate importance. For example, company size (TURN), indebtedness (TDCE), and asset use efficiency (TAT) showed mean VI around 0.5 to 0.6, albeit with substantial ranges, possibly indicating an inconsistent relevance over the sample period. The environmental variables (EIS, EMT, EPS, ENV) exhibited a lower mean VI than financial variables and were accompanied by moderate variation, which suggests that while these factors were contributors to the valuation of IT firms, they were in second place to financial variables.
For overvalued firms in the European IT sector, profitability (EBITDAM) occupied a dominant position as a value driver, although its mean VI was slightly lower for these firms than for all companies; see the bottom left panel in Fig. 11. Interestingly, other variables showed a rather closer mean VI, ranging between 0.3 and 0.5, leading to a more balanced and moderate influence of other factors (other than profitability) for better valued IT companies. When undervalued IT companies were considered, financial leverage (TDCE) ranked first according to mean VI over models and years, followed by profitability (EBITDAM) and market risk (BETA), and they exhibited considerable variation. This signifies that the importance of these three financial variables should be understood in relation to other drivers of value for undervalued IT firms. For the remaining variables, including environmentally-related ones, the VI over time exhibited moderate to low levels, albeit with much less variation than the financial variables. We interpret this as signaling a clear place for these variables in valuations for undervalued IT firms, although their importance remained low.
Environmental innovation, governance and financial variablesFig. 12 provides a comparative analysis of mean VI between the Industrials and IT sectors for the entire sample period (2019–2023) and between undervalued and overvalued companies in the two groups. This figure allowed us to address the relative importance of our main variables of interest – EIS, EPS, EMT, and GOV – in relation to the financial drivers of Tobin’s Q.

For both sectors in our analysis, the mean VI of the environmental variables (EIS, EPS, EMT, ENV) had moderate to low values, in the range of 0.20 to 0.45. The mean VI was generally higher for the Industrials sector than the IT sector, which likely reflects greater investor scrutiny of environmental performance in traditional manufacturing and heavy industries, where the environmental impacts were more direct and visible than in the IT sector. Interestingly, for undervalued companies (TBQ ≤ 1) in the Industrials sector, environmental variables were of similar importance as for overvalued companies, indicating that investor attention to environmental innovation was consistent for the sector. At the same time, EIS and EMT had a slightly higher mean VI for overvalued companies, while the reverse was true for EPS and ENV. In the IT sector, the same general pattern was evident except that the mean VI was higher for overvalued firms than for all undervalued firms for all environmental variables.
Governance (GOV) had a mean VI in both sectors of around 0.4, signaling its moderate importance for predicting Tobin’s Q, except for the undervalued firms in the IT sector that have a mean VI of only 2.94. Overall, the mean VI for GOV was higher for the Industrials sector than for IT, but in both sectors the mean VI for GOV was consistently higher for overvalued than undervalued firms, indicating that strong governance is connected to greater valuation benefits, particularly in traditional manufacturing industries compared to technology industries. At the same time, the IT sector showed a more consistent mean VI for GOV across all categories of firms, pointing toward this as a less differentiating variable for valuation in the sector.
Although environmental innovation and governance were identified by all RF models as being important for the valuation of European companies in the Industrials and IT sectors, the contrast with financial variables was stark. While environmental innovation and governance variables typically ranged between 0.20 and 0.45 (the mean VI, although their maximum values can go up to 0.56 for GOV), financial variables were clearly the most important drivers of Tobin’s Q, with mean values for VI ranging from 0.40 to 1.00. For several of the financial variables (EBITDAM, CR, and TDCE), the range of the mean is even higher, 0.60 to 1.00 in both sectors, confirming the primacy of financial performance metrics for valuation.
Notably, the gap between the importance of financial variables and governance and environmental innovations is more substantial in the IT sector, where EBITDAM dominates. Other important cross-sectoral differences are the following: (i) companies in the industrial sector showed greater balance in the importance of financial variables, while firms in the IT seector demonstrated a concentration on profitability; (ii) the importance of financial leverage (TDCE) for undervalued firms was considerably higher in IT than in the Industrials sector, indicating that debt structure and management might be more critical and more scrutinized by investors for less well-performing technology companies; and (iii) company size (TURN) was more important for overvalued industrial firms than undervalued companies, while the opposite was the case in the IT sector, where size mattered more for companies with a lower Tobin’s Q. Altogether, these differences emphasize that valuation determinants vary not only by firm performance, proxied by Tobin’s Q, but also by sector-specific investor priorities.
Conclusion and implicationsThis study investigated the relationship between environmental innovation and firm performance for European companies in the industrial and IT sectors between 2019 and 2023, employing BMA and RF methodologies. Our analysis showed that the importance of environmental innovation in determining firm valuation varies significantly between sectors and depends on a company’s existing market performance. In the Industrials sector, environmental product scores positively contribute to the market value of overvalued companies. For the environmental management and environmental innovation scores, there was a more complex relationship with negative coefficients in some models. These findings suggested that there might be a potential short-term trade-off between environmental commitments and financial valuation, at least for the two sectors in our analysis. For the IT sector, profitability is the dominant determinant of firm value for all companies, regardless of their level, and environmental factors play a secondary role.
The comparison between over- and undervalued companies reveals distinct patterns. For undervalued companies in the Industrials sector, financial leverage and governance quality emerged as increasingly important drivers of value over time. This indicates that good debt management and solid corporate governance can be used by corporations to impact investors’ perceptions of their performance. In the IT sector, however, sensitivity to market risk and financial leverage were revealed to have greater importance for undervalued companies, implying that investors scrutinize their risk more carefully.
Our findings have provided empirical support for a highly context-dependent analysis of the relationship between environmental innovation, governance, and financial performance. Thus, the study challenges the hypothesis of a universally positive or negative relationship between environmental innovation and financial performance, as well as the significant importance of environmental innovation for valuation.
Our findings suggest that managers should adopt sector-specific approaches, with industrial firms using environmental product innovations as a valuation advantage and IT companies prioritizing profitability and treating environmental innovation as secondary. Undervalued companies in both sectors should direct their attention toward improving financial leverage and governance; IT firms should focus on sensitivity to market risk. For policymakers, there is a need to tailor environmental regulations to integrate sector-specific parameters, and stronger corporate governance should be encouraged, and firms should be supported during the implementation of environmental innovations before long-term benefits materialize.
This study has several limitations that point to directions for future research. First, the analysis of European companies in the two sectors could be expanded to other regions. Companies from developed and emerging markets could be compared to understand how the level of economic development influences the relationship between environmental innovation and financial performance. Second, the sample period could be extended to capture longer-term patterns in the relationship between financial performance and environmental innovation. Additionally, expanding the analysis to sectors that are differently exposed to environmental impacts and have different environmental footprints would provide a more wide-ranging understanding of how sectoral contexts impact the studied relationship.
CRediT authorship contribution statementAlexandra Horobet: Writing – original draft, Supervision, Methodology, Formal analysis, Conceptualization. Ioannis Kostakis: Writing – review & editing, Software, Investigation, Formal analysis, Data curation. Arindam Banerjee: Writing – original draft, Validation, Software, Methodology. Lucian Belascu: Writing – review & editing, Validation, Investigation, Data curation, Conceptualization.
Variable importance for the Industrials sector, 2019–2023.
Model 1 includes EIS and EMT, Model 2 includes EPS and EMT, Model 3 includes ENV.
Variable importance for the Industrials sector, 2019–2023.
Model 1 includes EIS and EMT, Model 2 includes EPS and EMT, Model 3 includes ENV.