


Integration and synergy of environmental policies is crucial for maximizing carbon reduction effects. This study investigates the heterogeneous impact of environmental policy synergy on carbon neutrality using panel data from 30 Chinese provinces between 2003 and 2022 and employing generalized quantile regression and spatial econometric models. The relevant findings are threefold. (1) The marginal impact of environmental policy synergy on per capita carbon emissions exhibits distinct structural characteristics across different positions in the conditional distribution of China’s per capita carbon emissions. (2) Significant heterogeneity is evident in the effects of various environmental policy synergy categories on carbon neutrality. Specifically, synergies between government and enterprise environmental regulation (ER), and government-and public-type ER effectively reduces per capita carbon emissions, contributing to carbon neutrality. In contrast, the synergy between enterprise and public-type ER policies increases per capita carbon emissions, while the synergy between all three types of ER policies does not significantly impact carbon emissions. (3) The direct effect of local government competition on per capita carbon emissions is negligible; however, government and corporate policy synergy results in increased per capita carbon emissions under government competition. This study reveals the heterogeneous effects of policy combinations, providing a dynamic decision-making basis for optimizing policy instruments in achieving carbon peaking and carbon neutrality.
Carbon dioxide (CO2) emissions and the risks associated with climate change have become factors constraining the sustainable development of the global economy(Ai et al., 2024; Russo et al., 2022). Environmental regulation (ER) is a key approach for China to advance the synergistic effects of CO2 and pollution reduction(Ai et al., 2023a).Previous studies have conducted extensive research on the carbon-reducing effects of ER. Some research has focused on the impact of a specific category of ER and legislation on CO2 emissions (Danish et al., 2020; Dirckinck-Holmfeld, 2015; Gudde et al., 2021; Mulatu, 2017; Peng et al., 2023; Sana et al., 2020; Sarfraz et al., 2021a; Xu, 2024),while other studies have investigated the differential CO2 reduction effects of multiple categories of ER policies (Ai et al., 2023a; Cojoianu et al., 2020; Frances et al., 2020; Millimet & Roy, 2016; Rezza, 2015; Wang et al., 2020; Xu et al., 2023).
Although coordinated ER policy implementation has become an increasingly common practice (Chen et al., 2022), existing research has not systematically quantified or evaluated the effects of policy combinations. This gap hinders the identification of reasonable and effective policy mixes, limiting policy makers’ ability to optimize policy coordination. Previous literature has predominantly focused on the independent effects of single policies or a limited set of policies, often overlooking the potential nonlinear or systemic impacts of policy synergy, which challenges the scientific rigor and effectiveness of policy design.
Furthermore, local governments, driven by economic development goals and intergovernmental competition, frequently adopt strategic practices when implementing ER policies such as selective enforcement or insufficient enforcement intensity (Rogge & Schleich, 2018). These actions may weaken the CO2 reduction effects of ERs and even prevent the achievement of policy objectives (Xu et al., 2022). However, existing studies have explored the impact of local government competition and associated strategic practices on the synergistic CO2 reduction effects of ER policies, resulting in a significant gap between theoretical expectations and actual policy outcomes.
This study addresses these limitations by systematically analyzing the effects of different ER policy combinations, filling a critical gap in the literature on policy synergy. We also incorporate the influence of inherent local government competition on shaping the CO2 reduction effects of policy coordination, revealing the potential influence of local government practices on policy effectiveness. Specifically, we employ quantitative analysis to identify optimal policy combinations, providing valuable scientific insights to inform effective policy making. Additionally, by integrating local government competition and associated strategic practices into our analytical framework, we determine the mechanisms through which these factors influence the CO2reduction outcomes of policy coordination. This study uses panel data, combining empirical and theoretical analyses, employing generalized quantile regression and spatial econometric models to comprehensively examine the effects and heterogeneity of ER policy synergy, enhancing the reliability and generalizability of the findings. To systematically address the research gaps identified above, this paper is organized as follows. The next section provides the policy background, literature review, and theoretical hypotheses. In Section 3, we introduce empirical model and summary statistics. Section 4 discusses empirical results. Section 5 concludes the paper by summarizing the core findings and providing policy recommendations.
Literature review and theoretical hypothesesInnovation and challenges in China’s ER policiesChina has implemented a series of ER policies to address environmental pollution and mitigate the effects of climate change, including a carbon emissions trading system, green finance initiatives, energy structure adjustment, pollution emissions standards, and an environmental impact assessment system. These measures demonstrate the government’s strong commitment and proactive approach to environmental governance.
In terms of policy innovation, China has established the world’s second-largest carbon market, leveraging market mechanisms to drive CO2 reduction, representing a significant policy achievement (Gan et al., 2024a). China’s carbon trading market launched pilot programs in 2013, officially implementing the national CO2 emissions trading market in 2021. The Chinese carbon market covers approximately four billion tons of CO2 emissions, and as of 2023, the cumulative transaction volume of the national carbon market has exceeded 10 billion yuan (Xia et al., 2024). Initially focused on the power sector, including over 2,000 companies, the market will expand to high-emission industries such as steel, chemicals, and construction materials. Additionally, green financial products such as green credit and green bonds have provided crucial funding for environmental projects, further advancing renewable energy development (Lin et al., 2024). These measures have not only enhanced policy effectiveness but also demonstrate the effectiveness of China’s model for global environmental governance.
Concerning policy synergy, the Chinese government has advanced effective coordination of various ER policies by ensuring the complementarity of policy tools, the coordination of policy implementation, and the consistency of policy objectives (Wang & Liu, 2024). The carbon trading market offers economic incentives for emissions reduction. In contrast, pollution emissions standards impose legal constraints. Together, these mechanisms complement one another to promote corporate emissions reduction(Chen & Wang, 2023). Furthermore, interdepartmental cooperation and local governments’ environmental responsibility systems ensure the coordinated implementation and effectiveness assessment of policies, enhancing the overall efficacy of the ER policies.
However, China’s ER policies still face many challenges. First, policy enforcement must be further strengthened to ensure effective implementation, particularly at the local government level (Liu et al., 2024). Second, while promoting technological innovation for emissions reduction, it is essential to control the costs of emissions reduction to ensure sustainable economic development (Zhu & Wang, 2024). In addition, identifying more effective policy tool combinations and fully leveraging the synergistic effects of policy combinations remain urgent concerns to be addressed.
ER policy synergy and carbon neutralityER policy synergy refers to the combined effect of multiple sectors or multiple ER policies in the development and implementation process to advance governance objectives (e.g., carbon neutrality) and the effective arrangement of various ER measures to improve governance outcomes and advance policy effectiveness (Mehmood et al., 2024; Persson & Runhaar, 2018).
Internationally, scholars have conducted extensive research on the impact of environmental policies on climate change and CO2 emissions. Qiu et al. (2024) identified a significant global increase in climate policy integration. Drews et al. (2020) assessed the synergy within energy policy mixes, identifying significant impacts in cases of no, positive, and weak synergy, but not in strong synergy scenarios(Drews et al., 2020). Sandra & Emma (2021) examined the European Union’s renewable energy policies, integrating the three dimensions of society, environment, and economy, thereby achieving policy coherence for sustainable development (Sandra & Emma, 2021). Asya et al. (2022) analyzed the synergies and tradeoffs between climate change and air quality policies in the EU, emphasizing the importance of policy integration (Asya et al., 2022). Weber (2023) conducted three explanatory case studies in Germany and Sweden, finding that the synergistic role of ER and policy coordination should be emphasized in the development and use of wind energy (Weber, 2023). Borowiec et al. (2024) analyzed the impact of ERs on CO2 emissions in countries with varying emissions levels. Their findings revealed that ERs are more effective in countries with low per capita pollution compared with those with higher per capita pollution. Shahzad et al. (2024) analyzed data from 26 member countries of the Organization for Economic Cooperation and Development (OECD)spanning 1996 to 2019, determining that ERs and Gross Domestic Product (GDP) can significantly promote clean energy use in OECD countries(Shahzad et al., 2024). Hasanov et al. (2024) examined the varying socioeconomic challenges and diverse environmental policies across 22 EU countries, exploring the role of Government Climate Significant Investment in CO2 emissions reduction through clean energy transitions from 2007 to 2021. The results suggest that stricter ERs have the potential to reduce CO2 emissions without negatively impacting GDP (Khalique et al., 2025). Gyamfi et al. (2025) investigated how the seven major emerging economies (E7) can advance environmental sustainability through green finance, green innovative technology, and environmental fiscal regulation synergy. The results revealed that the combination of green finance and environmental taxes significantly reduces CO2 emissions in these high-emission economies (Gyamfi et al., 2025).
Research in China has been more focused on the CO2reduction effects of environmental regulatory policies. Li & Taeihagh (2020) analyzed the Chinese government’s policy mix to promote the nation’s energy transformation and how that policy blend evolved between 1981 and 2020. They determined that the Chinese government has implemented a variety of initiatives to minimize CO2 emissions (Li & Taeihagh, 2020). Lu et al. (2022) revealed that ER policy synergy has a significant heterogeneous effect on CO2 emissions at various stages (Lu et al., 2022a). Chen et al. (2023) found that flexible and comprehensive ERs are more conducive to promoting green innovation in high–energy consuming and emission enterprises(Chen et al., 2023).
Recent studies have demonstrated that different combinations of ER policies can yield varying CO2reduction effects, with differing synergistic outcomes based on policy types and implementation approaches. Command and control ER (CER), which imposes mandatory standards and regulations, can rapidly reduce short-term emissions; however, its long-term effectiveness depends on the rigor and consistency of enforcement (Ai et al., 2023a; Aydin et al., 2024; Connor et al., 2025). Market-based ER (MER) such as carbon emissions trading systems and carbon taxes, incentivize enterprises to advance CO2 emissions reduction at the lowest cost, although its efficacy requires mature market mechanisms and enterprise participation (Wu & Yu, 2025). Public participation-based ER (PER) enhances policy enforcement through information disclosure and social supervision, particularly in cases of weak local government enforcement or corporate evasion, significantly improving policy outcomes (Wei et al., 2024).
Further research has indicated that the combination of CER and MER combines the complementary effects of rigid constraints and flexible incentives. For example, integrating CO2 emissions quotas with carbon trading markets has significantly improved emissions reduction efficiency in the power sector (Jia et al., 2025; Shvarts et al., 2025). The combination of CER and PER can address government failure through public oversight, as demonstrated in the Beijing–Tianjin–Hebei region, where environmental inspections combined with public complaint platforms have been correlated with markedly improved air quality (Chang et al., 2024; Songa & Hao, 2025). Additionally, the integration of MER and PER can drive corporate green transformation through dual mechanisms of economic incentives and social supervision. For example, in Guangdong Province, the combination of carbon trading markets and public oversight has effectively promoted corporate CO2 emissions reduction (Panza & Peron, 2025). However, the synergistic effects of these three policies vary significantly across China’s regions. In eastern China, where economic development and policy enforcement capabilities are stronger, the synergy is more pronounced, while in central and western regions, limited economic development and lower public participation result in weaker policy effectiveness (Chen et al., 2022).
Although the effects of ER policy combinations may vary, the benefits of such combinations are evident in two key aspects. First, synergistic policy formulation enhances the scientific rigor and feasibility of policies. In the development of emissions reduction-related ER policies, environmental management departments prioritize achieving emissions reduction targets, energy management departments focus on energy efficiency and emissions reduction performance, and economic management departments are more concerned with the impact of ERs on economic growth objectives (Chishti et al., 2025). During the policy making process, each department focuses on the internal mandates and goals that are closely aligned with its responsibilities, often paying less attention to matters outside the departmental scope (Zheng et al., 2021). Collaborative policy formulation across departments can effectively address the limitations of single-department approaches, ensuring that multisectoral objectives and implementation details are adequately considered (Cabo et al., 2025). By involving stakeholders in the decision-making process, policy goals can be designed more comprehensively, policy content can be refined, and enforce ability can be evaluated more scientifically through collective deliberation. For example, economic departments can provide detailed recommendations on the impact of policies on enterprise output, operational efficiency, and penalty severity, while financial departments can offer fiscal support for CO2 emissions reduction initiatives. Policies that are jointly formulated by multiple departments are likely to be more effective than those developed by a single department in terms of depth, breadth, and feasibility (Zheng, 2019).
Second, policy combinations can contribute to improved policy efficacy. During the policy formulation process, support from multiple departments (e.g., economics, finance, and energy) for CO2reductionER policies can facilitate more effective implementation. Moreover, as these departments are directly engaged in policymaking, they are more likely to mobilize and integrate resources effectively, enhancing the governance outcomes of ER policies. Based on these insights, we propose Hypothesis 1(H1).
H1: Environmental regulatory policy synergy enhances CO2control and is conducive to achieving China’s carbon neutrality goal.
Local government competition involves cross regional rivalry between local authorities over investment environments, legal systems, and public goods provision to attract capital, technology, and talent(Li, 2022). This competition can enhance environmental governance by motivating local governments to strengthen ER policies and improve CO2 emissions management, fostering a top to top governance structure. However, it may also result in reduced ER standards and enforcement as governments adopt lenient policies to attract mobile production factors, in a bottom-up competition dynamic(Cui et al., 2023; Xu et al., 2022; Yang et al., 2022). Additionally, CO2 emissions externalities can encourage free-riding behaviors in which some governments benefit from other local governments’ efforts without contributing, further exacerbating bottom-up competition trends (Yang et al., 2023).
Previous research has demonstrated that local government competition negatively impacts ER enforcement, hindering environmental quality improvement and carbon neutrality achievement. Luo & Wang (2017) found that stringent economic reforms exacerbate regional ecoefficiency decline in China (Luo & Wang, 2017). Xu et al. (2022) demonstrated that such competition inhibits low-carbon economic transition and undermines the positive effects of green technology innovation(Xu et al., 2022). Conversely, Yang et al. (2022) revealed the positive effects of competition on agricultural carbon peak, with strategies influenced by geographical proximity to neighboring regions (Yang et al., 2022). Li (2022) identified a nonlinear relationship between local government competition and CO2 emissions in China’s metropolitan areas (Li, 2022). Additionally, Li & Xu (2020) determined that decision-making competition between local governments contributes to regional “green paradoxes” that are driven by factor market distortion, investment bias, and environmental policy “race to the bottom” effects that interact and substitute in influencing CO2 emissions (Li & Xu, 2020).
China’s performance local government appraisal and promotion systems prioritize GDP growth, incentivizing local governments to engage in unsustainable economic practices at the expense of environmental protection (Wu et al., 2020; Yang et al., 2023). To attract capital, talent, and other resources, local governments often weaken ERs, prioritizing short-term economic gains over long-term ecological balance, which undermines the coordinated development of regional economies and environments (Miao et al., 2024). This regulatory relaxation lowers entry barriers for polluting industries, resulting in an influx of high-emission enterprises. Moreover, such practices trigger a competitive subeffect, as neighboring regional governments emulate these practices (Shahzad et al., 2024). However, some scholars have contended that local government competition can foster green economic growth by encouraging energy conservation and CO2 emissions reduction policies, enabling regions to pursue sustainable development strategies (Yang et al., 2023).Therefore, we propose Hypothesis 2 (H2).
H2: Local governments’ competitive practices impact environmental regulatory policy synergy, diminishing the association between environmental regulatory policy synergy and carbon neutrality.
Carbon neutrality refers to achieving zero carbon emissions through effective CO2 emissions reduction approaches that advance carbon neutrality (Fig. 1). Total CO2 emissions can quantify the impact of regions’ carbon governance and identify gaps in reaching the carbon-neutral target (Yang et al., 2020). This study calculates total CO2 emissions for each province, dividing it by the regions’ year-end population to quantify per capita CO2 emissions as a key metric to assess regional carbon neutrality.
Explanatory variable: ER policy synergy
From the perspectives of multiple coordinating bodies, China’s present ER policies can be classified into governmental ER policies (GER), corporate ER policies (CER), and public ER policies (PER). GER refers to ER policies that are primarily implemented by the government that employ various coercive measures to enforce management and control over CO2 emissions and other environmental impacts to ensure compliance with environmental standards and objectives.CER encompasses ER policies that encourage or mandate enterprises to adopt practices to reduce pollution and CO2 emissions. These policies focus on promoting corporate responsibility and innovation to advance environmental sustainability. PER represents ER policies that emphasize the role of public participation in environmental governance. These policies reflect the involvement of citizens in shaping environmental practices and outcomes, highlighting the collective impact of societal actions on environmental protection.
We measure GER by calculating a composite index of three types of pollutant emissions (industrial wastewater, industrial sulfur dioxide (SO2), and industrial soot emissions) for each region. We calculate these emissions as follows. First, we linearly normalize the three categories of pollutant emissions categories per unit of output value using Eq. (1).
where, UEj is the standardized emissions value per unit of output value for pollutant category j in region i. max(UEj)andmin(UEj) indicate the maximum and minimum values of emissionsper unit of an output value of the pollutant of category j in the region, and the formula for calculating the weight of each category is Eq. (2).whereUEijdenotes the average annual unit output emissions of pollutant j in each region. Then the GER level of the region i is calculated using Eq. (3).


Referencing Lu et al. (2022), we measure CER using the amount of treatment investment per unit of environmental pollution emissions. We use the number of written, phone, and online reports received regarding environmental concerns throughout the year to calculate PER. Because data on telephone and online complaints were not accessible until 2011, only written complaints were included before 2011.
We combine the three categories of ER policies (GER, CER, and PER) to form four policy synergy degrees, ERPS12 (GER and CER synergy), ERPS13 (GER and PER synergy), ERPS23 (CER and PER synergy), and ERPS123 (GER, CER, and PER synergy). Referencing Lu et al. (2022), this study quantifies environmental regulatory policy synergy using the coupled coordination degree, as shown in Eq. (4).
whereERk denotes different ER categories (GER, CER, and PER); therefore, K=3. C denotes the level of policy synergy, reflecting the degree of synergy between policies, taking a value range of [0,1]. To eliminate the metric differences between different ER policy variables, the indicators are standardized before calculating the synergy degree (Fig. 2).Moderating variable: Local government competition
.")
Regional government competition primarily reflects the intensity of economic growth dynamics. Local governments often benchmark against neighboring regions with higher economic growth and employ various strategies to narrow the economic development gap. This study measures regional economic competition by considering adjacent provinces and the overall sample area to comprehensively capture the intensity of local government competition within each region. We deflate GDP using 1998 as the base year to control for price level effects. The associated equation is presented as Eq. (5).
whereHPGDP indicates the highest GDP per capita in neighboring regions,TNHPGDP indicates the region with the highest GDP per capita in the entire sample, and RPGDP indicates the GDP per capita in the region.Control variables
This study incorporates economic development (GDP), foreign direct investment (FDI), energy consumption (EC), industrial structure (IS), technological progress (TPL), and urbanization (UL) as control variables for a more comprehensive analysis (Asya et al., 2022; Febrina et al., 2025). Economic development reflects the overall scale of economic activity and residents’ average economic welfare in a region, which is measured by GDP per capita (regional GDP divided by total population) (Sarfraz et al., 2021b). FDI indicates a region’s ability to attract international capital and its economic openness, which is measured by FDI per capita (total FDI divided by total population) (Su et al., 2020b). EC represents a region’s dependence on energy resources and efficiency, which is measured by EC per capita (total EC divided by total population). IS reflects the composition and relative significance of different industries in a regional economy, which is measured by the proportion of secondary industry value added to GDP(Gan et al., 2024b). Technological progress captures a region’s investment intensity in scientific innovation, research and development (R&D) activities, and technological creativity, which is measured by R&D expenditure per capita (total R&D expenditure divided by total population) (Borowiec et al., 2024). Urbanization reflects the population concentration from rural to urban areas and the degree of socioeconomic modernization, which is measured by the proportion of urban population to the total population at the end of the year(Ai et al., 2023b).
Model settingGeneralized quantile regression modelTo test the structural effect of the synergistic impact of ER policies on per capita CO2 emissions, we first construct the following model to capture the relationship between the two using Eq. (6).
where, i and t represent regions and time, respectively, and μit and ϵitrespectively represent regional fixed effects and random error terms. α0 is a constant term, and Xitindicates the set of control variables. CO2it and ERPSitdenote per capita CO2 emissions and ER policy synergy, respectively.
We then construct a generalized quantile regression model referencing the quantile panel regression model of Koenker and Mizera (2004), as shown in Eq. (7).
whereQτ(CO2it) is the τ quantile of CO2 emissions per capita in each region, and α1τ denotes the τ quantile regression coefficient of ER policy synergy.Spatial econometric model
Because CO2 emissions have considerable regional spillover effects (Lu et al., 2022b), we construct a spatial lag model (SLM) and a spatial error model (SEM) to examine the synergistic effects of ER policies on per capita CO2 emissions, referencing the method of Anselin (1995). The two models’ expressions are shown as Eqs. (8) and (9).


Where W denotes the spatial weight matrix. We adopt the adjacency distance matrix, as shown in Eq. (10).

Cross terms for local government competition and ER policy synergy are introduced to Eqs. (8) and (9) to further explore the moderating influence of local government competition on the connection between ER policy synergy and per capita CO2 emissions. To make the regression coefficients consistent and comparable, referring to Balli & Sorensen (2013) to add moderating variables, placing the two variables before the interaction terms (Balli & Sorensen, 2013). The model that incorporates the moderating effect is given in Eq. (11).
Data sources
Our main dataset is panel data of 30 Chinese provinces spanning 2003–2022. The Tibetan region is excluded due to substantial missing data. The data on CO2 emissions and energy consumption (EC) are acquired from the China Energy Statistical Yearbook. Other data are obtained from the China Statistical Yearbook and the China Science and Technology Statistical Yearbook. To address missing data, we employ the interpolation method. Additionally, the variables of economic development, technological progress, and foreign direct investment (FDI) have been log-transformed. After supplementing the missing partial data using interpolation, we obtained data for 30 provinces in China over a 20-year period, resulting in a total of 600 observational samples. Table 1 presents the descriptive statistics of the variables.
Variable definitions and descriptive statistics.
The generalized quantile panel model estimation applies quantile regressions at 0.1, 0.25, 0.50, 0.75, and 0.90 quantile points to examine the marginal effects of ERPS on per capita CO2 emissions. The results in Table 2 reveal significant structural effects of ERPS on per capita CO2 emissions, with variations across different policy combinations and quantile levels.
Generalized quantile regression results.
Note: t-statistics are in parentheses; ***, **, and * indicate significance at 1 %, 5 %, and 10 % levels, respectively.
ERPS123 exhibits a significant negative relationship with per capita CO2 emissions only at the 0.1 quantile, indicating that this combination’sCO2reduction effectiveness is limited to low emissions levels. As emissions rise, the effect becomes insignificant. In contrast, ERPS12 and ERPS13 transition from insignificant to significant CO2reduction effects as quantile levels rise, demonstrating increased effectiveness at higher emissions levels. In contrast, ERPS23 has no significant effect at the 0.1 quantile but is positively associated with per capita CO2 emissions at other quantiles, indicating that this combination contributes to increased emissions.
Overall, the marginal effects of ERPS on per capita CO2 emissions exhibit structural variations depending on the emissions levels within the conditional distribution. Despite these variations, the signs of the estimated coefficients for the four ERPS combinations remain consistent across quantiles, indicating a fundamentally linear relationship between ERPS and per capita CO2 emissions.
Impact of ERPS on carbon neutralityWe next examine the significance of the SEM and SLM models, presenting the results in Table 3. The results reveal that the SLM model passed LM and robust LM tests. In contrast, the SEM model did not pass the robust LM test; therefore, the SLM model is used for the empirical analysis. We also conducted random effects and fixed effects tests of the SLM model, and fixed effects were found to be superior. Based on the fixed effect model, the advantages and disadvantages of time, spatial, and double fixed effect models were compared, and the time fixed effect model was determined to be superior to others and is used to begin our analysis.
Table 4 presents the direct impacts of ERPS on per capita CO2 emissions, revealing thatERPS12 and ERPS13 significantly reduce per capita emissions, contributing to China’s carbon neutrality goal. This demonstrates that the synergy between GER and PER policies effectively lowers emissions. In practice, GER policies enforce compliance by penalizing or shutting down companies with substandard emissions, compelling them to innovate low-carbon technologies and adapt manufacturing processes to meet regulatory standards (You et al., 2019). Meanwhile, CER policies provide financial support through energy efficiency funds and production subsidies, alleviating the economic burden on enterprises during their transition. This dual approach motivates businesses to adopt emissions reduction practices while ensuring compliance with GER requirements.
Estimated results.
Furthermore, economic support from the government also facilitates firms’ low-carbon technological innovation activities, promoting their transition to low-carbon development (Su et al., 2020a). This ultimately motivates enterprises to proactively engage in CO2 emissions control to satisfy the requirements of GER by local governments. Therefore, an effective combination of GER and CER policies function as push and pull forces for firms to reduce pollution emissions and effectively lower per capita CO2 emissions. This finding aligns with You et al. (2019), Putri et al. (2024), and Lu et al. (2022), indicating that GER in concert with CER policies can effectively reduce CO2 emissions.
ERPS13indicates that the synergy between GER and PER policies can have practical synergistic CO2 reduction effects. The GER policy reduces regional CO2 emissions by enforcing industry-specific technical emissions standards. Noncompliant enterprises must rectify or cease operations. Increasing public concern over regional environmental pollution has enabled the public to assist in monitoring corporate CO2 emissions, assisting the government to identify and promptly penalize noncompliant enterprises (Bo et al., 2018). The public is also concerned about enterprises’ CO2 reduction practices, the government’s oversight, and enforcing ER policies. Monitoring local governments that fail to enforce ERs will encourage proactive CO2 emissions management practices. This result aligns with Bo et al. (2018), indicating that GER policies in combination with PER policies can have positive CO2 reduction effects. This supports H1, indicating synergistic environmental regulatory policies contribute to achieving carbon neutrality goals.
Second, ERPS23is significantly and positively correlated with CO2 emissions per capita, indicating that the synergy of CER and PER policies will increase CO2 emissions per capita. A possible reason for this is that the CER policy primarily encourages enterprises’ low-carbon technology innovation. However, some enterprises’ low-carbon technology innovations and reduction practices have not yielded significant results in the short term, despite substantial funding support for low-carbon development. This may hinder the public’s ability to objectively assess the effectiveness of CER policies. Even enterprises that do not receive funding contend that there is an unfairness in business-type ER policies(Feng et al., 2024). Furthermore, enterprises’ low-carbon technological innovations are commercial secrets, and enterprises may disclose less public information, making it difficult for the public to assess enterprises’ CO2reduction practices, which may result in inaccurate public evaluation of CO2 reduction efforts.
Third, the effect of ERPS123 on per capita CO2 emissions is insignificant, indicating that the effects of synergistic GER, CER, and PER policies is not significant. As noted, each of the three types of policies has differing perspectives and focuses in the synergistic process, which will result in difficulties in synergizing the three types of policies and effective operations. This finding also indicates that not all synergistic policy combinations will produce better results. This aligns with the findings of Taneja and Ozen (2023), suggesting that some ER policy synergies produce better CO2reduction effects.
In summary, ERPS12 exemplifies a punishment + incentive policy synergy, penalizing enterprises for exceeding CO2 emissions standards while encouraging emissions reduction, exerting both pressure and motivation. ERPS13combines government coercion and public supervision, imposing dual pressure on enterprises to reduce emissions (Zhang & Wei, 2014). However, integrating other policies within the three types of ER policies can fail to drive CO2reduction and may even increase emissions. In ER policy synergy, the combination of GER with CER or PER policies is more effective, while other policy synergies perform poorly.
Robustness testsTo assess the robustness of the baseline empirical results, we conduct robustness tests by substituting the geographical weight matrix and the CO2 emissions metric. Based on the above analysis, we replace the spatial weight matrix with the economic distance matrix, and replace per capita CO2 emissions with total CO2 emissions in two regressions, while also replacing the spatial weight matrix and variables. We determine the economic distance weight matrix by calculating the absolute value of the difference between the mean GDP values of regions i and j. The calculation formula is wij=1|(gdpi‾−gdpj‾|), where gdpi‾ and gdpj‾ are the average GDP values for region i and j in the sample observation year.
Table 5 presents the results of the robustness tests, where Model (1) shows the results using the economic distance matrix, Model (2) shows the results using the total CO2 emissions instead of the per capita CO2 emissions, and Model (3) shows the results after replacing both matrices. From the regression coefficients of the four types of ER policy synergies in Table 5, the results of Models (1)–(3) remain consistent, confirming that the transformed spatial weight matrix and variable substitution align with the previous analysis. This consistency validates the robustness of the baseline findings.
Robustness tests.
Note: t-statistics are in parentheses; ***, **, and * indicate significance at 1 %, 5 %, and 10 % levels, respectively.
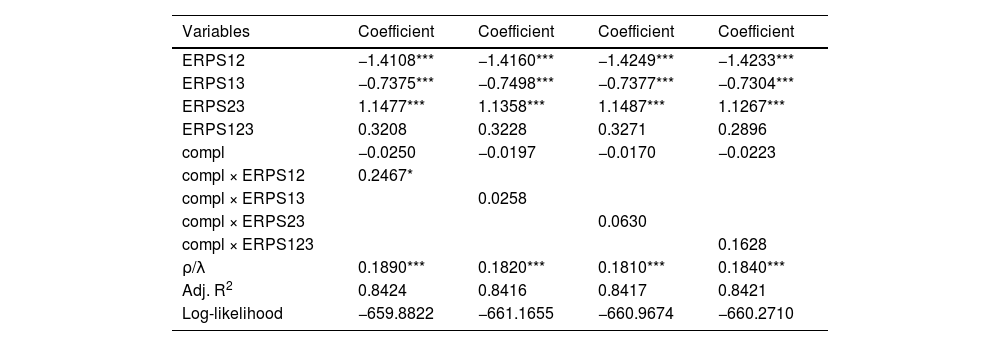
Employing the method of increasing cross terms in the empirical model, we conduct the moderating effect analysis by systematically increasing the interaction terms. Table 6presentsthe CO2reduction outcomes of synergistic environmental regulatory policies to examine the moderating effect of government competition regulation.
Moderating effects.
Note: ***, **, and * indicate significance at 1 %, 5 %, and 10 % levels, respectively.
First, the direct effect of local government competition on per capita CO2 emissions is insignificant. The results in Table 6show each stepwise regression model, and the regression coefficients of local government competition fail the significance test, demonstrating that the association between local government competitiveness and per capita CO2 emissions is insignificant. We attribute this outcome to two main reasons. First, government competition in GDP tournaments often motivates local governments to lower ER standards and reduce policy synergy efficiency and prioritize high GDP growth. This incentivizes industries to focus on economic gains, expanding production at the expense of green practices, which increases EC and pollution. Second, to gain economic advantages, local governments implement preferential policies, support enterprise innovation, and encourage cleaner production processes. This accelerates technological innovation, promotes green development, and prioritizes funding for low-carbon technologies, guiding enterprises toward green innovation and reducing EC and CO2 emissions. This partially supports H2, implying that local government rivalry moderates the beneficial interaction of ER programs, negatively influencing the achievement of carbon neutrality targets.
Second, ERPS12policy synergy will increase CO2 emissions per capita amid local governments competition. As shown in Table 6, the estimated coefficient of ERPS12policy synergy is −1.4108; however, the estimated coefficient of the cross term between government competition and ERPS12is 0.2467, both of which pass the significance test at the 10 % level. This suggests that the policy synergy effect of ERPS12is undermined by government competition, which inhibits its CO2reduction potential. To attract mobile production factors such as technology, capital, and talent, local governments lower environmental standards and enforcement, fostering a race to the bottom in CO2 emissions governance. Additionally, the cross border nature of CO2 emissions encourages some local governments to adopt a free-riding approach and benefit from neighboring regions’ efforts without contributing, further exacerbating the race to the bottom in CO2 emissions management.
Third, the moderating effect of local government competition on the other three policy synergies is statistically insignificant. As shown in Table 6, the estimated coefficients of the interaction terms between local government competition and ERPS13, ERPS23, and ERPS123are not statistically significant. Notably, the positive signs of these coefficients indicate that the ER policy synergies (ERPS13, ERPS23, and ERPS123) do not contribute to CO2reduction in the context of government competition and may even slightly increase per capita CO2 emissions.
Different government competition levelsTo further explore the heterogeneous impact of local government competition on the CO2reduction effects of ER policy synergy, this study divides the sample into high- and low-level groups based on competition intensity. The high-level group includes18 provinces and cities (Anhui, Shanxi, Yunnan, Hainan, Shanxi, Jiangxi, Gansu, Qinghai, Hunan, Ningxia, Guangxi, Hebei, Heilongjiang, Sichuan, Jilin, Hubei, Henan, and Guizhou), and the low-level group includes 12 provinces and cities (Shandong, Tianjin, Beijing, Shanghai, Chongqing, Xinjiang, Inner Mongolia, Jiangsu, Fujian, Zhejiang, Liaoning, and Guangdong). Fig. 3 illustrates the local competition levels under these groupings.

As shown in Fig. 3, although both groups exhibit a declining trend in local government competition, the high-level group demonstrates a more pronounced decline, while the low-level group shows a relatively moderate decrease. This divergence indicates that local government practices under different competition intensities may differentially influence the effectiveness of policy synergy. Therefore, this group analysis reveals the nonlinear relationship between competition intensity and policy outcomes and provides empirical evidence for developing more targeted environmental policies. This analysis further validates the moderating role of local government competition in the CO2reduction effects of ER policy synergy and emphasizes the importance of considering the heterogeneity of local government competition in policy design.
Table 7 illustrates the varying effects of ER policy synergy on per capita CO2 emissions across different local government competition groups, revealing that the effects of ER policy synergy on per capita CO2 emissions vary with the degree of government competition. The impact of ERPS13on per capita CO2 emissions varies significantly in this grouped regression. Under low government competition, ERPS13significantly lowers per capita CO2 emissions, demonstrating effective policy synergy. However, under high government competition, the effect becomes insignificant, indicating that the inhibitory impact on per capita CO2 emissions diminishes as local government competition intensifies. This suggests that greater local government rivalry under the Chinese-style decentralized system causes greater incentives for local governments to pursue rapid economic growth. This leads local governments to prioritize economic development over CO2 emissions control, undermining governance efficiency. Additionally, in the grouped regressions, the effects of ERPS12, ERPS23, and ERPS123on per capita CO2 emissions align with the overall sample regression results.
Results by low- and high-level competition group.
Note: ***, **, and * indicate significance at 1 %, 5 %, and 10 % levels, respectively.
After systematically analyzing the impact mechanism of ER policy synergy on carbon neutrality, this study systematically examines the heterogeneous impact of ER policy synergy on advancing carbon neutrality for 30 Chinese provinces from 2003 to 2021 using panel data and generalized quantile regression and spatial econometric models. This study yields the following three relevant conclusions:
- (1)
ER policy synergies have significant structural effects on per capita CO2 emissions, and variances are evident in the structural consequences induced by different policy synergies.
- (2)
Different environmental policy synergies have varying impacts on per capita CO2 emissions, and not all combinations are conducive to advancing carbon neutrality. The ERPS12synergy exemplifies a penalty + incentive approach, penalizing enterprises for excessive emissions while incentivizing emissions reduction, and this dual mechanism effectively lowers per capita CO2 emissions. Conversely, ERPS13embodies a punishment + supervision framework, wherein the government mandates emissions cuts and the public oversees corporate emissions control efforts. Therefore, ERPS12 and ERPS13 support the attainment of carbon neutrality. In contrast, ERPS23may elevate per capita CO2 emissions, hindering progress toward carbon neutrality. Additionally, the combined effect of EPRS23on CO2 reduction is not statistically significant.
- (3)
The direct impact of local government competition on per capita CO2 emissions is statistically insignificant; however, local government competition has a significant moderating effect in enhancing the synergistic effect of the ERPS12policy. Specifically, the influence of ERPS12on per capita CO2 emissions shifts from inhibitory to facilitative as local government competition intensifies. Furthermore, when analyzing local government competition levels by dividing our sample into high and low groups, the effect of ERPS13on per capita CO2 emissions undergoes a fundamental change in the high-competition group. At low levels of local government competition, ERPS13 significantly reduces per capita CO2 emissions, contributing to the achievement of carbon neutrality goals. In contrast, within the high local government competition group, the effect of ERPS13 on per capita CO2 emissions is minimal, indicating that its inhibitory impact weakens as the intensity of local government competition increases.
We propose three policy recommendations based on our findings. First, policymakers should fully consider the dual objectives of economic growth and environmental protection when developing ER policies. Environmental governance and CO2 emissions control are classic issues in environmental economics. It is essential to avoid the sole pursuit of economic growth at the expense of environmental degradation or overemphasizing environmental protection to the detriment of economic development. It is recommended to achieve mutually beneficial outcomes for economic growth and CO2 emissions control through policy synergy. Specifically, a green GDP assessment mechanism should be introduced in policy design, incorporating indicators such as CO2 emissions intensity and environmental quality into the local government performance evaluation system to promote the coordinated development of economic growth and environmental protection.
Second, policymakers should engage in refined policy combination design. Our findings demonstrated that the penalty + incentive policy combination (ERPS12) can significantly reduce per capita CO2 emissions and is an effective tool for achieving carbon neutrality goals. Therefore, policymakers should prioritize the promotion of such policy combinations. However, the penalty + supervision policy combination (ERPS13) shows diminishing effects under high levels of local government competition and should be applied with caution. Furthermore, the incentive + supervision policy combination (ERPS23) may increase per capita CO2 emissions and should not be relied on exclusively. Policymakers must focus on optimizing the combination of policy tools to avoid efficiency losses from policy overlap and explore optimal policy mixes through pilot programs and dynamic adjustments.
Third, local government competition significantly moderates the implementation effects of ER policies, potentially resulting in heterogeneous policy outcomes. For instance, ERPS12transitions from an inhibitory to a facilitative effect under high levels of local government competition, while the effectiveness of ERPS13 diminishes as the degree of competition rises. Therefore, policymakers should reasonably guide local government competition by establishing incentive-compatible mechanisms that encourage local governments to pursue economic growth while simultaneously considering environmental protection goals. Additionally, local governments’ strategic practices must be mitigated through stricter central government oversight and assessment. Regional collaborative governance should also be promoted to break administrative barriers and promote resource sharing and policy coordination.
LimitationsThis section analyzes the limitations of the study, which we categorize into four main considerations. First, the study is constrained by a limited selection and combination of policy types in its exploration of ER policies. While we focus on three primary ER policies and their combined effects, in reality, China has a vast variety of ERs, and the potential policy combinations scenarios are complex and diverse. This narrow research perspective may not fully capture the interactions between different ER policies or their comprehensive impact on CO2reduction. To address this concern, future research should employ advanced methods such as simulation modeling to explore a broader array of policy combinations and their effects on achieving multiple advancing carbon neutrality goals. Such efforts would provide a more robust theoretical foundation for policy formulation.
Second, in the analysis of the relationship between local government competition and the synergy of ER policies toward carbon neutrality, we identify local government competition as a critical factor but fails to sufficiently consider other potentially significant influences. For instance, variables such as fiscal decentralization, policy implementation capacity, and public participation may have substantial influence on shaping local governments’ environmental oversight and pollution control practices. These factors could either amplify or mitigate the effects of ER policies; however, their interaction remains under explored. Therefore, future research should adopt a more comprehensive perspective to investigate how these multidimensional factors collectively influence ER policies’ implementation and effectiveness. This could offer more systematic theoretical support for local governments’ environmental oversight strategies.
Third, although we demonstrate that local government competition does not have a significant direct impact on per capita CO2 emissions, the specific reasons and mechanisms behind this remain to be further explored. For instance, due to limitations in data and research methods, we were unable to fully capture the multidimensional nature of local government competition and its heterogeneous effects across different regions or time periods. Future research could deepen this investigation by incorporating more granular data, employing region- or time-specific analyses, and exploring the specific mediating or moderating mechanisms through which local government competition influences CO2 emissions. Additionally, integrating policy practice cases to analyze the dynamic relationship between local government competition and the synergistic effects of ER policies could provide further theoretical insights and practical implications, offering a more robust foundation for policy formulation.
Finally, the findings of this study are limited by reliance on data that are exclusively from China, which may restrict the generalizability of our conclusions. ER policies are highly context dependent, and their effectiveness can vary significantly across different socioeconomic backgrounds, political environments, and cultural conditions. To enhance the external validity of the research, future studies should incorporate cross regional and cross national data for comparative analysis. This would allow for a deeper understanding of how ER policies perform in diverse contexts. Additionally, integrating longitudinal data analysis methods could better reveal the temporal effects of policy implementation, providing a more dynamic and comprehensive assessment of ER policies over time. This approach would strengthen the applicability of research findings to real-world policymaking scenarios.
FundingThis study is supported by Philosophy and Social Science Research Project of Hubei Provincial Department of Education (Grant No.: 22Q081).
CRediT authorship contribution statementJun Zhao: Writing – review & editing, Writing – original draft, Validation, Methodology, Data curation. Lelai Shi: Writing – review & editing, Writing – original draft, Validation, Software, Methodology, Data curation.