


As China’s economic restructuring and industrial upgrading advances, hard technology innovation has become a critical driving force for promoting industrial transformation and enhancing corporate market competitiveness. This study focuses on semiconductor listed enterprises from the Shanghai and Shenzhen A-share markets (2010–2022) as research subjects. We construct a theoretical framework based on complex system theory to explore how hard technology innovation drives value chain upgrading and subsequently impacts corporate market competitiveness. The framework encompasses five dimensions of research and development (R&D) investment, R&D outcomes, breakthrough innovation, R&D potential and technological advancement. Dynamic qualitative comparative analysis is employed to identify the configurational paths through which hard technology innovation factors influence value chain upgrading. The regression analysis examines the direct and indirect (value chain upgrading) effects of hard technology innovation modes on corporate market competitiveness. The results reveal that individual elements of hard technology innovation have limited explanatory power for value chain upgrading, and effective upgrading requires multi-sided alignment of multiple components. Four configurational patterns driving value chain upgrading are identified, encompassing a high-intensity, steady-growth mode, a high-intensity, technology-driven mode, a moderate-potential accumulation mode and an innovation-driven leap mode. Further analysis demonstrates that these four innovation modes have a significant positive impact on corporate market competitiveness. Additionally, a complex mediating effect is observed in which hard technology innovation indirectly enhances market competitiveness through value chain upgrading. Based on these conclusions, targeted policy recommendations are proposed to promote value chain upgrading and strengthen corporate competitiveness.
In recent years, with ongoing adjustments to China’s economic structure and advancing industrial upgrading, enhancing corporate competitiveness has become a focal concern for policymakers and enterprise management. However, competition between enterprises no longer centres solely on traditional advantages such as scale and cost efficiency but increasingly depends on innovation capabilities and technological leadership. As China advances its strategic goals of ‘high-level self-reliance and self-strengthening in science and technology’, ‘resolutely winning battles over critical core technology breakthroughs’ and ‘building an innovative nation’, hard technology innovation has become a pivotal driving force for industrial transformation and market competitiveness (Chen, 2024). Compared with soft technology innovation, which primarily focuses on optimising business modes, service processes or digital platforms, hard technology innovation directly impacts materials, equipment, processes and core components within the material production system. Hard technology innovation is characterised by high technological barriers, long research and development (R&D) cycles and strong externalities (Rachinger, Rauter et al., 2019). This type of innovation can significantly improve product performance and production efficiency and drive systematic change across the entire chain of enterprises such as R&D and design, manufacturing processes, supply chain management and market response, by restructuring their technological capabilities, substantially upgrading the entire value chain. In the strategic and fundamental semiconductor industry, self-reliance not only concerns the industrial chain’s security but also directly affects a country’s strategic position in the global digital economy landscape. In recent years, the Chinese government has continuously increased policy support and capital investment to promote semiconductor enterprises’ technological breakthroughs (Huang & Malkin, 2025). However, technological investment does not necessarily translate into market competitiveness. Enterprises’ internal capability structure, the external environment and multi-factor coordination mechanisms influence their conversion efficiency.
When exploring the relationship between technological innovation and corporate performance, existing studies predominantly adopt linear regression or case analysis methods, emphasising the net effect of single variables (Wu, Shi & Liu, 2024). However, it is difficult to capture the asymmetric causal mechanisms under the interaction of multiple factors. Although some studies have begun to focus on the mediating role of value chain upgrading in the innovation transformation process (Su, Jia et al., 2024), the majority are still based on the simplified logic of variable-oriented analysis, neglecting the multiple possible paths for enterprises to achieve value chain upgrading. For example, some enterprises can achieve technological breakthroughs through high-intensity R&D investment, while others may achieve systematic upgrading through industry–university–research collaboration and organisational change. This characteristic of ‘multiple concurrent causality’ is precisely the limitation of traditional methods. Furthermore, although theories such as dynamic capability theory and technological capability theory provide important frameworks for understanding corporate innovation, these theories primarily focus on a single dimension of capability or linear evolution processes, making it difficult to explain how resources, institutions, organisations and technological elements jointly drive hard technology innovation value creation in different combinations.
To overcome these theoretical and methodological limitations, this study proposes an integrated ‘resource–capability–value’ configurational model, which organically integrates the resource-based view (RBV) and the dynamic capabilities view (DCV) into a complex system analysis framework. Specifically, hard technology innovation is not only considered to be a high-order strategic resource (from the RBV perspective) but also as an organisational capability to transform static resources into dynamic competitive advantages (from the DCV perspective). In this model, a firm’s tangible and intangible resources constitute its initial resource endowment. Hard technology innovation capability is manifested as a dynamic process in which the firm perceives technological opportunities, integrates internal and external knowledge, reconstructs technological paths and realises commercial applications. This capability enables firms to upgrade the value chain through differing paths in a highly uncertain technological environment, ultimately transforming it into sustainable market competitiveness. This model breaks through the RBV’s reliance on static resource attributes and the DCV’s assumption of a linear evolution of capabilities. Instead, it emphasises the non-additive combination of multiple conditional elements, providing a more explanatory theoretical framework for understanding the value transformation mechanism of technological innovation.
The theoretical contributions of this study are reflected in the following three aspects. First, at the level of theoretical integration, this study constructs a configurational explanation model that combines the RBV and DCV, deepening the understanding of hard technology innovation’s value transformation mechanism. Most existing studies use RBV and DCV separately. RBV emphasises the decisive influence of heterogeneous resources on competitive advantage (Lockett, O’Shea & Wright, 2008), while DCV focuses on firms’ ability to reconfigure resources (Maksimov, Wang & Yan, 2022). However, both have limitations in explaining complex technological innovation scenarios. As hard technology innovation has a dual role of resource activator and capability carrier, revealing the multiple paths through which it triggers value chain upgrading under different resource combinations and bridging the theoretical gap between static resources and dynamic processes is essential. Second, in terms of methodology, the study expands the application scope of qualitative comparative analysis (QCA) in innovation management research and enhances causal inference using a mixed-method design. This is the first study to apply dynamic QCA to panel data of Chinese listed semiconductor enterprises, introducing a time-lag design to establish the causal sequence and alleviate reverse causality concerns. The study clarifies the complementary logic between QCA and regression analysis. Based on configurational thinking, QCA identifies sufficient paths for achieving high-level value chain upgrading, while the subsequent fixed-effects model examines the net effects of key conditions. We cross-validate the methodological paradigms through the dual verification of configurational sufficiency-variable net effects, enhancing the internal validity of the conclusions and offering a path that combines theoretical depth with methodological rigour to address endogeneity. Third, in terms of contextual innovation, this study focuses on Chinese semiconductor enterprises’ strategic responses under the co-existence of technological decoupling and strong policy support, providing key evidence from an emerging economy for global value chain (GVC) and innovation ecosystem theories. The majority of existing studies discuss technological catch-up in the context of developed countries (Cho & Lee, 2003), neglecting the configurational breakthrough mechanisms under external barriers. In the context of intensified Sino–United States technological competition, enterprises actively cultivate technological resilience through different combinations of R&D intensity, industry–university–research collaboration and organisational agility, rather than passively relying on policies. This challenges the simplified understanding of single dependence or policy omnipotence and enriches the perspective concerning the agency of Global South countries in reconstructing the GVC.
Moreover, this study breaks through the current limitations of traditional complex system theories primarily being used for macro-industrial or ecosystem analysis (Azadegan & Dooley, 2021). The study promotes the application of complex system theories at the micro-organisational level, the dynamisation of configurational analysis and expands causal inference capabilities by introducing the time dimension and econometric verification, providing a methodological framework for examining high-tech industries’ multiple concurrent causality.
This study also has significant practical implications. In the current context of highly uncertain external environments, enterprises urgently need to clarify how to select the optimal combination of innovation elements to advance value chain upgrading with limited resources. The efficient paths identified in this study can provide strategic references for managers and enable enterprises to avoid the high technological input–low output trap. In addition, our results also provide a basis for policymakers to optimise innovation support systems and accurately guide resource allocation.
The remainder of this paper is arranged as follows. Section 2 reviews the relevant literature; Section 3 outlines the theoretical foundations and research framework of hard technology innovation, value chain upgrading and market competitiveness; Section 4 conducts a configurational analysis of hard technology innovation driving value chain upgrading; Section 5 analyses and discusses the impact of hard technology innovation on market competitiveness through enterprise value chain upgrading; and Section 6 summarises the research conclusions and proposed policy recommendations.
Literature reviewAs a revolutionary technology cluster represented by artificial intelligence, biotechnology and other advanced capabilities (Jiang, Wu et al., 2023), hard technology is increasingly regarded as the core engine for promoting enterprise value chain upgrading due to its remarkable characteristics in core technology breakthroughs, high technological barriers and replication difficulties (Burgess & Gules, 1998). Unlike technological forms that focus on mode innovation or user experience optimisation, hard technology emphasises the original innovation and system integration of underlying technologies. The realisation of its value not only depends on the advancement of the technology itself but also on how enterprises embed it into their organisational capability systems and transform it into sustainable competitive advantages.
From a theoretical perspective, the influence of hard technology in value chain upgrading can be deeply embedded in the analytical frameworks of the RBV (Barney, Ketchen et al. 2021) and DCV (Karna, Richter et al. 2016). According to the RBV, a firm’s competitive advantage stems from strategic resource endowments that are heterogeneous, scarce, non-imitable and non-substitutable (Varadarajan 2023). As a typical technological strategic resource, hard technology has high barriers and path dependence, establishing a basis for enterprises to occupy high-value-added segments in the GVC. For example, developed economies with rich factor endowments are more likely to gain an advantageous position in global competition attributable to knowledge and technology accumulation (Yang, Zhang et al.2020). This indicates that hard technology is not only a production tool but also a key resource that determines a firm’s strategic position.
Furthermore, the DCV emphasises firms’ ability to integrate, build and reconfigure resources to adapt to environmental changes (Le Pochat, Bertoluci et al., 2007). The process of hard technology innovation itself is an embodiment of dynamic capabilities in which enterprises achieve technological resource renewal and upgrading through continuous technological exploration, absorption and re-innovation. Wei, Meng et al. (2025) find that all dimensions of hard technology innovation are indispensable for promoting enterprises’ high-quality development. This process is heterogeneously regulated by enterprises’ digital transformation, reflecting differences in the organisation’s dynamic capabilities in technology absorption and transformation. Therefore, realising the value of hard technology is not a linear process but depends on the co-evolution of enterprises’ internal capabilities.
Notably, current research on the relationship between hard technology innovation and value chain upgrading has significant limitations. First, existing studies present fragmented theoretical perspectives. Some scholars base their research on the RBV, emphasising hard technology’s static advantage as a strategic technological resource (Ding Hua, 2024; Yang Nan, 2019). In contrast, other studies employ the DCV, focusing on enterprises’ ability to adapt and reconfigure in the process of technological evolution (Liu Gang, 2017). Although both theories recognise the importance of hard technology, the former tends to consider technology as the source of competitive advantage, whereas the latter emphasises the capability-building process behind technological evolution. This theoretical divergence results in the lack of a unified mechanism in existing studies for explaining how technology is transformed into value, specifically neglecting the interactive logic between resources and capabilities.
Second, in terms of research methods, most existing literature employs traditional regression analysis, focusing on the net effects among variables. Such research assumes that a certain factor (such as R&D investment) has an independent and linear influence on the outcome (such as value chain upgrading) (Gao, Li et al., 2023; Lee, Malerba et al., 2020; Ryan, Buciuni et al., 2020). This approach implies a simplified assumption of a single causal path, which does not capture the complexity of the concurrency, interaction and substitution of multiple conditions in reality. For example, Zhao, Wu et al. (2024) find that the impact of upstream technological complexity on downstream manufacturers’ innovation depends on the trade-off between cost-effectiveness and market competition effects wherein the former inhibits innovation, while the latter promotes it. This finding reveals the non-linearity and context-dependence of the impact of technological innovation, suggesting the limitations of single-variable analysis.
Third, concerning research conclusions, although studies confirm the positive effects of hard technology in reducing costs (McDonald & Srinivasan, 2004), improving efficiency (Turekulova, Beisengaliyev et al., 2025) and exploring new markets (Wu, Yang et al., 2018), these effects are often examined in isolation, lacking systematic identification of the combinations of conditions that can fully trigger value chain upgrading. Notably, Ni, Xu et al. (2021) find that organisational flexibility has a positive impact on corporate competitiveness, and organisational innovation has a mediating role. Furthermore, Rengkung, Maweikere et al. (2024) emphasise the importance of open innovation in enhancing enterprises’ digital technology integration capabilities. These studies imply that the influence of hard technology may depend on specific organisational contexts and capability configurations; however, the concurrency of multiple conditions and the issue of equivalent paths are not systematically analysed from a configurational perspective.
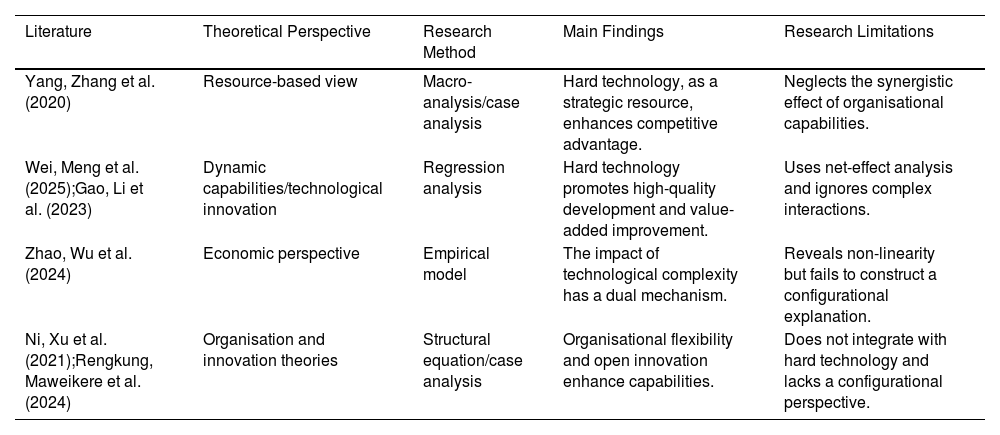
To systematically summarise the above research progress and deficiencies, we organise the theoretical foundations, research methods, main findings and remaining gaps of key literature in Table 1.
Comparison of relevant literature.
| Literature | Theoretical Perspective | Research Method | Main Findings | Research Limitations |
|---|---|---|---|---|
| Yang, Zhang et al. (2020) | Resource-based view | Macro-analysis/case analysis | Hard technology, as a strategic resource, enhances competitive advantage. | Neglects the synergistic effect of organisational capabilities. |
| Wei, Meng et al. (2025);Gao, Li et al. (2023) | Dynamic capabilities/technological innovation | Regression analysis | Hard technology promotes high-quality development and value-added improvement. | Uses net-effect analysis and ignores complex interactions. |
| Zhao, Wu et al. (2024) | Economic perspective | Empirical model | The impact of technological complexity has a dual mechanism. | Reveals non-linearity but fails to construct a configurational explanation. |
| Ni, Xu et al. (2021);Rengkung, Maweikere et al. (2024) | Organisation and innovation theories | Structural equation/case analysis | Organisational flexibility and open innovation enhance capabilities. | Does not integrate with hard technology and lacks a configurational perspective. |
While existing research provides rich results in the influencing factors and economic consequences of hard technology innovation, three deficiencies remain. First, there is a lack of theoretical integration. No studies combine the RBV and DCV, and a systematic transmission mechanism for technological resources-organisational capabilities-value upgrading has not been constructed. Second, in terms of methods, most studies adopt variable-oriented net-effect analysis, neglecting the context-dependence, non-linearity and multiple concurrency of the impact of technological innovation. Third, the research conclusions tend to focus on single-path or mediating mechanisms and fail to identify the multiple equivalent paths (equifinality) to achieve value chain upgrading. In other words, different combinations of conditions can produce the same result. Above all, previous studies primarily focus on variables’ independent net-effect. In contrast, this study shifts to configurational causality to explore how antecedents such as hard technology level, organisational flexibility and digital technology integration capabilities are combined in asymmetric and non-linear ways to drive value chain upgrading jointly. This paradigm shift aligns with complexity theory, wherein high-order organisational outcomes are often driven by the asymmetric combination of multiple factors (Rego, 2010), providing a more realistic explanatory framework for understanding the value transformation of hard technology.
In summary, although existing research provides valuable results concerning the influencing factors and economic consequences of hard technology innovation, three obvious research gaps remain. (1) A lack of theoretical integration that places hard technology within a unified RBV–DCV framework, and the transmission mechanisms of technological resources–organisational capabilities–value upgrading are not clearly revealed. (2) Context-dependence and the non-linear characteristics of the impact of technological innovation are ignored, and the research methods are limited to net effect analysis. (3) Multiple equivalent paths to achieve value chain upgrading are not fully explored, and a lack of identification of the synergistic configurations of technology–organisation–environment remains.
This study fills these gaps and makes three noteworthy contributions. (1) Theoretical contribution: the study systematically integrates the RBV and DCV to construct an integrated analytical framework for examining the value chain upgrading driven by hard technology innovation. The results clarify the collaborative mechanism between technological barriers and organisational dynamic capabilities. (2) Methodological contribution: we introduce QCA into the model to overcome the limitations of traditional variable-oriented research, identifying multiple causal paths for achieving value chain upgrading and revealing how different enterprises transform technological value through differentiated capability combinations. (3) Practical contribution: the study provides a configurational and contextual decision-making basis for different types of enterprises to formulate value chain upgrading strategies based on hard technology innovation.
Theoretical background and research frameworkHard technology innovation and market competitivenessExisting research indicates that enterprises mastering hard technology often achieve higher market recognition. By accumulating technical expertise and pursuing hard technology advancements, companies can grasp cutting-edge core technologies, subsequently establishing technological barriers. This not only strengthens enterprises’ competitive positions within the industry but also enhances their bargaining power, laying a foundation for sustained competitive advantages. Additionally, firms with hard technology capabilities demonstrate greater resilience against market fluctuations through stable growth trajectories. Furthermore, under the backdrop of great-power competition, hard technology innovation facilitates the development of foundational core technologies and products. This ensures greater autonomy and control over key technology supply chains, effectively addressing critical sectors’ vulnerabilities and mitigating risks of being constrained in strategic domains (Li,u & Li, 2023). According to GVC theory, dominant firms monopolise core technologies, product designs and brand assets, relegating enterprises from developing countries to low-profit positions within GVCs (Bennett, 2023). Hard technology innovation enables enterprises to bridge gaps with international advanced technologies, breaking free from dependence on foreign core technologies. Furthermore, technological leadership generates positive effects such as expanded market share, enhanced brand value and strengthened competitive resistance (Berry, 2006). It can also foster integration across upstream and downstream industrial chains, forming more robust ecosystems.
Hard technology innovation and value chain upgradingHard technology innovation is a pivotal force for sustainable corporate development, functioning as a dynamic, multi-tiered ecosystem of technological progress driven by multiple interdependent dimensions. Following the 4 + 5 criteria outlined in The Guidance on Evaluating Scientific and Technological Innovation Attributes (Trial Implementation), hard technology innovation is decomposed into R&D intensity, R&D outcomes, disruptive innovation, R&D potential and technological advancement dimensions. Specifically, R&D investment reflects a firm’s financial and operational commitment to technical innovation, forming the foundation of hard technology innovation, and R&D outcomes represent tangible outputs of innovation activities such as patents and new products. Disruptive innovation emphasises transformative technological changes that provide firms with competitive advantages, and R&D potential signifies a company’s internal technological accumulation and future innovation capabilities, including talent reserves and knowledge assets. Finally, technological advancement focuses on the technology’s frontier nature and maturity, determining a firm’s market standing and competitiveness through its product or service offerings (Thakuri, Alkki et al., 2024). These elements interact synergistically to propel corporate value chains from low- to high-end stages, driving industrial transformation and upgrading.
First, guided by the RBV and DCV, R&D investment—a core element of hard technology innovation—offers robust support for value chain upgrading. Sustained R&D efforts enable firms to enhance the technological sophistication of their products/services, optimise production processes and boost efficiency, product quality and market competitiveness (Barney, 2000). Furthermore, R&D fosters internal knowledge accumulation and technological diffusion, with positive learning curve effects that lower long-term costs and underpin sustainable development. More critically, advanced R&D activities empower firms to penetrate new market domains, develop differentiated products/services and elevate their positions in the industrial chain—from low-value manufacturing towards high-value segments such as design and brand building—advancing vertical integration and value chain upgrading (Mehta, 2022). Second, R&D outcomes and disruptive innovation directly elevate the technological standards of products/services, enabling enterprises to distinguish themselves in fiercely competitive markets. High-quality R&D drives firms to explore new markets and create value-driven products/services, establishing differentiated competitive advantages (Kanz, 1994). According to Porter’s value chain theory, once a firm establishes a leadership position in a niche market through its brand and technology prowess, it can gradually shift away from low-end manufacturing towards higher-value-added activities such as design and brand development. This transition signifies an elevated status within the industrial chain and a shift towards providing comprehensive solutions, enhancing market adaptability and risk resilience and laying foundations for sustainable growth. Third, robust R&D potential enables enterprises to continuously adopt new technologies, materials and methods to refine existing products/services or pioneer entirely novel offerings (Xiao, Wang et al., 2023). Such ongoing innovation not only adapts to market shifts while maintaining operational flexibility but also aligns with Schumpeter’s theory of creative destruction, where continuous innovation disrupts existing modes to build new production frameworks (Robra, Pazaitis et al., 2023). Robust R&D potential can also attract investor attention, securing long-term funding for enterprises to maximise industry transformation opportunities. This enables continuous value chain upgrading and maintains GVCs’ competitive standing in the global economy. Fourth, companies with advanced technologies excel in production efficiency, product quality and environmental performance, meeting consumers’ growing demands, particularly in today’s rapidly evolving markets. Technological advancement also empowers enterprises to explore emerging markets (Onyas & Ryan, 2015) such as fields related to sustainable development, which not only advance corporate social responsibility practices but also establish new growth avenues. Maintaining technological leadership is a critical safeguard for enterprises to continuously drive value chain upgrading.
Configurational perspective on the diverse pathways of hard technology innovation promoting value chain upgrading and its impact on market competitivenessHard technology innovation is a multi-dimensional enterprise innovation activity that can promote value chain upgrading through diverse pathways and influence corporate market competitiveness. In this context, the value chain acts as a mediator between hard technology innovation and market competitiveness; however, the mediating effect of value chain upgrading is highly complex. From the configurational perspective, hard technology innovation can influence value chain upgrading through multiple equivalent pathways. Furthermore, innovation pathways directly or indirectly impact market competitiveness through value chain upgrading. Divergences in hard technology innovation among firms due to differing developmental stages, industry characteristics and resource endowments may lead to distinct pathway configurations that drive value chain upgrading. Furthermore, different modes of hard technology innovation may have varying direct effects on market competitiveness and indirect impacts through value chain upgrading. Therefore, it is essential to deeply unravel the complex causal relationships between hard technology innovation, value chain upgrading and corporate market competitiveness.
Previous research largely neglects the direct and indirect effects of diverse pathways of hard technology innovations’ impact on market competitiveness from a configurational perspective. It does not analyse the complex mechanisms and effects of different innovation modes directly or indirectly operating to support value chain upgrading. As conventional methods cannot effectively examine such intricate mediating relationships, we adopt the configurational perspective and QCA methods inspired by Du et al. (2024) to examine the multifaceted causal mechanisms behind hard technology innovation and value chain upgrading. We also employ traditional regression analysis to explore the intricate mediating effects across diverse hard technology innovation paradigms, value chain upgrading and market competitiveness.
In summary, from the configurational perspective, this study constructs a complex mediating model where hard technology innovation drives value chain upgrading and subsequently influences corporate market competitiveness. First, we investigate the configurational effects of interactive hard technology innovation components and determine the innovation modes that can facilitate value chain upgrading through diverse mechanisms. Second, we analyse how different hard technology innovation modes affect market competitiveness through the mediating role of value chain upgrading to identify the innovation configurations that can simultaneously boost value chain upgrading and enhance corporate market competitiveness.
Fig. 1 illustrates our theoretical model.
Configurational analysis of hard technology innovation-driven value chain upgradingSample selection and data sources
Semiconductors are the core foundation of the information technology industry, and determine the technological level, development speed and innovative capacity of electronic products, communication networks and the entire digital economy. In-depth analysis of hard technology innovation in this sector can reveal how technological advancements translate into market advantages, offering strategic insights for China to enhance its competitiveness in the global high-tech market. This study focuses on semiconductor companies listed on the Shanghai and Shenzhen A-share market from 2010 to 2022.
Enterprise data are sourced from multiple channels: (1) the patent database of the China National Intellectual Property Administration, the Wind database, the China Stock Market & Accounting Research database and listed companies’ publicly disclosed information; (2) national technology awards, standards and types/quantities of breakthrough innovations were collected via Python web scraping; and (3) we manually compiled the patent sharing value degree (calculated based on patent co-ownership and technological contribution) from the official incoPat website. The enterprise data screening process involved the following steps: (1) verifying industry classification based on the China Securities Regulatory Commission 2012 Industry Classification Guidelines, (2) defining the research timeline (2010–2022) and (3) excluding samples marked as ST/PT (delisted risk warnings), financially insolvent companies and those with incomplete data. To minimise outliers, all continuous variables were winsorised at the 1 % level on both upper and lower tails. After this process, 1541 unbalanced panel records were retained.
Research methodologyRagin and Strand (2008) explore the driving mechanism of hard science and technology innovation on value chain upgrading using the dynamic QCA method. Compared with standard QCA or fuzzy-set QCA (Fiss, 2011), the advantage of dynamic QCA is its ability to reveal the complexity of causal relationships’ evolution over time (Greckhamer et al.2018). It is particularly suitable for examining the industrial upgrading process with path-dependence and stage-specific characteristics. The impact of hard technology innovation on the value chain is not achieved overnight as a time-lag effect exists in technology accumulation, diffusion and co-evolution, which is difficult for standard QCA to capture (Liu, Zhang & Sun, 2025). This study employs dynamic QCA to reflect the temporal evolution of driving conditions in real-world scenarios more accurately.
In terms of operationalisation, the temporal dynamics are determined using a phased lag design in which the sample is divided into multiple stages according to the time series to analyse the impact of the combination of hard technology innovation factors in the previous period (T − 1) on the value chain upgrading in the current period (T). This clear design of the chronological order provides a stronger basis for inferring the causal relationship that hard technology innovation leads to value chain upgrading and effectively alleviates endogeneity concerns such as reverse causality caused by value chain upgrading leading enterprises to increase innovation investment. This method identifies the sufficient condition combinations for achieving value chain upgrading and reveals the dynamic laws of its evolution. Introducing the time dimension enables us to delve deeper into how hard technology innovation promotes industrial upgrading through multiple equivalent but time-varying paths, providing a scientific basis for developing phased and dynamic industrial policies.
Variable designResult variableValue chain upgrading (VC) refers to the process by which enterprises or industries extend from low-value-added processing and manufacturing links to high-value-added links such as R&D, design, marketing, branding and services through technological innovation, process optimisation, brand building and improved service quality, subsequently climbing to a more dominant position in the GVC (Dindial, Clegg & Voss, 2020). The key indicator for measuring VC upgrading is the value-added rate (Chawla & Kumar 2023), which reflects the enterprise’s ability to create new value in production activities. Industrial added value includes labour compensation, fixed asset depreciation, net production taxes and operating surplus, which represent the total amount of newly created value by the enterprise. The value-added rate is usually defined as the ratio of industrial added value to industrial gross output value (or operating income). A higher ratio signifies a greater proportion of value created by the enterprise. This indicates stronger control over core technologies and key links, more prominent independent innovation capabilities and profitability, reflecting a higher position in the value chain and more significant upgrading.
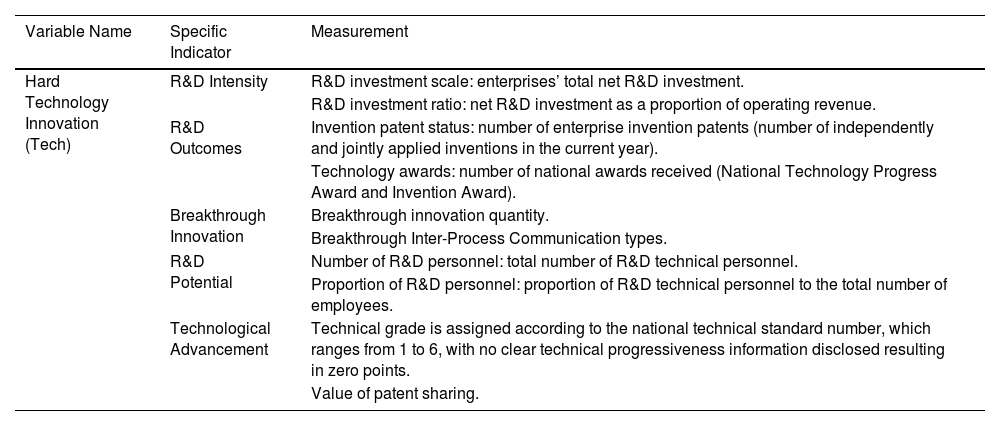
Antecedent variablesThe evaluation of hard technology innovation (Tech) requires a comprehensive consideration of technological novelty, commercialisation potential and long-term contributions. We construct a hard technology innovation index from innovation driving force, market transformation ability and sustainable development ability dimensions (Table 2). Each indicator’s selection is based on classic and cutting-edge research in the fields of innovation management and technological economics, ensuring theoretical and empirical validity in innovation performance and value chain upgrading.
Hard technology innovation index system variable measurement.
Innovation driving force reflects a company’s input–output capabilities, including R&D intensity and R&D outcomes. R&D intensity has been widely proven to be a key variable in predicting a company’s long-term innovation performance, and its investment level directly affects technological accumulation and productivity improvement (Zhao, Sun & Feng, 2021). The number of patents and scientific and technological awards measures R&D outcomes as an effective proxy variable reflecting technological innovation output that is significantly correlated with a company’s market value. As external authoritative recognition, scientific and technological awards effectively identify breakthrough achievements with significant impact (Shirahada & Hamazaki, 2013). Market transformation ability focuses on the capacity of technology to leap into the market, with breakthrough innovation at its core. Breakthrough innovation is the key for enterprises to achieve disruptive breakthroughs, dominate emerging markets and enhance their positions in the GVC (Zhong et al., 2024). Sustainable development ability reflects firms’ long-term innovation capacity, including R&D potential and technological advancement. We quantify R&D potential by R&D personnel as high-quality human capital is the core element driving complex technological problem-solving and achieving knowledge spillover (Lin, 2014). Technological advancement is characterised by technology level and the degree of Hexiang value. Technology level can effectively identify the direction of cutting-edge technologies. As a comprehensive patent quality indicator, the Hexiang value degree has been demonstrated as significantly correlated with technological control and commercial value (Meyer & Subramaniam, 2014).
To objectively quantify the significance of each indicator, we use the entropy weight method to determine weights, calculating the degree of variation in each indicator’s observed data. The greater the difference in the indicator data, the smaller its entropy value, which means that the indicator conveys more information in the comprehensive evaluation and should account for a higher weight. This process is entirely data-driven, avoiding the interference of subjective human factors and ensuring the objectivity and accuracy of weight allocation. This makes the index construction process highly transparent, and the evaluation results can produce the value of hard technology and its long-term impact on the economy and society more accurately.
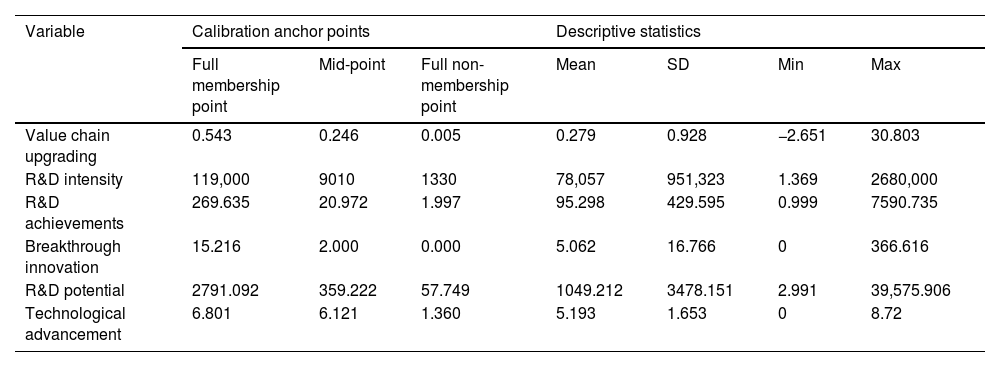
Variable calibration and descriptive statisticsTo enhance the theoretical basis for selecting calibration points, we determine the calibration anchor points using the principles of excellence and typicality, combined with theoretical logic. Setting the 95th percentile as the full membership point is intended to identify excellent performers with significant advantages in dimensions such as value chain upgrading. These enterprises demonstrate innovation capabilities or performance levels that far exceed the industry average, conforming to the definition of high performers in the theory. In contrast, the 5th percentile represents non-performers at a developmental disadvantage. Their resource input or output capabilities are severely insufficient and barely meet the basic theoretical expectations for effective participation or successful upgrading; therefore, it is set as the full non-membership point. As the mid-point, the 50th percentile corresponds to typical enterprises’ state, which are neither significantly better nor significantly worse than the industry norm, with a membership degree of 0.5, reflecting the uncertain boundary of set membership. This calibration strategy not only considers the characteristics of data distribution but also aligns with the logic of dividing qualitative differences in the theory, ensuring that the fuzzy-set transformation process has practical significance rather than relying solely on statistical distribution. Table 3 presents the variable calibration rules and descriptive statistics.
Variable calibration and descriptive statistics (N = 1541).
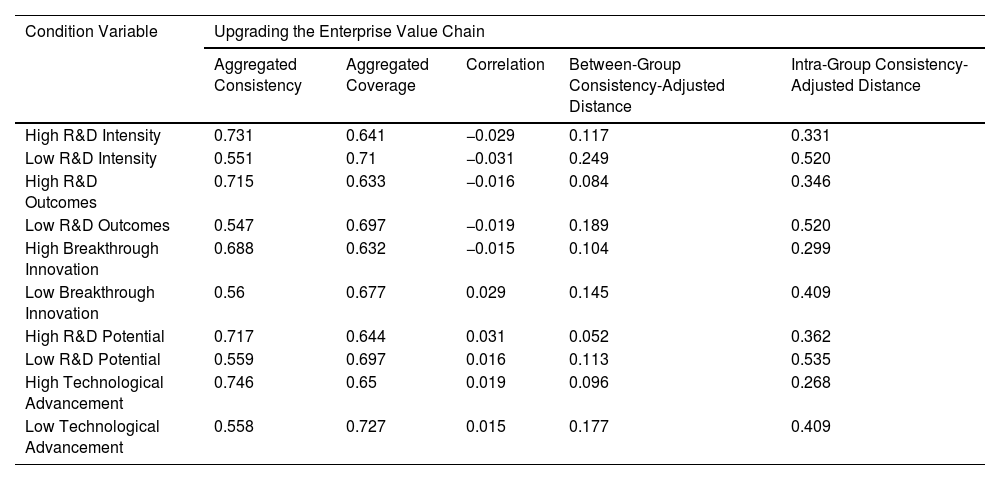
In the QCA analysis using panel data, it is necessary to test the necessity of each conditional variable separately. The judgement criterion is that when the aggregated consistency level of a conditional variable and its negation set is higher than the 0.9 threshold and the correlation is greater than 0.5, it is considered to be a necessary condition for the outcome variable. In addition, to ensure the reliability of the aggregated consistency, it is essential to assess whether time and case effects are evident for the necessary conditions through consistency-adjusted distance. When the adjusted distance is <0.2, the accuracy of the aggregated consistency is higher, providing stronger support for the judgement result. In situations where the adjusted distance is greater than 0.2, the necessity of the conditional variable requires further analysis. The results of the necessity analysis are shown in Table 4. The aggregated consistency of individual conditional variables and their negation sets is all lower than 0.9. However, the inter-group consistency adjusted distance of low R&D intensity is greater than 0.2, which requires further testing.
Analysis of necessary conditions.
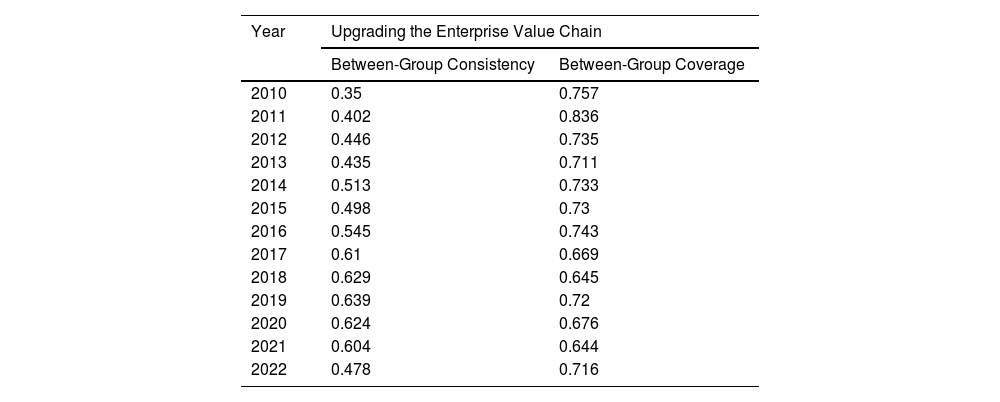
Further identification of the inter-group consistency and coverage of low R&D intensity in each year is conducted, and the results are shown in Table 5. The results reveal that the inter-group consistency level is below 0.9, and the correlations are all below 0.5, indicating no necessary relationship. Therefore, no necessary conditions for value chain upgrading are evident.
Inter-group results for low R&D intensity consistency adjustment distance greater than 0.2.
To clarify the sufficiency of different combinations of factors for enterprise value chain upgrading, we employ R to conduct a conditional configuration analysis of the panel data. Referencing existing research (Greckhamer, Furnari et al., 2018) and considering the context, we use the intermediate solution as the main basis for analysis, conducting comparative verification with the complex solution. The core necessary conditions are identified through the intersection of the two, enhancing the robustness of the conclusions and the theoretical interpretability. Compared with the issue that the parsimonious solution may introduce counterfactual assumptions, the intermediate solution effectively balances solution complexity and real-world interpretability while maintaining the integrity of the theoretical logic (Thiem, 2015). This is more suitable for exploring the multi-factor synergistic mechanism.
In the process of configurational analysis, the truth table construction follows the standard QCA algorithm process. First, the combinations of causal conditions are screened based on case frequency and consistency level. We set the frequency threshold to 1, meaning configurations that appear at least once are included in the analysis to avoid omitting potentially relevant paths. The original consistency threshold is set to 0.8, which is used to identify condition combinations with strong sufficiency. Meanwhile, the partial redundancy index (PRI) threshold is set to 0.59 to distinguish non-subset noise in the sufficiency relationship (Skaaning, 2011). A PRI value higher than 0.5 is generally regarded as an important basis for supporting the sufficiency relationship, and we use 0.59 as the critical value to further improve the rigour of judgement. The truth table generated based on the above criteria is presented in Appendix Table A.1, which lists all logical remainders and causal combinations that meet the threshold requirements, providing an input basis for subsequent Boolean minimisation.
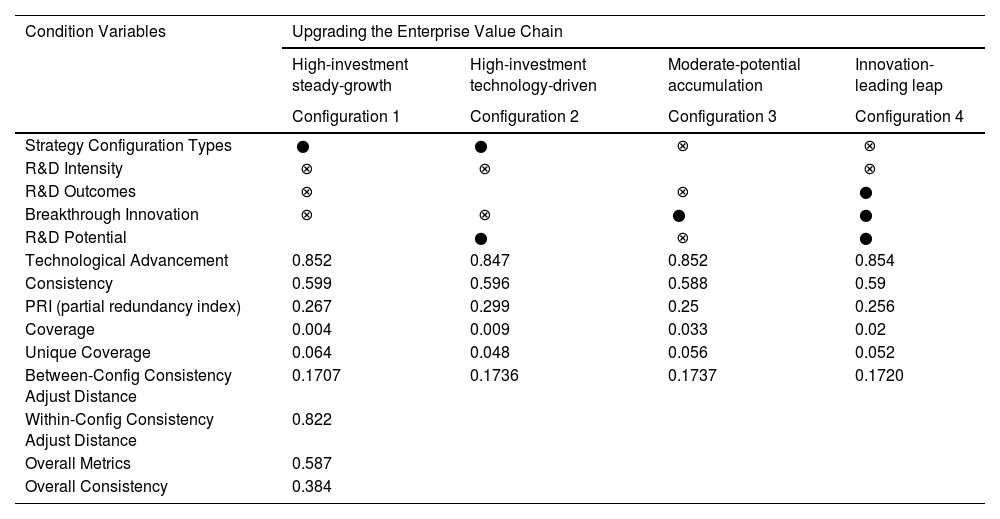
As shown in Table 6 and Fig. 2, four pathways that drive value chain upgrading are identified, all of which exceed the 0.75 threshold for consistency, indicating that these configurations are sufficient conditions for achieving value chain upgrading. Each column represents a potential conditional configuration. The overall consistency is 0.822, meaning 82.2 % of enterprises meeting any of the four configurations exhibit high-level value chain performance. The overall coverage is 0.587, indicating that these four configurations account for approximately 58.7 % of enterprise value chain upgrading cases. Based on these configurations, we further identify differentiated relationships between condition variables and their influence on driving value chain upgrading.
(1) High-intensity steady-growth mode (Configuration 1)
Configuration analysis.
Note: ● and ⨂ indicate the presence and absence of core conditions, respectively; blanks indicate that either presence or absence is acceptable (i.e. fuzzy conditions).

The consistency of this configuration is 0.852, and the coverage is 0.267, explaining 26.7 % of the upgrading cases. Its core condition is R&D intensity, indicating that even if a company lacks R&D achievements, technological breakthroughs or R&D potential in the short term, it can still achieve value chain upgrading by relying solely on continuous high-intensity R&D investment. This path reflects the core logic of resource allocation theory, which asserts that a company cultivates an accumulation effect by strategically allocating a large amount of resources to R&D activities. High-intensity investment itself constitutes a strategic signal and a process of capability building. Even if it is not immediately converted into explicit output, it can be internalised within the organisation as knowledge reserves, optimised R&D processes and technological trial-and-error experience, progressively improving the company’s technology absorption and transformation capabilities. This mechanism shows that the continuous injection of resources can compensate for capability weaknesses and drive the company to climb from the low- and middle-end of the value chain to high-investment-dependent segments. This configuration is suitable for companies in the technology catch-up stage.
(2) High-intensity technology-driven mode (Configuration 2)
This configuration’s consistency is 0.847, and the coverage is 0.299, explaining 29.9 % of the cases. Its core lies in the dual-driving forces of R&D intensity and technological advancement. This reflects the collaborative capability–resource evolution mechanism in capability development theory. That is, high-intensity investment provides continuous impetus for technological exploration, while technological advancement represents the enterprise’s existing stock of technological capabilities. The combination of the two cultivates a positive cycle of resources empowering capabilities and capabilities guiding resources. Relying on existing technological advantages, enterprises can make R&D investment more targeted and efficient, accelerating technological iteration and product upgrading. Although the achievements and potential do not appear in the short term, the collaborative effect of existing capabilities and resources is sufficient to support the migration to high-value-added segments of the value chain. This path is suitable for enterprises that already have a certain technological foundation and seek to consolidate their leading technological position.
(3) Moderate-potential accumulation made (Configuration 3)
The consistency of this configuration is 0.852, and the coverage is 0.25, accounting for 25 % of the cases. Its core is R&D potential, indicating that even if a company lacks R&D intensity and technological advancement, it can still achieve upgrading through its internal potential. This path aligns with the forward-looking perspective in capability development theory that potential equals capability. R&D potential is manifested in a company’s talent reserve, learning capabilities, innovation culture and future technology acquisition ability, all of which are implicit strategic assets. This enables a company—even under resource-constrained conditions—to identify technological opportunities, integrate external knowledge and achieve leapfrog learning. This mechanism of compensating for resources with potential reflects a company’s overcoming static resource constraints by building dynamic capabilities and gradually climbing up the value chain. This path is commonly seen in start-up companies or those with limited resources but high growth expectations.
(4) Innovation-driven leap mode (Configuration 4)
The configuration’s consistency is 0.854, and the coverage is 0.256, accounting for 25.6 % of the cases. Its core is the collaborative effects of breakthrough innovation, R&D potential and technological advancement. This path embodies the essence of strategic adaptation theory, which contends that enterprises actively lead market and technological paradigms through strategic innovation. Acting as a disruptive lever, breakthrough innovation shatters the existing competitive landscape. Technological advancement ensures the feasibility and leading position of innovation achievements, while R&D potential guarantees innovation sustainability. These three elements form a strategic closed-loop of innovation-driven, capability-supported and continuous adaptation. Even with relatively low R&D investment, precise strategic planning enables enterprises to leverage significant changes with limited resources and achieve non-linear leaps in the value chain. This path is suitable for leading enterprises that have technological foresight and are committed to creating new markets or reshaping industry rules.
Regression analysis of the impact of hard technology innovation and enterprise value chain upgrading on market competitivenessPrevious studies have identified four modes of hard technology innovation that enable enterprise value chain upgrading. Building on these findings, we further employ regression analysis to explore the complex relationships between hard technology innovation, value chain upgrading and enterprise market competitiveness. This analysis clarifies the innovation modes that not only drive value chain upgrading but also enhance market competitiveness and which modes may reduce market competitiveness despite their positive impact, although contributing to value chain upgrading. The objective is to disentangle how different hard technology innovation configurations influence market competitiveness by affecting value chain transformations, providing actionable insights for strategy formulation.
Model constructionDue to potential truncation or restriction in the dependent variable (enterprise market competitiveness), where certain firms’ market performance may reach upper or lower bounds and fail to accurately reflect their true levels (Kim, Choe & Kwak, 2019), traditional linear regression models such as ordinary least squares may produce biased estimates. In contrast, the Tobit model can effectively address such censored or restricted dependent variables by jointly accounting for observed values and unobserved zero or censored observations, yielding more reliable parameter estimates (Shonkwiler & Yen, 1999). Moreover, the Tobit model can better capture the non-linear relationships and heterogeneous effects that may exist in the process by which hard technology innovation influences market competitiveness (Rodil, Vence & Sánchez, 2016). This makes it an ideal tool for understanding how technological innovation promotes firms’ competitive advantages through diverse pathways. Therefore, we employ the Tobit model to analyse the relationship between hard technology innovation modes, value chain upgrading and market competitiveness. The model is specified in Eqs. (1) and (2) as follows:
where Marketit is the dependent variable, representing the enterprise’s market competitiveness, Techit is the independent variable, representing the four hard technology innovation modes, εit is a random perturbation term, i represents the enterprise and t represents the year.Descriptive analysisDependent variable: market competitiveness (Market)
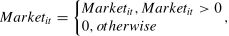
Previous research commonly uses a firm’s market share within its industry as a direct measure of competitiveness (Tang, Chen et al., 2023). While market share reflects a firm’s sales capability and market position, it does not fully capture the complexity of market competitiveness. We adopt the Lerner Index to measure market competitiveness, following the methodology proposed by Arianpoor (2025). The Lerner Index provides a precise gauge of a firm’s pricing power (the extent to which a firm can set prices above marginal costs to secure excess profits). This metric not only captures a firm’s market position but also incorporates elements of market structure and strategic behaviour, offering a more comprehensive indicator of competitiveness than market share alone. The Lerner Index is calculated as follows:
which reflects the markup over costs, encapsulating a firm’s ability to influence pricing in competitive and non-competitive market conditions.Independent variables
The primary independent variables are the four hard technology innovation modes identified in the previous sufficiency analysis as drivers of value chain upgrading, which are quantified by each firm’s set membership scores for each hard technology innovation configuration. Higher scores indicate a firm’s stronger alignment with a specific innovation mode, reflecting the degree to which the firm belongs to that particular hard technology innovation ecosystem.
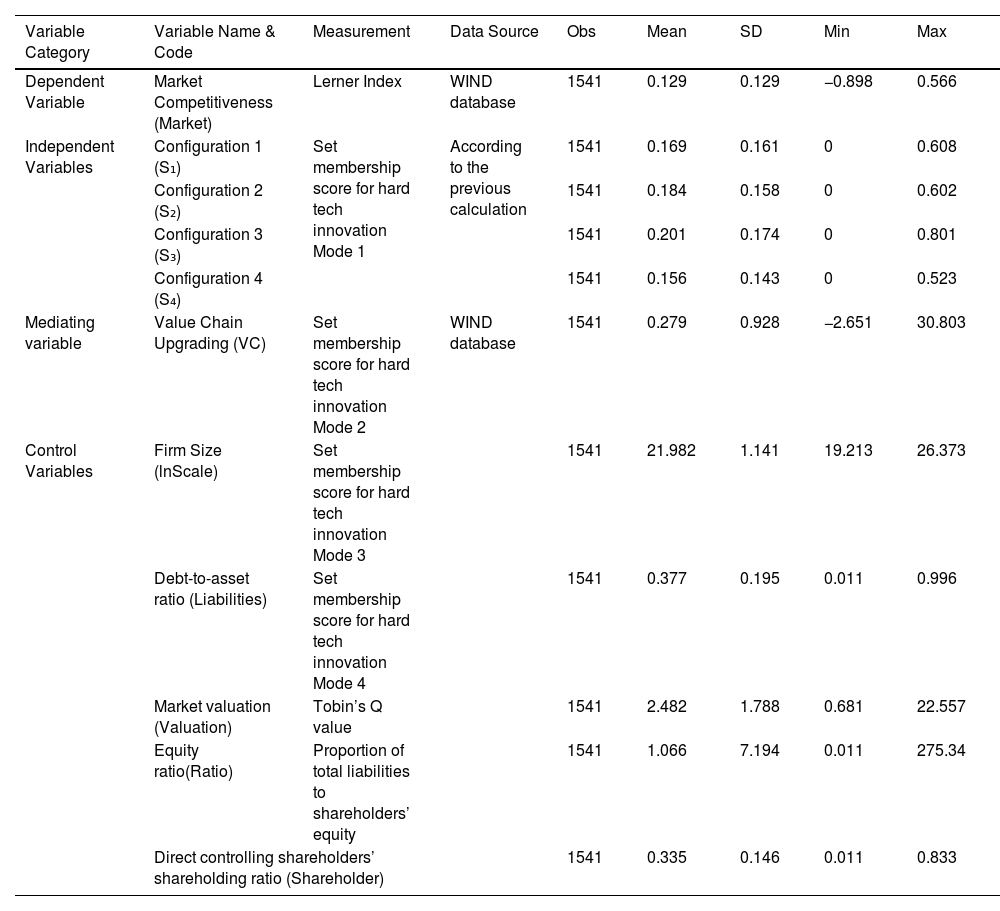
Control variablesIn examining how the four hard technology innovation modes influence market competitiveness, we control for firm characteristics and corporate governance variables. Firm characteristics include firm size (logged total assets), debt-to-asset ratio, market valuation (LOG abnormal return) and ownership ratio (state vs. private ownership). Corporate governance variables primarily focus on the major direct shareholders’ shareholding ratio.
See Table 7 for each variable’s specific measurement methods and descriptive statistics. Among them, the minimum value of Market is −0.898 because, in empirical calculations, when an enterprise faces fierce competition or is loss-making, the price may fall below the marginal cost, resulting in a negative Lerner index. This means that the enterprise’s pricing not only fails to cover the cost but is even significantly lower than the marginal cost, which may result from price wars, over-capacity or short-term subsidy strategies. A negative Lerner index reflects the extreme situation in which the market is close to perfect competition or there abnormal competitive behaviours occur. A more negative value indicates the enterprise’s weaker market power and greater competitive pressure.
Descriptive statistics.
To prevent possible high correlations between variables from causing distorted parameter estimates or inflated standard errors, we conduct a multicollinearity test on the variables before the benchmark regression analysis. The test results are presented in Table 8. The results indicate that all variables’ variance inflation factors (VIFs) are below 5, with a mean VIF of 2.060, which is far below 10. This confirms no serious multicollinearity problem between the variables.
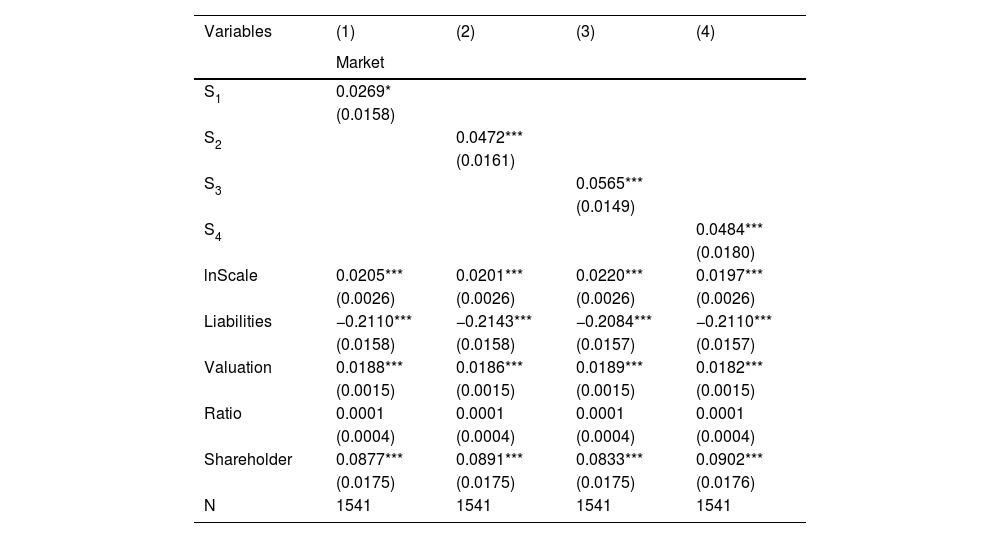
Benchmark regressionThe impacts of the four hard technology innovation modes on enterprises’ market competitiveness are presented in Table 9. The regression results indicate that all types of hard technology innovation modes have a significant positive effect on market competitiveness. This verifies that value chain upgrading through technological drive is an effective path for enhancing enterprises’ competitive advantages.
Impact of hard technology innovation configuration on enterprise market competitiveness.
Note: Values in parentheses are standard errors. *, ** and *** denote significance at 10 %, 5 % and 1 % levels, respectively.
From an economic perspective, referring to the standardised coefficients, the innovation-driven Leap mode has the strongest effect (β=0.0565). This means that for every one-standard deviation (SD) increase in such enterprises’ hard technology innovation configuration, their market competitiveness can increase by approximately 5.65 % of the SD unit on average. This level of elasticity has practical significance in strategic management practice. For example, in high-tech manufacturing or strategic emerging industries, such enterprises are more likely to seize high-end market shares through breakthrough technology deployment and improved pricing power and brand premium to achieve asymmetric competitive advantages. In contrast, although the impact of the high-intensity steady-growth mode is relatively small (β=0.0269), it emphasises resource stability and technological continuity. This enables enterprises to maintain market shares and operational efficiency in mature markets, reflecting the strategic logic of seeking progress while maintaining stability.
The results further enrich the theoretical discussion on the relationship between technological strategy and corporate performance. The existing literature generally emphasises the linear relationship between R&D investment and innovation output (Zhu & Xu, 2022). In contrast, by identifying multiple innovation configurations, this study echoes the proposition of the configuration view, which holds that the strategic value of technological innovation not only depends on the intensity of investment but also on the systematic matching of resources, capabilities and organisational paths (Guo, Zhang et al., 2023).
In particular, the characteristics of high R&D, strong collaboration and a forward-looking culture, as embodied in the innovation-driven leap mode, align with the mechanism by which technology leaders reconstruct market rules in the disruptive innovation theory (Wang, Qureshi et al., 2022). Meanwhile, the moderate-potential accumulation mode supports the DCV, which asserts that small and medium-sized enterprises (SMEs) can build local competitive advantages in specific niche markets through gradual knowledge accumulation.
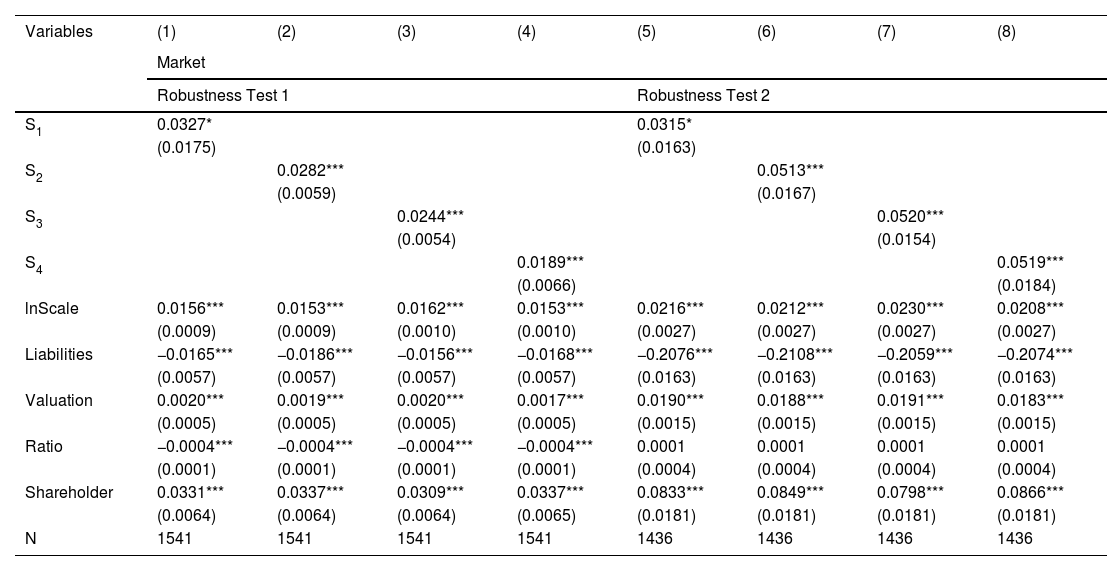
Robustness testsTo verify the robustness of the influence of the four hard technology innovation modes on enterprises’ market competitiveness, we conduct robustness tests from two perspectives, the explained variable’s measurement and the sample’s time range. First, we replace the explained variable. Using the Lerner index to measure market competitiveness in the benchmark regression, a multi-dimensional comprehensive competitiveness index is constructed in the robustness test. This index covers market share, financial health (net profit, cash flow), operational efficiency (inventory turnover rate) and non-financial performance (social responsibility, corporate reputation). A comprehensive evaluation is performed through the weighting method. Second, we adjust the research time window, shortening the sample period from 2010 to 2022 to 2012–2022 to focus on the influence of hard technology innovation against the backdrop of the rapid development of mobile internet and new-generation information technologies to enhance the relevance of the estimation to the economic context.
As shown in Columns (1)–(8) of Table 10, the regression coefficients of the four hard technology innovation modes remain statistically significant and have the same sign direction under the two robustness tests, indicating that the benchmark results are highly robust. More importantly, the economic significance of the coefficients remains significant, validating that various types of hard technology innovation continuously enhance enterprises’ comprehensive competitive advantages in a complex market environment, particularly by improving financial stability, operational efficiency and social reputation. This finding not only verifies the statistical reliability of the innovation effect but also shows that hard technology innovation is a key path for enterprises to build long-term competitiveness from a strategic perspective during the period of technological transformation.
Robustness tests.
Note: Values in parentheses are standard errors. *, ** and *** denote significance at 10 %, 5 % and 1 % levels, respectively.
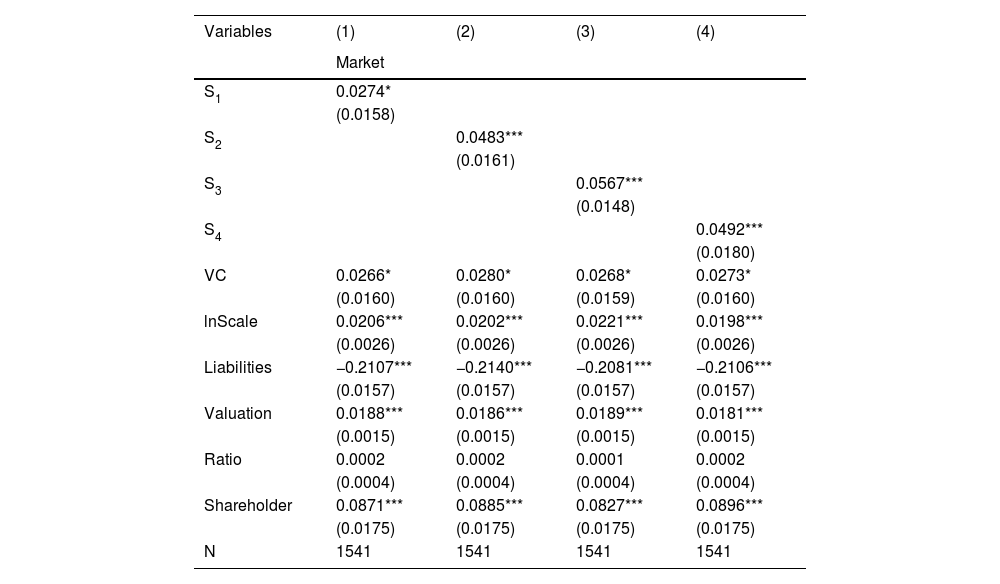
To further analyse the influence and mechanisms of the four hard technology innovation modes on enterprises’ market competitiveness, we introduce enterprises’ value chain upgrading into the regression analysis based on the benchmark regression. This analysis aims to identify the indirect mechanism through which different hard technology innovation modes enhance enterprises’ market competitiveness by promoting value chain upgrading. The regression results in Table 11 show that the regression coefficients of the four hard technology innovation modes and value chain upgrading are all significantly positive. This indicates that these approaches can significantly drive enterprises to climb towards high-value-added segments of the value chain, enhancing their market positions. This verifies the transmission mechanism of technological innovation-capacity upgrading-performance improvement.
Impact of hard technology innovation modes and value chain upgrading on enterprise market competitiveness.
Note: Values in parentheses are standard errors. *, ** and *** denote significance at 10 %, 5 % and 1 % levels, respectively.
First, the indirect promotion mechanism of the hard technology innovation modes enhances enterprises’ market competitiveness by promoting value chain upgrading. The results in Table 11 show that all four hard technology innovation modes can indirectly enhance competitiveness through this mechanism. Combined with the configuration analysis in Table 6, the high-intensity steady-growth (S1) and high-intensity technology-driven (S2) modes emphasise continuous and high-intensity R&D investment or technological advancement, which reflects the achievement of process optimisation, product iteration and function extension on the basis of consolidating core technological capabilities, advancing the climb to a high end of the value chain. The moderate-potential accumulation (S3) and innovation-driven leap (S4) modes indicate that even if R&D investment intensity is not high, as long as there is strong R&D potential or breakthrough innovation is achieved, the existing technological path dependence can be broken, new markets can be opened up and the value network can be re-structured, promoting enterprises to climb to higher-value-added segments. From an economic perspective, the coefficient of VC ranges from 0.0266 to 0.0273, indicating that for every 0.1-unit increase, the enterprise’s market competitiveness will increase by about 2.7 % on average, demonstrating the significant returns of structural upgrading. This mechanism is consistent with the DCV (Ilmudeen, Bao et al., 2021) that enterprises transform technological innovation into organisational competitive advantages through the sensing–seizing–reconfiguring capabilities.
Second, the direct mechanism of the hard technology innovation modes on enterprises’ market competitiveness is significant. The results in Table 11 reveal that the direct effects of the four modes on market competitiveness are all significantly positive. For S1 (0.0274), it indicates that continuous R&D investment itself sends a signal that the enterprise adheres to long-termism, enhancing customers’ and investors’ confidence, which reflects the contention of signalling theory (Connelly, Certo et al., 2025). S2 (0.0483) reflects that technological advancement, as an existing achievement, can directly enhance product premium and market position. The coefficient of S3 (0.0567) is the highest, indicating that R&D potential has a strong guiding effect on expectations as an embodiment of future value. S4 (0.0492) shows that breakthrough innovation can quickly alter the competitive landscape. These effects persist even after controlling for value chain upgrading, indicating that they do not entirely depend on structural upgrading but directly influence channels such as brand reputation, technological barriers and market expectations.
Conclusion and policy implicationsResearch conclusionsThis study uses Chinese listed semiconductor enterprises from 2010 to 2022 as the research sample. Based on complex systems theory, we construct a five-dimensional framework for hard technology innovation covering R&D investment, R&D outcomes, breakthrough innovation, R&D potential and technological advancement to explore the impact of these factors on corporate market competitiveness through value chain upgrading. To address potential endogeneity and reverse causality issues in integrating QCA with regression analysis, a time-lag design is adopted to mitigate these concerns. Specifically, we consider hard technology innovation and value chain upgrading in period t as antecedents to predict corporate competitiveness in period t + 1, clarifying the chronological logic that cause precedes effect. This lag structure not only strengthens the robustness of causal inferences in regression analysis but also enhances the causal explanatory power of QCA configurational results, preventing the misjudgement of correlation as causation. This design effectively weakens reverse causality bias, providing rigorous chronological support for causal identification in mixed-method research. By combining dynamic QCA and regression analysis, the relevant research findings are threefold.
First, the explanatory power of a single innovation factor for value chain upgrading is limited. The realisation of the value of technological innovation depends on the collaborative matching of multiple factors, which confirms the core view of non-linearity, asymmetry and multiple equivalent paths in the complex systems theory. This finding breaks through the assumption of the input–output linear model in traditional technological innovation research, indicating that the generation mechanism of innovation performance aligns more accurately with configurational logic rather than aggregation logic for high-tech complex systems (Fiss, 2011), emphasising the complementary and structural relationships between factors.
Second, four effective configurational paths driving value chain upgrading are identified; namely, the high-intensity steady-growth mode, the high-intensity technology-driven mode, the moderate-potential accumulation mode and the innovation-driven leap mode. This finding complements existing strategic and innovation literature. Among them, the high-intensity technology-driven mode is similar to the technology leader strategy Teece (2007) proposes, which emphasises constructing technological barriers through high-intensity R&D investment and patent layout. The moderate-potential accumulation mode corresponds to the path of late-comer enterprises achieving catch-up through knowledge absorption and incremental learning (Yap & Rasiah, 2017). This reflects the core logic of the RBV, which posits that heterogeneous resource accumulation determines competitive advantages. The innovation-driven leap mode demonstrates the typical characteristics of the DCV (Hu et al., 2021). Specifically, enterprises can restructure technology and organisational structures to achieve a transition from following to leading. The high-intensity steady-growth mode path indicates that even without significant breakthrough innovations, continuous and stable R&D transformation and system integration capabilities can still promote value chain upgrading. This finding complements the overemphasis on disruptive innovation in traditional literature (Wang et al., 2022), demonstrating that incremental innovation and co-evolution are also important mechanisms for value leaps in complex technology industries such as semiconductors, echoing the view in complex systems theory that minor disturbances trigger structural changes.
Third, all four models significantly enhance enterprises’ market competitiveness, and value chain upgrading has a crucial mediating role, revealing the transmission mechanism of technological innovation–capability improvement–market return. This mechanism validates the basic logic in GVC theory that capabilities determine position and position determines returns (Gereffi, Humphrey & Sturgeon, 2005). Moreover, it indicates that differing types of capability combinations can achieve similar value chain position improvements through differentiated paths, thereby obtaining market returns. This provides a contextual expansion for the RBV and DCV, wherein competitive advantages in highly uncertain and technology-intensive industries stem from the structural coupling and dynamic evolution of multiple elements, rather than a single resource or capability.
Policy implicationsTo enhance the theoretical value and policy practicality of our findings, we propose systematic and differentiated policy suggestions from enterprise, industry and government levels in combination with the four identified innovation modes, exploring their theoretical implications and potential for extrapolation.
Enterprise level: clarify strategic positioning and optimise innovation pathsEnterprises should identify their specific innovation configurations based on their own conditions and formulate appropriate strategies. High-intensity steady-growth mode enterprises should enhance R&D management efficiency, avoid over-emphasising investment but neglecting transformation and establish a market-oriented mechanism for technological achievements. High-intensity technology-driven mode enterprises should focus on overcoming bottleneck technologies, building patent barriers and securing positions to influence technological standards. Moderate-potential accumulation mode SMEs should focus on niche markets and achieve specialised, refined, distinctive and innovative development through industry–university–research collaborations. Innovation-driven leap mode enterprises should build open innovation networks, integrate cross-domain resources and promote system-level leaps. All enterprises should prioritise evaluating their value chain positions, leveraging technological advantages to gain supply-chain dominance, pricing power and brand influence and achieving a closed-loop of innovation value.
Industry level: promote collaborative co-existence and build an innovation ecosystemThe semiconductor industry has strong externalities and high requirements for collaboration, and industry organisations should play a bridging role. In areas with concentrated high-intensity technology-driven mode enterprises, industrial innovation alliances can be established to tackle common technologies and share pilot-scale platforms jointly. For many enterprises with a moderate-potential accumulation mode, technology transfer and achievement incubation platforms should be established to promote the diffusion of mature technologies. In frontier directions led by innovation-driven leap mode enterprises (such as advanced manufacturing processes and new materials), the construction of cross-industry application scenario laboratories can be promoted to accelerate commercialisation. Meanwhile, the industry should promote the establishment of a unified technology evaluation and standard systems to guide resources to high-value innovation activities and avoid low-level duplication.
Government level: implement targeted policies to match innovation modesThe government should abandon the one-size-fits-all support approach and shift to strategically targeted empowerment based on innovation modes. The government should provide long-term and stable policy support for high-intensity steady-growth mode enterprises such as increasing the proportion of additional deductions for R&D expenses, setting up special funds for basic research and providing interest subsidies for science and technology loans to ensure their continuous investment capabilities. Policies and programmes should also support their participation in international standard-setting to enhance their positions in the GVC. For high-intensity technology-driven enterprises, the government should strengthen support for key core technology research, establish challenge-based projects and provide risk-compensation mechanisms. It should also strengthen intellectual property protection, cultivate an institutional environment that encourages innovation and tolerates failure and build public technology service platforms to reduce R&D costs. Policies for SMEs with a moderate-potential accumulation mode should be more flexible. For example, a cultivation plan for potential innovative enterprises can be implemented to provide support such as technical diagnosis, achievement–transformation matching and preferential government procurement. These enterprises should also be encouraged to integrate into leading enterprises’ supply chains to form a pattern of integrated development of large, medium and small enterprises. For innovation-driven leap enterprises, the government should focus on building a high-level innovation ecosystem using strategic platforms such as national laboratories to attract top-notch talent, providing venture-capital guidance funds to broaden equity-financing channels and promote cross-departmental policy coordination to provide institutional experimental space for disruptive innovation.
Research outlook and valueBased on the data of Chinese semiconductor enterprises, this study reveals the evolutionary path of hard technology innovation under specific institutional and industrial backgrounds. Notably, we focus on the single-country context of China; therefore, our conclusions may be influenced by China’s unique innovation system, industrial policy framework and the state-owned enterprise-dominated structure. Therefore, its applicability on a global scale requires further verification. Future research could consider conducting replicative studies in other technological powerhouse countries. For example, future studies could focus on privately-dominated semiconductor enterprises or expand to other high-tech industries such as green energy and biotechnology to systematically examine the universality and boundary conditions of this framework. This will not only contribute to the construction of a more general theoretical model but also enable policymakers to evaluate the effectiveness of policy tools in different institutional environments from a comparative perspective.
The value of this research is its ability to transcend technological determinism or the policy omnipotence theory. In contrast, we propose a policy paradigm of developing policies in a hierarchical and classified manner based on enterprise heterogeneity. The study provides an analytical framework with theoretical depth and practical guidance for examining and advancing industrial competitive advantages in the era of complex technological change.
Ethical approvalThe research included in the current submission does not involve human or animal subjects, or involves pathological reports, etc.
Consent to participateAll authors agree to participate in this study.
Consent for publicationAll authors agree to the publication of this research in the journal. Manuscript is approved by all authors for publication. The authors declare no competing interests.
Declaration of artificial intelligence applicationsThis manuscript does not involve the use of artificial intelligence.
CRediT authorship contribution statementLiang Han: Writing – review & editing, Writing – original draft, Software, Methodology, Conceptualization. Li Yue: Writing – review & editing, Supervision, Project administration, Investigation, Funding acquisition, Data curation.
No conflict of interest exits in the submission of this manuscript, and the manuscript is approved by all authors for publication.
This work was supported by the National Social Science Foundation of China: Research on the Mechanism and Path of “Reverse Innovation Enclave” to Support Regional Collaborative Innovation (No. 24CJY089).