


Nosocomial infections (NI) are a major healthcare problem. National surveillance systems enable data to be compared and to implement new measures to improve our practice.
MethodsA multicentre, prospective, descriptive and observational study was conducted using the data from surveillance system for nosocomial infections created in 2007 for Spanish pediatric intensive care units. Data were collected for one month, between 01 and 31 March, for every study year (2008–2012). The objective was to report 5-years of NI surveillance data, as well as trends in infections by multidrug resistant organisms in Spanish pediatric intensive care units.
ResultsA total of 3667 patients were admitted to the units during the study period. There were 90 (2.45%) patients with nosocomial infections. The mean rates during the 5 years study were: central line-associated bloodstream infection, 3.8/1000 central venous catheter-days, Ventilator-associated pneumonia 7.5/1000 endotracheal tube-days, and catheter-associated urinary tract infections 4.1/1000 urinary catheter-days. The comparison between the 2008 and 2009 rates for nosocomial infections did not show statistically significant differences. All rates homogeneously decreased from 2009 to 2012: central line-associated bloodstream infection 5.83 (95% CI 2.67–11.07) to 0.49 (95% CI 0.0125–2.76), P=0.0029; ventilator-associated pneumonia 10.44 (95% CI 5.21–18.67) to 4.04 (95% CI 1.48–8.80), P=0.0525; and Catheter-associated urinary tract infections 7.10 (95% CI 3.067–13.999) to 2.56 (95% CI 0.697–6.553), P=0.0817; respectively. The microorganism analysis: 63 of the 99 isolated bacteria (63.6%) were Gram-negative bacteria (36.5% were resistant), 19 (19.2%) Gram-positive bacteria, and 17 (17.2%) were Candida spp. infections.
ConclusionsThe local surveillance systems provide information for dealing with nosocomial infections rates.
Las infecciones nosocomiales son un problema de salud pública. Los sistemas nacionales de vigilancia permiten comparar datos e implementar medidas para mejorar la práctica asistencial.
MédodoEstudio multicéntrico, prospectivo, descriptivo y observacional. En 2007 se creó un sistema de vigilancia para infección nosocomial en las Unidades de Cuidados Intensivos Pediátricas Españolas. Se recogieron datos durante un mes (Marzo) por año (2008–2012). El objetivo fue reportar las tasas de los 5 años de vigilancia de la infección nosocomial y la evolución de las infecciones por microorganismos multirresistentes.
ResultadosIngresaron 3667 pacientes. Número de pacientes con infección nosocomial: 90 (2.45%). Tasas medias de los 5 años de estudio: Bacteriemia relacionada con catéter 3.8/1000 días de catéter venoso central, Neumonía asociada a la ventilación mecánica 7.5/1000 días de tubo endotraqueal e Infecciones urinarias asociadas a sonda 4.1/1000 días de sonda urinaria. La comparación de tasas entre 2008 y 2009 no mostró diferencias estadísticamente significativas. Todas las tasas se redujeron homogéneamente desde 2009 a 2012: Bacteriemia relacionada con catéter 5.83 (95% CI 2.67–11.07) a 0.49 (95% CI 0.0125–2.76), P=0.0029; Neumonía asociada a la ventilación mecánica 10.44 (95% CI 5.21–18.67) a 4.04 (95% CI 1.48–8.80), P=0.0525; Infecciones urinarias asociadas a sonda 7.10 (95% CI 3.067–13.999) a 2.56 (95% CI 0.697–6.553), P=0.0817; respectivamente. Microorganismos: 63 de 99 (83.6%) microorganismos aislados fueron bacterias gram-negativas (36.5% resistentes), 19 (19.2%) bacterias gram-positivas y 17 (17.2%) infecciones por Candida spp.
ConclusionesLos sistemas de vigilancia local aportan información para mejorar las tasas de infección nosocomial.
Nosocomial infections (NI) are a major healthcare problem. Children admitted to the pediatric intensive care unit (PICU) are particularly vulnerable to NI because of their immunocompromised and the high prevalence of use of invasive devices during their stabilization. The prevalence of NI in PICU patients is approximately 3–23.6%.1–4 NI increases mortality, morbidity and costs.1,5 Infections with multidrug-resistant microorganisms (MDRO) complicate the treatment and often implicate a worse outcome.6,7 The incidence of MDRO varies according to geographical region and type of intensive care unit. International and national surveillance systems allow to compare data and to implement new measures to improve our practice. Several initiatives have been performed in order to reduce the prevalence of NI as a priority to improve the safety of patient care.4,8,9 Regarding to MDRO, the local information that these surveillance systems provide is especially useful to prevent and treat these infections.
National surveillance of adult patients has been carried out during the last 20 years, by the ENVIN-HELICS database. The Spanish Society of Pediatric Intensive Care Units developed in 2007 a similar program to report NI rates and information about MDRO infections.3 This program noticed the NI situation in our country and in each unit in order to reach better NI rates. Few current data is available about European PICUs and most of data are about a unique hospital.4,10,11 In this article, we aim to report 5-years of NI surveillance data and trends in MDRO infections in Spanish PICUs.
MethodsDesignIt was a multicenter, prospective, descriptive and observational study. The institution's ethical review board of each hospital approved the study and waived the need for informed consent because no added risk to patients was involved and patient anonymity was guaranteed.
SettingSpanish PICU who were part of the group of Infectious Diseases of the Spanish Society of Pediatric Intensive Care. The centers recruitment was progressive from 2007 to 2012. In 2007 a surveillance system for nosocomial infection was created and called VINCIP (“Vigilancia de Infección nosocomial en Cuidados Intensivos Pediátricos”, surveillance of nosocomial infection in Pediatric Intensive Care). The objective of this surveillance system was to collect data about NI and MDRO infections to describe the epidemiology of NI in Spanish PICU.3 The priority of this group was the implementation of the data collection system and its standardization. VINCIP did not performed any intervention in order to decrease NI during this period as a group, but most of PICU implemented measures to decrease NI, especially Center-line associated bloodstream infections (CLABSI) and Ventilator-associated pneumoniae (VAP) and introduced bundles in order to get the zero bacteremia (ZB) and zero VAP (ZVAP) rates. The ZB and ZVAP programs required one or two year to be correctly implemented in most of the units. The protocol differed from the adult one, especially in the NI definitions, regarding the bundles were really near to the adult protocol with low exceptions (subglottic aspiration). In 2008, 9 PICU participated in VINCIP and it increased to 28 PICUs in 2012, which represented around the 80% from all national units.
Study designData were collected one month, between 01 and 31 March, for every study year (2008–2012). The same month for each year was selected to avoid a seasonal bias.
Inclusion criteriaWe included all children admitted to the PICU more than 24h, aged 7 days to 18 years who need almost one of the following external devices: central venous catheter (CVC), endotracheal tube (ET) or urinary catheter (UC).
Exclusion criteriaChildren younger than 7 days or older than 18 years or children admitted with a NI acquired out of the PICU. Children with venous peripheral insertion catheter or permanent venous central catheter (port-a-cathTM Smiths-medical, Inc., BroviacTM Bard Access Systems, Inc.) and arterial catheters were neither recruited.
DefinitionsNI was considered PICU-acquired if it was diagnosed greater than or equal to 48h after PICU admission or within 72h after discharge from the PICU. We defined CLABSI, VAP or catheter-associated urinary tract infection (CAUTI) according to the criteria established by the Centers for Disease Control and Prevention (CDC).12
Definition of MDRO: was defined as acquired non-susceptibility to at least one agent in three or more antimicrobial categories, extensively drug resistance (XDR) was defined as non-susceptibility to at least one agent in all but two or fewer antimicrobial categories and pandrug resistance (PDR) was defined as non-susceptibility to all agents in all antimicrobial categories.13
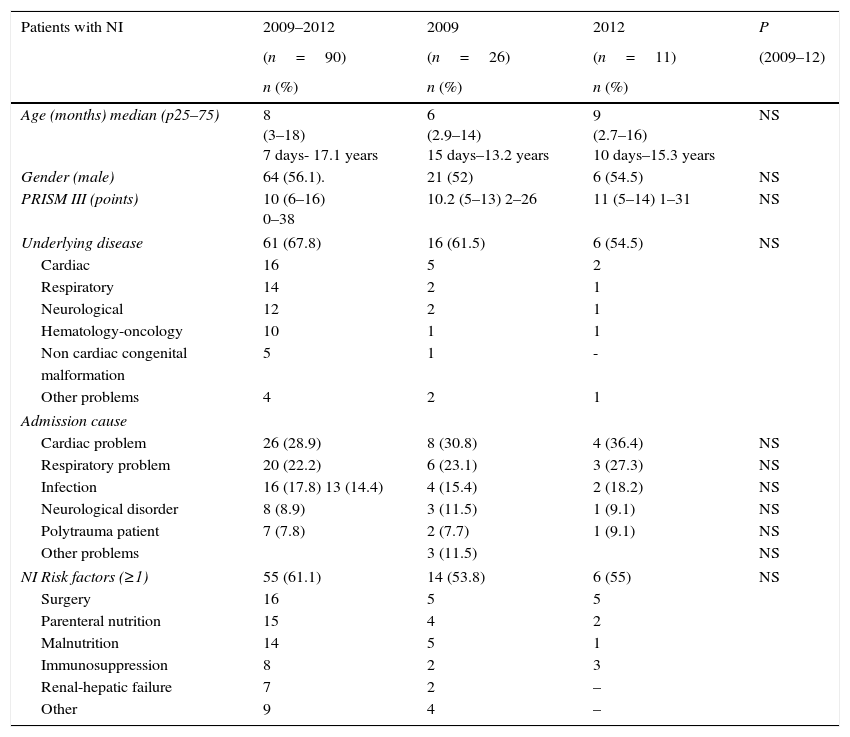
Variables analyzed from cases of NI: Clinical and demographic characteristics (age, sex); severity of illness assessed by the Pediatric Risk of Mortality Score (PRISM) III during the first 24h of PICU stay14; diagnosis at admission; risk factors; NI risk factors (Table 1); time before PICU admission; and outcome based on PICU and hospital length of stay (LOS) and mortality, were recorded.
Clinical data of patients with nosocomial infection (NI). Data comparison between 2009 and 2012 years. NI: nosocomial infection; PRISM: pediatric risk score of mortality.
| Patients with NI | 2009–2012 | 2009 | 2012 | P |
|---|---|---|---|---|
| (n=90) | (n=26) | (n=11) | (2009–12) | |
| n (%) | n (%) | n (%) | ||
| Age (months) median (p25–75) | 8 (3–18) 7 days- 17.1 years | 6 (2.9–14) 15 days–13.2 years | 9 (2.7–16) 10 days–15.3 years | NS |
| Gender (male) | 64 (56.1). | 21 (52) | 6 (54.5) | NS |
| PRISM III (points) | 10 (6–16) 0–38 | 10.2 (5–13) 2–26 | 11 (5–14) 1–31 | NS |
| Underlying disease | 61 (67.8) | 16 (61.5) | 6 (54.5) | NS |
| Cardiac | 16 | 5 | 2 | |
| Respiratory | 14 | 2 | 1 | |
| Neurological | 12 | 2 | 1 | |
| Hematology-oncology | 10 | 1 | 1 | |
| Non cardiac congenital | 5 | 1 | - | |
| malformation | ||||
| Other problems | 4 | 2 | 1 | |
| Admission cause | ||||
| Cardiac problem | 26 (28.9) | 8 (30.8) | 4 (36.4) | NS |
| Respiratory problem | 20 (22.2) | 6 (23.1) | 3 (27.3) | NS |
| Infection | 16 (17.8) 13 (14.4) | 4 (15.4) | 2 (18.2) | NS |
| Neurological disorder | 8 (8.9) | 3 (11.5) | 1 (9.1) | NS |
| Polytrauma patient | 7 (7.8) | 2 (7.7) | 1 (9.1) | NS |
| Other problems | 3 (11.5) | NS | ||
| NI Risk factors (≥1) | 55 (61.1) | 14 (53.8) | 6 (55) | NS |
| Surgery | 16 | 5 | 5 | |
| Parenteral nutrition | 15 | 4 | 2 | |
| Malnutrition | 14 | 5 | 1 | |
| Immunosuppression | 8 | 2 | 3 | |
| Renal-hepatic failure | 7 | 2 | – | |
| Other | 9 | 4 | – | |
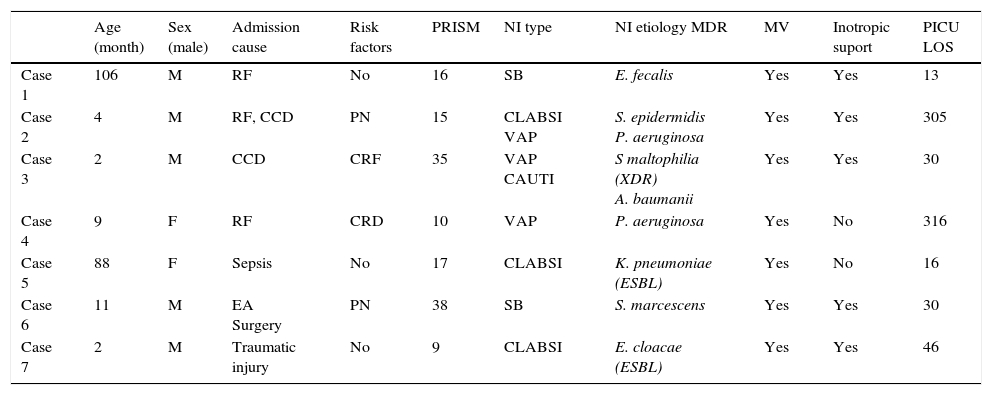
M: Male; F: Female; RF: respiratory failure; CCD: congenital cardiac disease; EA: esophageal atresia; PN: parenteral nutrition; CRF: chronic renal failure; CRD: chronic respiratory disease; PRISM: pediatric risk score of mortality; NI: nosocomial infection; SB: secondary bacteremia; CLABSI: central line-associated bloodstream infection; VAP: ventilator associated pneumonia; CAUTI: catheter-associated urinary tract infection; MDR: multidrug resistant; XDR: extremely resistant; ESBL: extended-spectrum beta-lactamases; MV: mechanical ventilation; PICU LOS: pediatric intensive care length of stay.
NI indicators were: NI prevalence (number of episodes/number of patient-days×100) and CLABSI, VAP and CAUTI rates (number of device-associated infections for an infection site/number of device-days×1000); and device utilization ratio (number of device-days/number of patient-days) for CVC, ventilator and UC. Other related collected data was time to develop a NI from the PICU admission; and device days until NI episode.
During the study period, different UCIPs were incorporated to the zero bacteriemia (ZB) and zero pneumonia (ZP) programs and this data was also collected.15,16 These programs are based on bundles and check-list measures, and follow the national guidelines.
Microorganism isolated and antibiotic resistance was collected for all NI cases. Selected resistant bacteria (RB) were those reported in the protocol of the Estudio Nacional de Vigilancia de Infección Nosocomial-European surveillance of ICU acquired infections ENVIN-HELICS-ICU (hws.vhebron.net/envin-helics/) and published in 2004.17
Statistical analysis: Descriptive statistics included frequencies and percentages for categorical variables and medians and percentiles 25–75 for continuous variables. To compare study periods we used the t test or the Mann–Whitney test when appropriate, for continuous variables. Categorical variables were analyzed by means of the χ2 test. All reported P-values were two-sided; a P value of 0.05 or less was considered to indicate statistical significance. NI rates were compared using tests based on the Normal distribution or exact tests when appropriate.
ResultsDuring all the study period 3667 patients were admitted to the PICUs. The number of patients with a NI diagnosis was 90 (2.45%), with 99 NI episodes. Patients with NI had a median age of 8 months (p25–75 3–18) and 64 (56.1%) were males. Median PRISM III punctuation was 10 points (p25–75 6–16) and the admission cause was variable. There were underlying diseases in 59 patients (65.5%). Risk factors for NI were present in 55 (61.1%) of cases, from these patients 14 (25.4%) had more than two risk factors. Median time to hospital admission prior to PICU was 1 day (p25–75 1–10). All this data did not show statistically significant differences along the time. Patient's characteristics are described in Table 1.
Attending to the outcome, the median time of PICU LOS in patients with NI was 18 (p25–75 12–28), range 2–345, with a median hospital LOS of 31 days (p25–75 20–49), range 8–295. There were 7 patient (6.14%) who died and in three cases it was attributable to de NI. Patient's characteristics are described in Table 2.
Clincial data of patients who died during the study.
| Age (month) | Sex (male) | Admission cause | Risk factors | PRISM | NI type | NI etiology MDR | MV | Inotropic suport | PICU LOS | |
|---|---|---|---|---|---|---|---|---|---|---|
| Case 1 | 106 | M | RF | No | 16 | SB | E. fecalis | Yes | Yes | 13 |
| Case 2 | 4 | M | RF, CCD | PN | 15 | CLABSI VAP | S. epidermidis P. aeruginosa | Yes | Yes | 305 |
| Case 3 | 2 | M | CCD | CRF | 35 | VAP CAUTI | S maltophilia (XDR) A. baumanii | Yes | Yes | 30 |
| Case 4 | 9 | F | RF | CRD | 10 | VAP | P. aeruginosa | Yes | No | 316 |
| Case 5 | 88 | F | Sepsis | No | 17 | CLABSI | K. pneumoniae (ESBL) | Yes | No | 16 |
| Case 6 | 11 | M | EA Surgery | PN | 38 | SB | S. marcescens | Yes | Yes | 30 |
| Case 7 | 2 | M | Traumatic injury | No | 9 | CLABSI | E. cloacae (ESBL) | Yes | Yes | 46 |
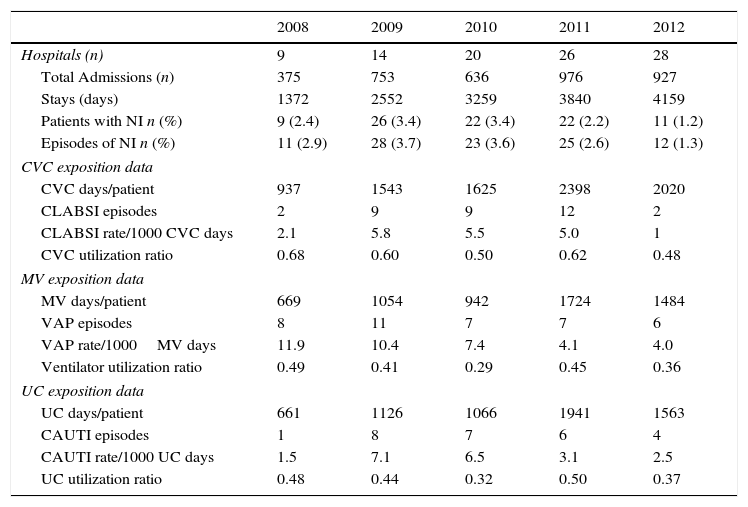
Mean rate of NI the 5 years study were: CLABSI 3.8/1000 CVC-days, VAP 7.5/1000 ET-days and CAUTI 4.1/1000 UC-days. There were a total of 8523 days of CVC exposition, 5873 days of ET exposition and 6357 days of UC exposition; and a total of CVC utilization ratio of 0.578, ventilator ratio of 0.398 and a UC utilization ratio of 0.423. All data is detailed regarding the year of analysis, from 2008 to 2012 in Table 3.
Hospital admissions characteristics. Exposition data, NI rates and device utilization ratio, regarding the type of infection, and attending to the type of the device (CVC, ETT or UC). CVC: central venous catheter, MV: mechanical ventilation, UC: urinary catheter.
| 2008 | 2009 | 2010 | 2011 | 2012 | |
|---|---|---|---|---|---|
| Hospitals (n) | 9 | 14 | 20 | 26 | 28 |
| Total Admissions (n) | 375 | 753 | 636 | 976 | 927 |
| Stays (days) | 1372 | 2552 | 3259 | 3840 | 4159 |
| Patients with NI n (%) | 9 (2.4) | 26 (3.4) | 22 (3.4) | 22 (2.2) | 11 (1.2) |
| Episodes of NI n (%) | 11 (2.9) | 28 (3.7) | 23 (3.6) | 25 (2.6) | 12 (1.3) |
| CVC exposition data | |||||
| CVC days/patient | 937 | 1543 | 1625 | 2398 | 2020 |
| CLABSI episodes | 2 | 9 | 9 | 12 | 2 |
| CLABSI rate/1000 CVC days | 2.1 | 5.8 | 5.5 | 5.0 | 1 |
| CVC utilization ratio | 0.68 | 0.60 | 0.50 | 0.62 | 0.48 |
| MV exposition data | |||||
| MV days/patient | 669 | 1054 | 942 | 1724 | 1484 |
| VAP episodes | 8 | 11 | 7 | 7 | 6 |
| VAP rate/1000MV days | 11.9 | 10.4 | 7.4 | 4.1 | 4.0 |
| Ventilator utilization ratio | 0.49 | 0.41 | 0.29 | 0.45 | 0.36 |
| UC exposition data | |||||
| UC days/patient | 661 | 1126 | 1066 | 1941 | 1563 |
| CAUTI episodes | 1 | 8 | 7 | 6 | 4 |
| CAUTI rate/1000 UC days | 1.5 | 7.1 | 6.5 | 3.1 | 2.5 |
| UC utilization ratio | 0.48 | 0.44 | 0.32 | 0.50 | 0.37 |
In the 2008 analysis, CLABSI and CAUTI rates were lower than 2009 rates with a VAP rate higher. The comparison of 2008 and 2009 rates for CLABSI, VAP and CAUTI did not show significant statistically differences, P=0.1800, P=0.7694 and P=0.1078 respectively. All NI rates homogeneously decreased from 2009 to 2012: CLABSI 5.83 (95% CI 2.67–11.07) to 0.49 (95% CI 0.0125–2.76), P=0.0029; VAP 10.44 (95% CI 5.21–18.67) to 4.04 (95% CI 1.48–8.80), P=0.0525; and CAUTI 7.10 (95% CI 3.067–13.999) to 2.56 (95% CI 0.697–6.553), P=0.0817; respectively.
Regarding CLABSI rate, the decrease was statistically significant just between 2011 and 2012, P=0.0182. For VAP rate, the statistically significant differences were between 2009 and 2011, P=0.0428. In CAUTI, there was a tendency in decreasing this NI rate between 2009 and 2012, P=0.0817. With respect to the 3 types of NI, comparisons between the other years did not demonstrate any special significant difference, unless the rate decreasing trend along the study period (Fig. 1).
 along the study.")
Regarding NI indicators, median time to develop a NI from the PICU admission date was 15 days (p25–75 7–22) for CLABSI, 6 for VAP (p25–75 3–7.5) and 7.5 (p25–75 3–12.2) for CAUTI. Days of device exposition in patients with NI was a median of 11 days (p25–75 3–18) for central venous catheter (CVC), 9 days (p25–75 3–20) of mechanical ventilation (MV), and 12 days (p25–75 5–18) for urinary catheter (UC).
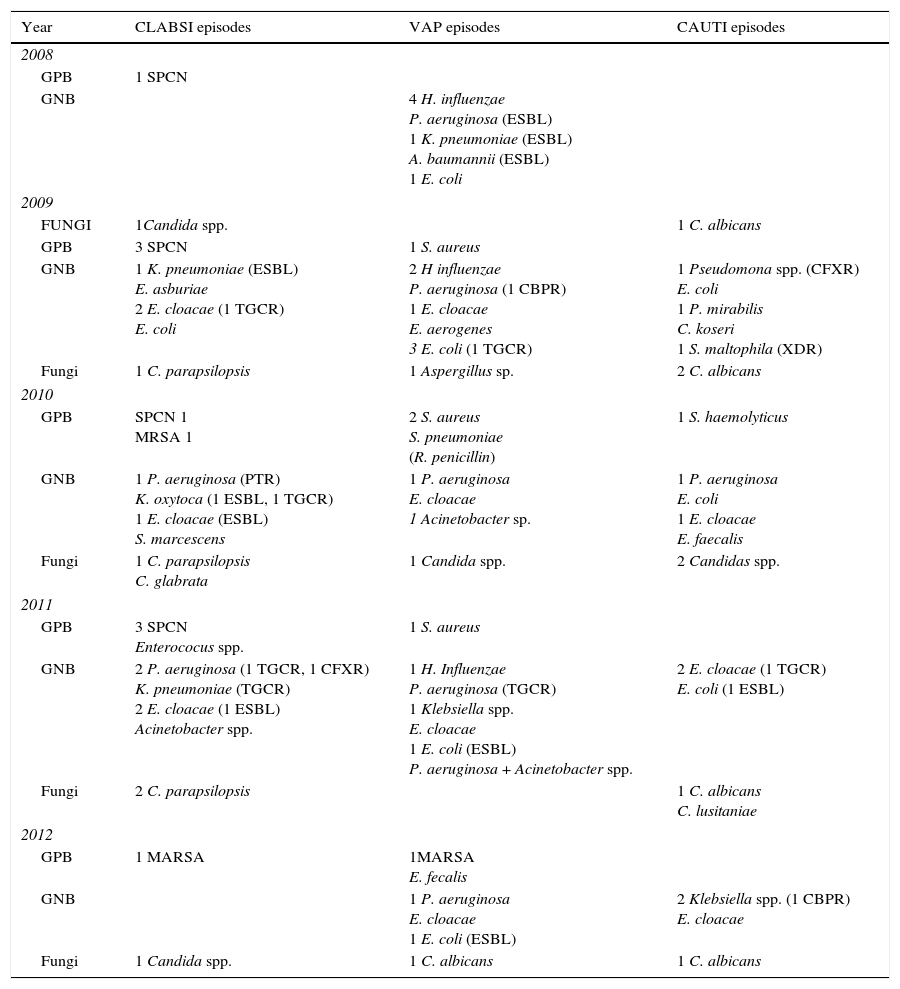
At 2011, the 57.2% of PICU had developed a specific bacteriemia zero program, which increased up to 78.6% at 2012. With respect to the pneumonia zero specific program, it was conducted in the 50% and 60.7% of units in 2011 and 2012 respectively. The microorganism analysis of NI cases, demonstrated that 63 from 99 isolated bacteria (63.6%) were Gram negative bacteria (GNB), 19 (19.2%) Gram positive bacteria (GPB) and 17 (17.2%) were Candida spp. infections. Different species distribution is described in Table 4, regarding the year of analysis. There were not statistically significant differences between the types of microorganisms along the time, P=0.340, (as is represented at Fig. 2). There was some kind of resistance in 23 (36.5%) from all GNB cases, with 10 (15.8% of total GNB infections) extended-spectrum beta-lactamases (ESBL) and 6 resistant to third generation cephalosporin (RTGC) enterobacteriaceaes, as a major cause of GNB resistance. It differed along the study period, but without statistically significance. With respect to GPB, 3 cases were Methicillin-Resistant Staphylococcus aureus (MRSA) and 1 was a Staphylococcus pneumoniae resistant to penicillin. The only microorganism with XDR was Staphylococcus maltophila in 1 case of CAUTI.
Microorganism distribution according to the site of NI and year.
| Year | CLABSI episodes | VAP episodes | CAUTI episodes |
|---|---|---|---|
| 2008 | |||
| GPB | 1 SPCN | ||
| GNB | 4 H. influenzae P. aeruginosa (ESBL) 1 K. pneumoniae (ESBL) A. baumannii (ESBL) 1 E. coli | ||
| 2009 | |||
| FUNGI | 1Candida spp. | 1 C. albicans | |
| GPB | 3 SPCN | 1 S. aureus | |
| GNB | 1 K. pneumoniae (ESBL) E. asburiae 2 E. cloacae (1 TGCR) E. coli | 2 H influenzae P. aeruginosa (1 CBPR) 1 E. cloacae E. aerogenes 3 E. coli (1 TGCR) | 1 Pseudomona spp. (CFXR) E. coli 1 P. mirabilis C. koseri 1 S. maltophila (XDR) |
| Fungi | 1 C. parapsilopsis | 1 Aspergillus sp. | 2 C. albicans |
| 2010 | |||
| GPB | SPCN 1 MRSA 1 | 2 S. aureus S. pneumoniae (R. penicillin) | 1 S. haemolyticus |
| GNB | 1 P. aeruginosa (PTR) K. oxytoca (1 ESBL, 1 TGCR) 1 E. cloacae (ESBL) S. marcescens | 1 P. aeruginosa E. cloacae 1 Acinetobacter sp. | 1 P. aeruginosa E. coli 1 E. cloacae E. faecalis |
| Fungi | 1 C. parapsilopsis C. glabrata | 1 Candida spp. | 2 Candidas spp. |
| 2011 | |||
| GPB | 3 SPCN Enterococus spp. | 1 S. aureus | |
| GNB | 2 P. aeruginosa (1 TGCR, 1 CFXR) K. pneumoniae (TGCR) 2 E. cloacae (1 ESBL) Acinetobacter spp. | 1 H. Influenzae P. aeruginosa (TGCR) 1 Klebsiella spp. E. cloacae 1 E. coli (ESBL) P. aeruginosa + Acinetobacter spp. | 2 E. cloacae (1 TGCR) E. coli (1 ESBL) |
| Fungi | 2 C. parapsilopsis | 1 C. albicans C. lusitaniae | |
| 2012 | |||
| GPB | 1 MARSA | 1MARSA E. fecalis | |
| GNB | 1 P. aeruginosa E. cloacae 1 E. coli (ESBL) | 2 Klebsiella spp. (1 CBPR) E. cloacae | |
| Fungi | 1 Candida spp. | 1 C. albicans | 1 C. albicans |
ESBL: extended-spectrum beta-lactamases; RTGC: third generation cephalosporin resistance; CBPR: carbapenemase ressistance; TGCR: third generation cephalosporin; CFXR: ciprofloxacin resistance; XDR: extremely drug resistant; SPCN: plasmocoagulase-negative Staphylococcus; MRSA: Methicillin-resistant Staphylococcus aureus PTR: piperacillin tazobactam resistance.

As far as we know, this is the first published study with a continued evaluation of PICUs NI rates, in Europe. The prevalence of NI in the first year of the study was low, regarding CLABSI and CAUTI. However, only 9 units participate in data collection during one month, so the results probably would be biased. Due to the low number of centers recruited in the first study year only data from 2009 to 2012 were compared and discussed. Results demonstrated that all NI rates homogeneously decreased from 2009 to 2012. We roughly estimated that the reason was the introduction of BZ and ZP programs in the different units. In 2011 most of the units had implemented this NI control measures. Other explanations for the rate lowered were excluded: cases were collected always in March and during the same study period (one month), so it cannot be explained because the seasonality or recruitment time duration. There were not significant changes in patient's clinical data or in device utilization ratio during the study period that could explain this decrease in NI.
Mean NI prevalence of 2.45% was lower than the total PICU NI (11.9% of patients) reported in a National point-prevalence survey in United States,1 the 5% in a previous multicenter survey conducted in Spain in 20073 and similar to 2.7% reported by Esteban et al.4
In the NI rate follow up, there was a downward trend in the CLABSI rate, obtaining similar results to other reported in adults in Spain15 and similar to the CLABSI rate reported in medical and surgical PICUs in the National Healthcare Safety Network (NHSN).18 Although this improvement, CLABSI mean rate between 2009 and 2011 was 5.4/1000 CVC-days, so measures for control this type of NI needs to be maintained, as hand hygiene campaigns and specific bundles.8,19
VAP rate decreased in 28.8% from 2009 to 2010 and 44.5% from 2010 to 2011, and kept stable in 2012. Although CLABSI rate is usually higher than VAP in PICU we found that in our study VAP rate was the highest along the time in our study.3,9 We think that ZB measures were previous than ZP actions, so they became more integrated at units. VAP rates are far higher than those reported by Brilli et al.,20 or than published by NHSN with a VAP rate of 1.2/1000 ventilator-days in pediatric medical-surgical units.21 An accurate VAP bundles implementation would help to reduce our VAP incidence as has been demonstrated in previous works.22,23
CAUTI rates also showed a remarkable 64.8% decrease from 2009, and specially fall down from 2011. Although CAUTI is described to be the third NI in children, it was the second prevalent form of NI in all but 2011 year in our study. Measures to reduce time of exposition are useful to reduce CAUTI as Saint et al. has demonstrated.24
Different aspects could modify the NI rates so they are difficult to compare in children. Some of these aspects are the setting (cardiothoracic, medical or surgical PICUs), the country socioeconomic level and the previous risk factors of the patients (hematological, surgical). Despite of it, we can conclude that our rates seem to be similar to other recent published data,18 with CLABSI and CAUTI good rates but VAP rate was susceptible to improve. The fact that it was a multicenter study, with an extended national participation, has allowed to standardize diagnosis criteria and to be conscious of the NI impact, with a progressively implementation of the bundles and a consequently decreasing NI rates.
Regarding other NI indicators, median time to develop CLABSI from the PICU admission date was 15 days, which seems to be fewer days than in adult published data.25 More important seems to be the dwell time with a device exposition.23,26 It results in a median of 11 days for CVC, 9 days for MV and 12 days for urinary catheter (UC).
Mortality prevalence was 6.14% and 42.8% of these cases where clearly due to the NI. Other studies report a mean mortality prevalence of 3.3% or 10%,2,4 but it is always difficult to known the NI attributable mortality.
With respect to isolated microorganisms, in our study, GNB have any kind of resistance in 36.5% from all the GNB infections. Most frequent resistance was extended-spectrum beta-lactamases (ESBL) infection in Enterobacteriaceae infections. Our data is according with the reported increase in the incidence of GNB NI and in bacterial resistance, in the last years and all over the world.11,27,28 In Europe it has been registered an important increase of resistance in GNB, and by GPB as MRSA in adult population29 but pediatric patients data is limited. Lee et al. found in a retrospective study, a GPB and GNB NI incidence of 30.4% and 56.2% respectively; with MRSA, carbapenem-resistant Pseudomonas aeruginosa, and ESBL-producing Klebsiella pneumoniae as the major concerns in the study.7 All this data is very similar that reported in our study, with an important fact to be considered, GNB NI is reported to be related with higher mortality rate.29,30
The Candida incidence was low. There were considered 2 cases of VAP by Candida due to there was a broncoalveolar lavage count up to 10,6 with clinical and radiological findings of pneumonia. There were 9 CAUTI episodes by candida, all of them with significant leucocyturie and clinical data of urinary tract infection.
This study has some limitations. First, it was not designed as an interventional study so we only can hypothesize that the rates decrease was secondary to the national interventions to reach BZ and PZ. The implementation of these programs for quality improvement was not at the same time in all PICUs. In addition, multifaceted intervention (Infection control team, hand hygiene educational program and bundles design) was not exactly the same in all hospitals.
Microbiologic surveillance and assessment of antimicrobial resistance is important for dealing with nosocomial infections rates. The surveillance systems set up a patient safety climate with the decrease of the prevalence of NI. Further efforts must be made to bring down NI rates closer to the standard.
FundingThis study was partially funded by the Spanish Society of Pediatric Intensive Care (SECIP).
Conflict of interestThe authors declare no conflict of interest.
Javier Gil, Hospital Cruces (Bilbao). Cinta Téllez and Silvia García, H Virgen Arrixaca (Murcia). Teresa Gili, ParcTaulí (Sabadell). Curro Rodríguez, H Universitario Carlos Haya (Málaga). José Manuel Sánchez, H Universitario (Salamanca). Jose León, H Virgen Candelaria (Tenerife). David Arjona, H Virgen Salud (Toledo). Elia Sanchez y Jose Domínguez, H Virgen del Rocío (Sevilla). Montse Pujol and Yolanda Peña H Valld’Hebrón, Barcelona. Manuel Ortiz Pallarés, H Xeral de Vigo (Vigo). Belén Joyanes and Begoña de Miguel H Clínico San Carlos (Madrid). Cesar Pérez, Ramón y Cajal (Madrid). Sylvia Belda, H 12 de Octubre (Madrid). Juan Casado and Mabel Iglesias, H Niño Jesús (Madrid). Antonio Rodríguez, H Clínico Universitario Santiago (Santiago). Pablo Álvarez, H la Fe (Valencia). Sonia Brió, H Sant Pau (Barcelona). Pilar Azcón and Ana Abril, Virgen de las Nieves (Granada). Jon Igartua, H Universitario Donostia. Teresa Aranda, H La Paz (Madrid). Amaya Pérez Ozcón, Virgen del Camino(Pamplona). Zuriñe Martínez de Compañón, H. Miguel Servet de Zaragoza, Concepción Goñi Complejo Universitario de Navarra (Navarra).