


The VINCat Program: a 19-year model of success in infection prevention and control of healthcare-associated infections in Catalonia, Spain
Más datosFrom 2013 to 2022, annual point-prevalence studies (PPS) of healthcare-associated infections (HAIs) were conducted in 97 long-term care facilities (LTCF) within the VINCat Program in Catalonia, Spain. The objective was to analyze trends in HAIs and antibiotic use to evaluate the burden of HAIs in this setting.
MethodsWe compare PPS data from two 5-year periods. Period 1 (2013–2017) involving 50,378 residents and period 2 (2018–2022) involving 65,997 residents. Variables included demographic characteristics, patient conditions, medical devices on the day of PPS and recent surgery. Source of HAI, causative microorganisms, antibiotics and indication were recorded. HAIs were defined according to ECDC criteria.
ResultsA total of 116,375 residents were included, median age of 82 years (range: 73–88), 56.7% female. Although severe dependency was more common in period 1, the presence of vascular and urinary catheters increased in period 2. Overall, 9943 (8.5%) residents had one or more HAIs. The HAI prevalence rate significantly decreased from 9.3% in period 1 to 8% in period 2, being urinary tract infections the most prevalent HAI in both periods, followed by respiratory tract infections. Escherichia coli was the most frequently identified microorganism. No significant differences in the prevalence of antibiotic use between periods (11.8 vs 12.1 respectively) were found, although there was a shift toward more targeted prescriptions.
ConclusionDespite a significant reduction over the study period, the prevalence of HAIs remains high in LTCFs of Catalonia, affecting 8% of residents. Implementation of infection prevention and control interventions are highly required.
Durante el periodo 2013-2022, se realizaron cortes anuales de prevalencia de infecciones relacionadas con la atención sanitaria (IRAS) en 97 centros sociosanitarios (CSS) adheridos al Programa VINCat. El objetivo fue analizar las tendencias de las IRAS y el uso de antibióticos en este entorno.
MétodosSe compararon los datos de prevalencia anual agrupados en dos periodos de 5 años.
El periodo 1 (2013-2017) incluyó 50.378 residentes y el periodo 2 (2018-2022) a 65.997. Se incluyeron características demográficas, situación del residente, dispositivos invasivos, cirugía reciente, foco de la IRAS, microorganismos causantes, uso de antibióticos e indicación.
ResultadosSe incluyeron un total de 116.375 residentes, con una edad media de 82 años (rango: 73-88); el 56,7% eran mujeres. Aunque la dependencia severa fue más frecuente en el periodo 1, la presencia de catéteres vasculares y urinarios aumentó en el periodo 2. Globalmente, 9.943 (8,5%) residentes presentaban una o más IRAS. La tasa de prevalencia de IRAS disminuyó significativamente del 9,3% en el periodo 1 al 8% en el periodo 2, siendo la infección urinaria la más prevalente en ambos periodos, seguidas de la infección respiratoria. Escherichia coli fue el patógeno identificado con mayor frecuencia. No se encontraron diferencias en el uso de antibióticos entre ambos periodos, aunque se detectó un cambio hacia prescripciones más dirigidas.
ConclusiónA pesar de una reducción significativa, la prevalencia de IRAS sigue siendo muy elevada en los CSS de Cataluña, afectando alrededor del 8% de los residentes. Es necesaria la implementación de intervenciones de prevención y control más efectivas.
Healthcare-associated infections (HAIs) are a common cause of death in older people admitted to long-term care facilities (LTCF). Over the last two decades, the number of people aged 65 and older in Catalonia has increased significantly. In 2000, the population aged 65 and over was around 1.1million. By 2023, this number had risen to approximately 1.6million, representing a significant growth in the elderly population. This increase is attributed to higher life expectancy and lower birth rates, which have resulted in an aging population in the region. In Catalonia, patients requiring long-term care may be admitted to diverse units based on their specific health problems and social conditions.1 A LTCF provides extended care for individuals with chronic illnesses, disabilities, or age-related conditions, offering comprehensive supervision and specialized medical and nursing care.2 Some residents with complex medical needs may remain in LTCFs for extended periods, potentially spanning months to years or until the end of life. In comparison, Centers for Intermediate Care (CIC) focus on specialized geriatric and palliative care, promoting clinical stabilization and autonomy in activities of daily living. The aim is to enable residents to return to their usual environments or to provide end-of-life care. Both LTCFs and CICs are integral components of the service portfolio of the Catalan Health Service for older people. For the purposes of this study, they will collectively be referred to as LTCFs.
The LTCFs in Catalonia have evolved significantly over the past decade. There has been a notable increase in the flow of patients between acute hospital units and LTCFs, with patients often being transferred earlier from hospitals to these facilities. Consequently, LTCFs now manage more complex medical cases, including acute illnesses and infections that previously required hospital referrals.3 This shift has led to an increased risk of HAIs in LTCFs, as patients often undergo invasive procedures, such as urinary or vascular catheters, require intensive care, and may develop complications related to their underlying conditions.4
From 2013 to 2022, annual Point Prevalence Studies (PPS) for HAIs were conducted in LTCF as a part of the VINCat Program. These surveys aimed to assess the prevalence trends of HAIs within these facilities.5
MethodsThis descriptive observational study examined the prevalence of HAIs in LTCFs in Catalonia. The study covered years between 2013 and 2022, comparing two periods: Period 1 (from 2013 to 2017) and Period 2 (from 2018 to 2022). The methodology included two annual PPS, one in May and another in November.
Patient medical records underwent reviews in each participating facility. Simultaneous PPSs were conducted across all facilities to ensure consistency and minimize discrepancies in data collection. While the optimal method would have been to review all admitted patients simultaneously across all participating centers on a specific day, logistical constraints rendered this impractical. Consequently, a 15-day window was designated for data collection. The recommendation was to gather data for each hospital unit within a single day, covering all admitted patients. Each bed in the facility underwent evaluation once, omitting empty beds without revisitation.
Trained healthcare professionals within the facilities conducted the surveillance process. Data collection followed the definitions and methodology outlined in the HALT study from European Center for Disease Control (ECDC).6,7 To identify HAIs, the adapted McGeer definitions for LTCF surveillance were used.8 Healthcare personnel collected HAI source (respiratory, urinary, skin and soft tissue, gastrointestinal, others), antimicrobial treatment, and whether it was empirically initiated or guided by microbiological findings. All administered antibiotics were recorded, including those initiated in acute care units, those for prophylactic purposes (medical or surgical), or others. To define the patient's situation, the Barthel Index, measuring the degree of autonomy in basic activities of daily living (BADL), the Global Deterioration Scale (GDS) of Reisberg, providing a staging of the patient's cognitive status, and the Charlson Index, quantifying comorbidity, were chosen as data points.9–11
Both intrinsic and extrinsic infection risk factors were collected. Intrinsic risk factors included severe dependence in performing BADL, defined as a Barthel index below 40 points, temporal and/or spatial disorientation, the presence of pressure ulcers, dysphagia, and urinary and/or fecal incontinence. Extrinsic risk factors encompassed the use of a vascular catheter, a feeding tube (nasogastric tube or percutaneous endoscopic gastrostomy), urinary catheter, tracheotomy, as well as recent surgery within the last month before the prevalence assessment. COVID-19 was not reported as HAI during the pandemic period. This exclusion was due to the unique and widespread nature of the virus, which posed challenges in distinguishing between community-acquired and healthcare-acquired cases in LTCFs. The focus of our HAIs surveillance remained on traditional infections, such as UTIs and respiratory tract infections unrelated to COVID-19. This decision ensures the consistency and comparability of data with previous years, providing a clear analysis of non-COVID HAIs over time.12
Ethical issuesThe study complied with the principles of the Declaration of Helsinki, with international human rights, and with the legislation regulating biomedicine and personal data protection. All data were treated as confidential, and records were accessed anonymously. This study was approved by the Ethics Committee of Bellvitge Hospital (Ref. PR066/18). Patient data was anonymized, and so the requirement for informed consent was waived by the Ethics Committee for Clinical Research.
Statistical analysisThe data were summarized using frequencies and proportions for categorical variables. For continuous variables, we presented medians and interquartile ranges (IQR) or means and standard deviations, depending on the distribution. To assess differences in percentages, we conducted Chi-square tests or Fisher's tests, as deemed suitable. For continuous variables, comparisons were performed using Two-sample T-test or Wilcoxon Rank-Sum test, as appropriate. To evaluate the strength and direction of the monotonic relationship between prevalences over the years, we performed a Spearman correlation (rho). A significance level of 0.05 was applied to all statistical tests. Additionally, LOESS smoothing was applied to the graphs to enhance the clarity in depicting data trends. The results were analyzed using the R statistical software version 4.2.2, developed by The R Foundation in Vienna, Austria
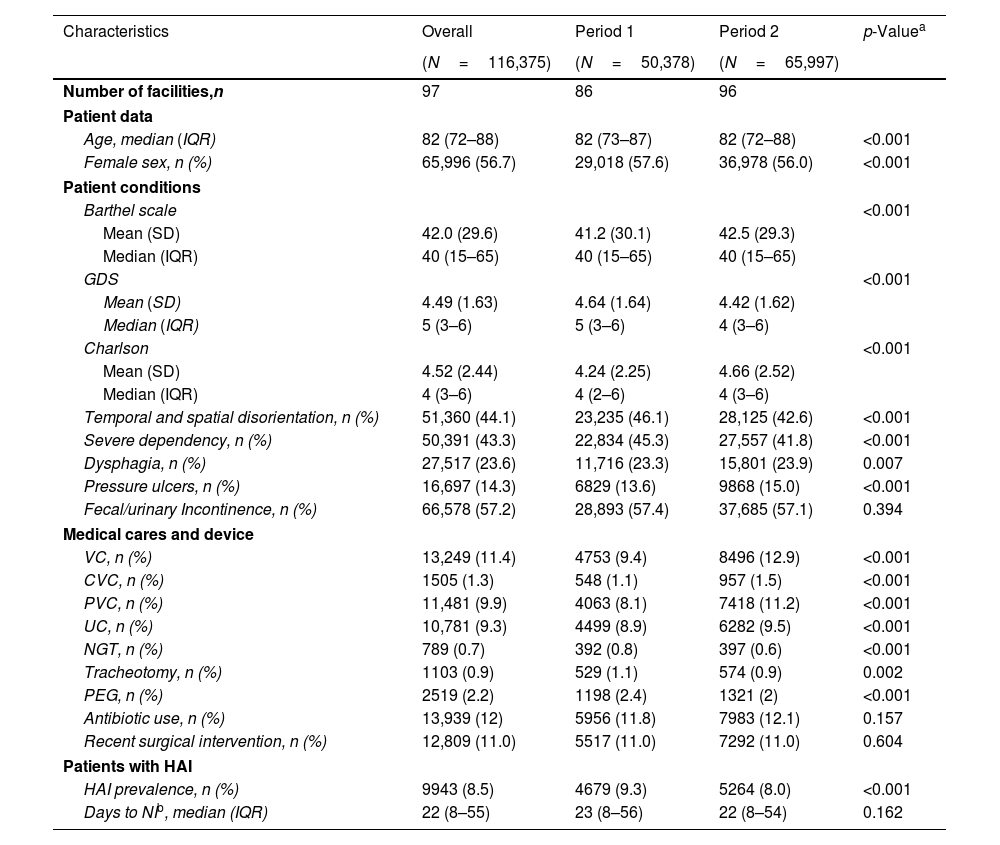
ResultsPopulationThe number of centers participating in the prevalence assessments increased during the study period, rising from 86 to 96 centers. A total of 116,375 residents were included in the study, with 50,378 in Period 1 and 65,997 in Period 2. Additionally, 4772 HAIs were identified in Period 1, and 5321 in Period 2. Characteristics of the population are shown in Table 1.
Patients’ characteristics.
| Characteristics | Overall | Period 1 | Period 2 | p-Valuea |
|---|---|---|---|---|
| (N=116,375) | (N=50,378) | (N=65,997) | ||
| Number of facilities,n | 97 | 86 | 96 | |
| Patient data | ||||
| Age, median (IQR) | 82 (72–88) | 82 (73–87) | 82 (72–88) | <0.001 |
| Female sex, n (%) | 65,996 (56.7) | 29,018 (57.6) | 36,978 (56.0) | <0.001 |
| Patient conditions | ||||
| Barthel scale | <0.001 | |||
| Mean (SD) | 42.0 (29.6) | 41.2 (30.1) | 42.5 (29.3) | |
| Median (IQR) | 40 (15–65) | 40 (15–65) | 40 (15–65) | |
| GDS | <0.001 | |||
| Mean (SD) | 4.49 (1.63) | 4.64 (1.64) | 4.42 (1.62) | |
| Median (IQR) | 5 (3–6) | 5 (3–6) | 4 (3–6) | |
| Charlson | <0.001 | |||
| Mean (SD) | 4.52 (2.44) | 4.24 (2.25) | 4.66 (2.52) | |
| Median (IQR) | 4 (3–6) | 4 (2–6) | 4 (3–6) | |
| Temporal and spatial disorientation, n (%) | 51,360 (44.1) | 23,235 (46.1) | 28,125 (42.6) | <0.001 |
| Severe dependency, n (%) | 50,391 (43.3) | 22,834 (45.3) | 27,557 (41.8) | <0.001 |
| Dysphagia, n (%) | 27,517 (23.6) | 11,716 (23.3) | 15,801 (23.9) | 0.007 |
| Pressure ulcers, n (%) | 16,697 (14.3) | 6829 (13.6) | 9868 (15.0) | <0.001 |
| Fecal/urinary Incontinence, n (%) | 66,578 (57.2) | 28,893 (57.4) | 37,685 (57.1) | 0.394 |
| Medical cares and device | ||||
| VC, n (%) | 13,249 (11.4) | 4753 (9.4) | 8496 (12.9) | <0.001 |
| CVC, n (%) | 1505 (1.3) | 548 (1.1) | 957 (1.5) | <0.001 |
| PVC, n (%) | 11,481 (9.9) | 4063 (8.1) | 7418 (11.2) | <0.001 |
| UC, n (%) | 10,781 (9.3) | 4499 (8.9) | 6282 (9.5) | <0.001 |
| NGT, n (%) | 789 (0.7) | 392 (0.8) | 397 (0.6) | <0.001 |
| Tracheotomy, n (%) | 1103 (0.9) | 529 (1.1) | 574 (0.9) | 0.002 |
| PEG, n (%) | 2519 (2.2) | 1198 (2.4) | 1321 (2) | <0.001 |
| Antibiotic use, n (%) | 13,939 (12) | 5956 (11.8) | 7983 (12.1) | 0.157 |
| Recent surgical intervention, n (%) | 12,809 (11.0) | 5517 (11.0) | 7292 (11.0) | 0.604 |
| Patients with HAI | ||||
| HAI prevalence, n (%) | 9943 (8.5) | 4679 (9.3) | 5264 (8.0) | <0.001 |
| Days to NIb, median (IQR) | 22 (8–55) | 23 (8–56) | 22 (8–54) | 0.162 |
VC: vascular catheter; CVC: central vascular catheter; PVC: peripheral vascular catheter; UC: urinary catheter; NGT: nasogastric tube; PEG: percutaneous endoscopic gastrostomy; Q1: first quartile; Q3: third quartile; HAI: healthcare-associated infection.
The study population had a global median age of 82 (IQR: 72.8–88.0) years, with 56.7% of the cohort being women. The median Barthel Index was 40 (IQR: 15–65), indicating a moderate to severe dependence on assistance for BADL. The median GDS score was 5 (IQR: 3–6), suggesting mild to moderate cognitive impairment. The median Charlson Comorbidity Index was 4 (IQR: 3–6). Temporal and/or spatial disorientation was observed in 44.1% of patients, while 43.3% exhibited severe dependence on BADLs. Dysphagia was present in 23.6% of the patients, 14.3% had pressure ulcers, and 57.2% experienced urinary and/or fecal incontinence. Among invasive procedures, 11.4% of patients had vascular catheters, with peripheral catheters being more prevalent (9.9%) compared to central catheters (1.3%). Urinary catheters were present in 9.3% of residents. Additional interventions included nasogastric tubes in 0.7% of residents, gastrostomies in 2.2%, tracheotomies in 0.9% and recent surgeries in 11%. Residents receiving antibiotic therapy were 12% of the population. Statistically significant differences were observed between the two periods for all factors, except for urinary and/or fecal incontinence, recent surgery, and antibiotic use (Table 1).
Prevalence of HAIsThe prevalence of HAIs decreased from 9.3% (95% CI 9.0–9.5) in Period 1 to 8% (95% CI 7.8–8.2) in Period 2, with an overall prevalence of 8.5% (95% CI 8.3–8.7) (Table 1). The prevalence demonstrated a consistently decreasing trend over time, displaying a monotonically decreasing pattern, which was statistically significant (rho=−0.939; p<0.001) (Fig. 1).
.")
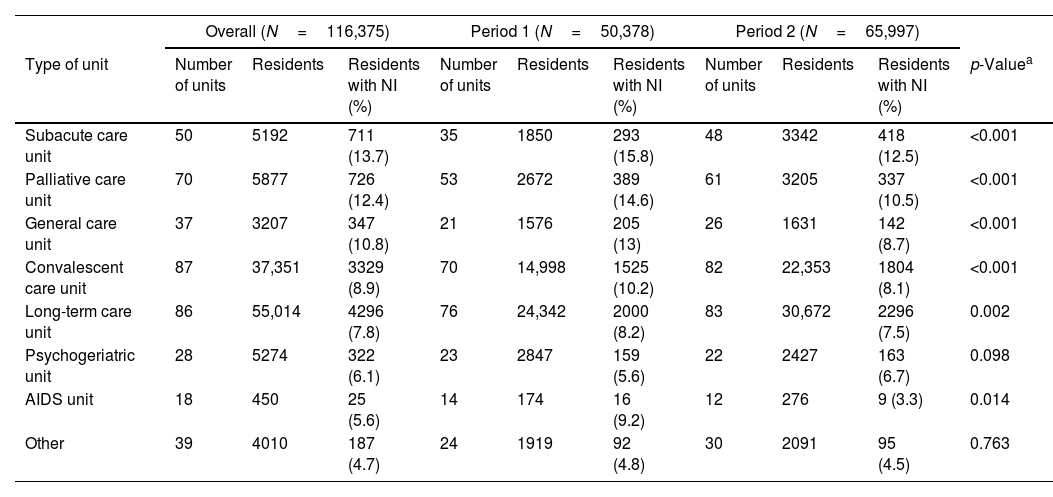
The data showing the prevalence rate by unit type is presented in Table 2. The overall prevalence of HAIs varied across different units, with rates ranging from 13.7% in Subacute Units to 5.6% in AIDS Units. A significant reduction in HAI prevalence was observed from Period 1 to Period 2 in subacute, palliative, and convalescent Units. Although decreases were noted in long-term care and AIDS units during Period 2, the changes were not statistically significant. Conversely, psychogeriatric units experienced a non-significant increase in HAI prevalence during Period 2.
Prevalence of HAIs according to unit.
| Overall (N=116,375) | Period 1 (N=50,378) | Period 2 (N=65,997) | ||||||||
|---|---|---|---|---|---|---|---|---|---|---|
| Type of unit | Number of units | Residents | Residents with NI (%) | Number of units | Residents | Residents with NI (%) | Number of units | Residents | Residents with NI (%) | p-Valuea |
| Subacute care unit | 50 | 5192 | 711 (13.7) | 35 | 1850 | 293 (15.8) | 48 | 3342 | 418 (12.5) | <0.001 |
| Palliative care unit | 70 | 5877 | 726 (12.4) | 53 | 2672 | 389 (14.6) | 61 | 3205 | 337 (10.5) | <0.001 |
| General care unit | 37 | 3207 | 347 (10.8) | 21 | 1576 | 205 (13) | 26 | 1631 | 142 (8.7) | <0.001 |
| Convalescent care unit | 87 | 37,351 | 3329 (8.9) | 70 | 14,998 | 1525 (10.2) | 82 | 22,353 | 1804 (8.1) | <0.001 |
| Long-term care unit | 86 | 55,014 | 4296 (7.8) | 76 | 24,342 | 2000 (8.2) | 83 | 30,672 | 2296 (7.5) | 0.002 |
| Psychogeriatric unit | 28 | 5274 | 322 (6.1) | 23 | 2847 | 159 (5.6) | 22 | 2427 | 163 (6.7) | 0.098 |
| AIDS unit | 18 | 450 | 25 (5.6) | 14 | 174 | 16 (9.2) | 12 | 276 | 9 (3.3) | 0.014 |
| Other | 39 | 4010 | 187 (4.7) | 24 | 1919 | 92 (4.8) | 30 | 2091 | 95 (4.5) | 0.763 |
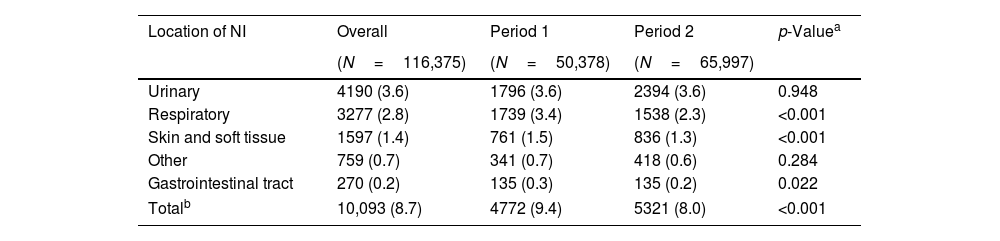
Table 3 shows the prevalence of HAIs according to the source of infection. All HAIs were recorded for each resident at the time of the PPS. Thus, the number of infections reported exceeds the number of patients with infections. In both periods, urinary tract infections (UTIs) were the most prevalent, followed by respiratory infections. Skin and soft tissue infections consistently ranked third. In Period 2, there was a significant decrease in the prevalence of respiratory and soft tissue infections. However, the prevalence of UTIs remained unchanged (3.6%) between the two periods.
Prevalence of HAIs by source of infection.
| Location of NI | Overall | Period 1 | Period 2 | p-Valuea |
|---|---|---|---|---|
| (N=116,375) | (N=50,378) | (N=65,997) | ||
| Urinary | 4190 (3.6) | 1796 (3.6) | 2394 (3.6) | 0.948 |
| Respiratory | 3277 (2.8) | 1739 (3.4) | 1538 (2.3) | <0.001 |
| Skin and soft tissue | 1597 (1.4) | 761 (1.5) | 836 (1.3) | <0.001 |
| Other | 759 (0.7) | 341 (0.7) | 418 (0.6) | 0.284 |
| Gastrointestinal tract | 270 (0.2) | 135 (0.3) | 135 (0.2) | 0.022 |
| Totalb | 10,093 (8.7) | 4772 (9.4) | 5321 (8.0) | <0.001 |
NI: nosocomial infection.
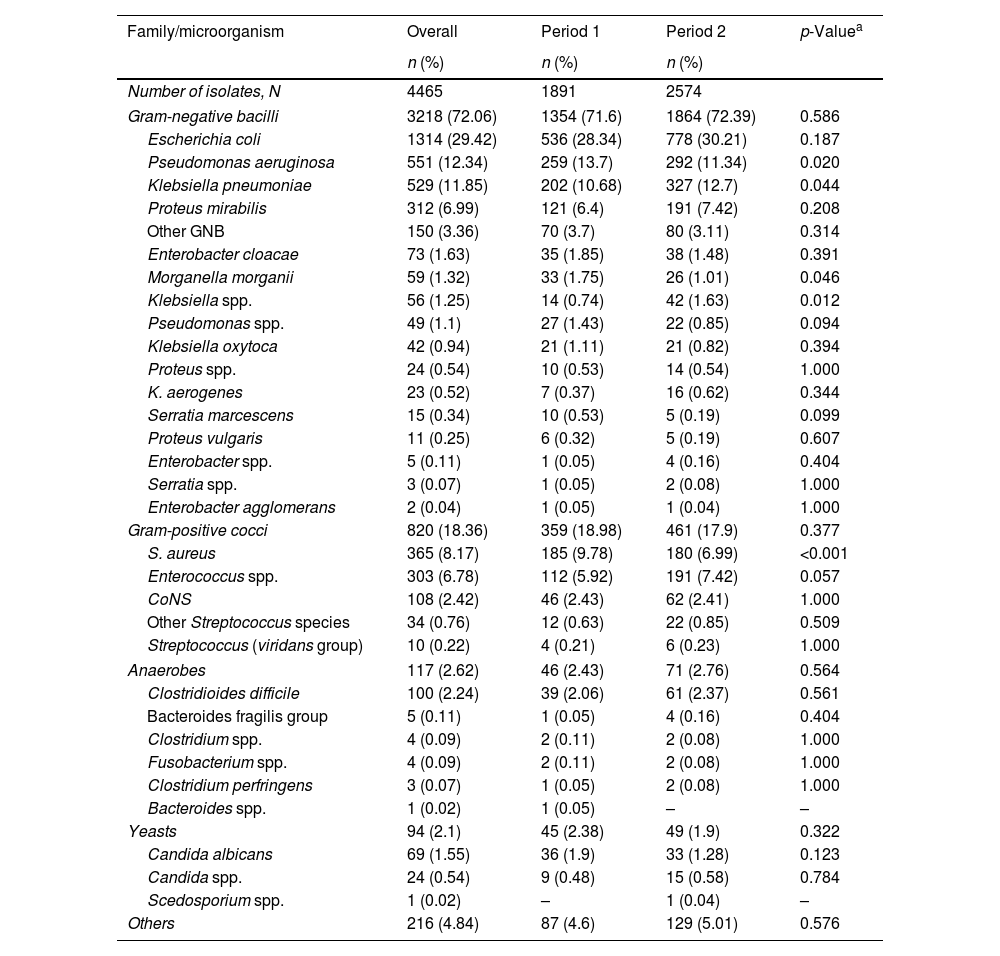
Regarding the etiology of HAIs, the majority were caused by Gram-negative bacilli (GNB), which accounted for 72.06% of isolates. Gram-positive cocci (GPC) followed, comprising 18.36%. Among GNB, Escherichia coli was the most prevalent, representing 29.4% of all isolates, followed by Pseudomonas aeruginosa (12.34%), Klebsiella pneumoniae (11.85%), and Proteus mirabilis (6.99%). For GPC, Staphylococcus aureus was the leading pathogen, accounting for 8.17% of all isolates, followed by Enterococcus spp. (6.78%). Additionally, fungi were identified in 2.1% of isolates, while anaerobes accounted for 2.62%. Significant differences were observed between the two study periods. There was a notable reduction in the prevalence of S. aureus, P. aeruginosa, E. coli, and Morganella morganii in Period 2, while the prevalence of Enterococcus spp. increased. The prevalence of Clostridioides difficile remained stable, representing 0.9% of isolates in both periods (Table 4).
Etiology of infections.
| Family/microorganism | Overall | Period 1 | Period 2 | p-Valuea |
|---|---|---|---|---|
| n (%) | n (%) | n (%) | ||
| Number of isolates, N | 4465 | 1891 | 2574 | |
| Gram-negative bacilli | 3218 (72.06) | 1354 (71.6) | 1864 (72.39) | 0.586 |
| Escherichia coli | 1314 (29.42) | 536 (28.34) | 778 (30.21) | 0.187 |
| Pseudomonas aeruginosa | 551 (12.34) | 259 (13.7) | 292 (11.34) | 0.020 |
| Klebsiella pneumoniae | 529 (11.85) | 202 (10.68) | 327 (12.7) | 0.044 |
| Proteus mirabilis | 312 (6.99) | 121 (6.4) | 191 (7.42) | 0.208 |
| Other GNB | 150 (3.36) | 70 (3.7) | 80 (3.11) | 0.314 |
| Enterobacter cloacae | 73 (1.63) | 35 (1.85) | 38 (1.48) | 0.391 |
| Morganella morganii | 59 (1.32) | 33 (1.75) | 26 (1.01) | 0.046 |
| Klebsiella spp. | 56 (1.25) | 14 (0.74) | 42 (1.63) | 0.012 |
| Pseudomonas spp. | 49 (1.1) | 27 (1.43) | 22 (0.85) | 0.094 |
| Klebsiella oxytoca | 42 (0.94) | 21 (1.11) | 21 (0.82) | 0.394 |
| Proteus spp. | 24 (0.54) | 10 (0.53) | 14 (0.54) | 1.000 |
| K. aerogenes | 23 (0.52) | 7 (0.37) | 16 (0.62) | 0.344 |
| Serratia marcescens | 15 (0.34) | 10 (0.53) | 5 (0.19) | 0.099 |
| Proteus vulgaris | 11 (0.25) | 6 (0.32) | 5 (0.19) | 0.607 |
| Enterobacter spp. | 5 (0.11) | 1 (0.05) | 4 (0.16) | 0.404 |
| Serratia spp. | 3 (0.07) | 1 (0.05) | 2 (0.08) | 1.000 |
| Enterobacter agglomerans | 2 (0.04) | 1 (0.05) | 1 (0.04) | 1.000 |
| Gram-positive cocci | 820 (18.36) | 359 (18.98) | 461 (17.9) | 0.377 |
| S. aureus | 365 (8.17) | 185 (9.78) | 180 (6.99) | <0.001 |
| Enterococcus spp. | 303 (6.78) | 112 (5.92) | 191 (7.42) | 0.057 |
| CoNS | 108 (2.42) | 46 (2.43) | 62 (2.41) | 1.000 |
| Other Streptococcus species | 34 (0.76) | 12 (0.63) | 22 (0.85) | 0.509 |
| Streptococcus (viridans group) | 10 (0.22) | 4 (0.21) | 6 (0.23) | 1.000 |
| Anaerobes | 117 (2.62) | 46 (2.43) | 71 (2.76) | 0.564 |
| Clostridioides difficile | 100 (2.24) | 39 (2.06) | 61 (2.37) | 0.561 |
| Bacteroides fragilis group | 5 (0.11) | 1 (0.05) | 4 (0.16) | 0.404 |
| Clostridium spp. | 4 (0.09) | 2 (0.11) | 2 (0.08) | 1.000 |
| Fusobacterium spp. | 4 (0.09) | 2 (0.11) | 2 (0.08) | 1.000 |
| Clostridium perfringens | 3 (0.07) | 1 (0.05) | 2 (0.08) | 1.000 |
| Bacteroides spp. | 1 (0.02) | 1 (0.05) | – | – |
| Yeasts | 94 (2.1) | 45 (2.38) | 49 (1.9) | 0.322 |
| Candida albicans | 69 (1.55) | 36 (1.9) | 33 (1.28) | 0.123 |
| Candida spp. | 24 (0.54) | 9 (0.48) | 15 (0.58) | 0.784 |
| Scedosporium spp. | 1 (0.02) | – | 1 (0.04) | – |
| Others | 216 (4.84) | 87 (4.6) | 129 (5.01) | 0.576 |
CoNS: coagulase-negative Staphylococci; GPC: gram-positive cocci; GNB: gram-negative bacilli.
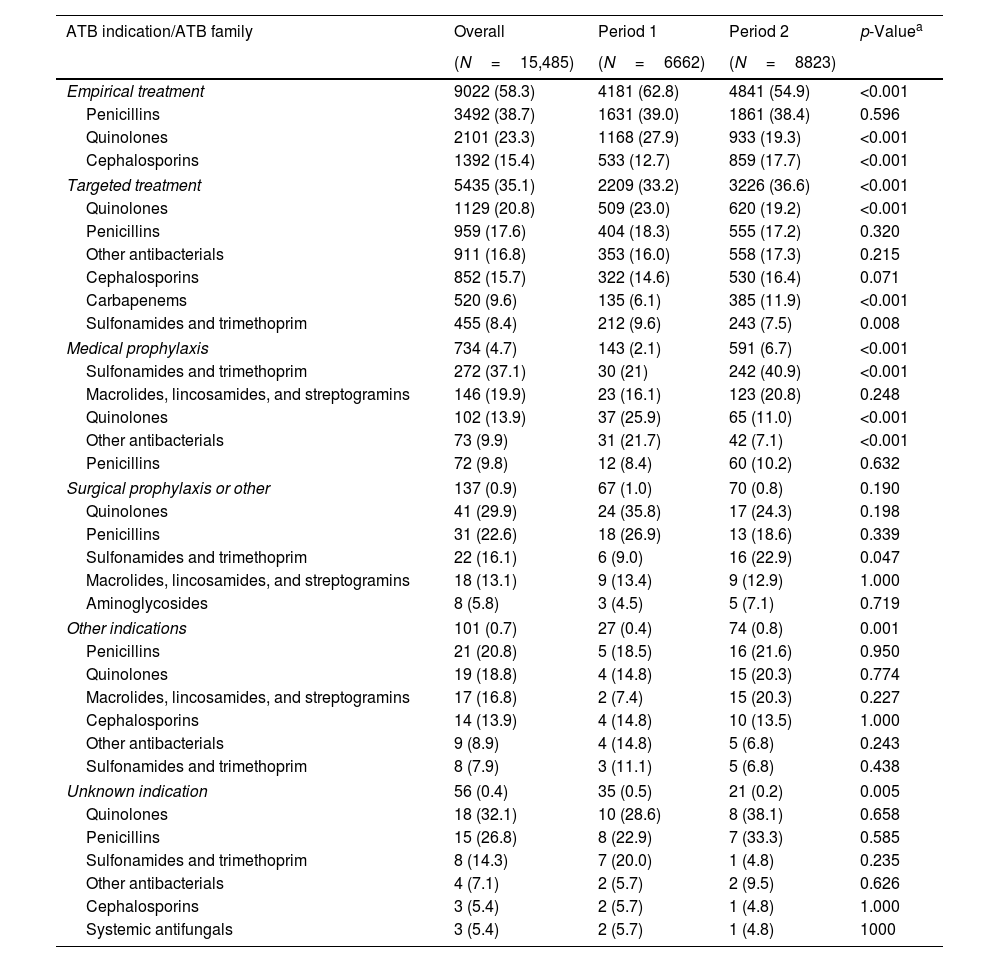
The prevalence use of antibiotics at the time of PPS was 12% with no significant differences between the two periods (Table 1). However, the rate of empirical antibiotic use decreased significantly from 62.8% in Period 1 to 54.9% in Period 2. Overall, the most prevalent families were penicillins (38.7%), quinolones (23.3%), and cephalosporins (15.4%). In Period 2, the use of quinolones decreased while the use of cephalosporins increased. In targeted treatments, the most used families were quinolones (20.8%), penicillins (17.8%), cephalosporins (15.7%), and carbapenems (9.6%) and similarly, the use of quinolones decreased in Period 2, while the use of carbapenems significantly increased (Table 5).
Percentage of antibiotic family usage by indication.
| ATB indication/ATB family | Overall | Period 1 | Period 2 | p-Valuea |
|---|---|---|---|---|
| (N=15,485) | (N=6662) | (N=8823) | ||
| Empirical treatment | 9022 (58.3) | 4181 (62.8) | 4841 (54.9) | <0.001 |
| Penicillins | 3492 (38.7) | 1631 (39.0) | 1861 (38.4) | 0.596 |
| Quinolones | 2101 (23.3) | 1168 (27.9) | 933 (19.3) | <0.001 |
| Cephalosporins | 1392 (15.4) | 533 (12.7) | 859 (17.7) | <0.001 |
| Targeted treatment | 5435 (35.1) | 2209 (33.2) | 3226 (36.6) | <0.001 |
| Quinolones | 1129 (20.8) | 509 (23.0) | 620 (19.2) | <0.001 |
| Penicillins | 959 (17.6) | 404 (18.3) | 555 (17.2) | 0.320 |
| Other antibacterials | 911 (16.8) | 353 (16.0) | 558 (17.3) | 0.215 |
| Cephalosporins | 852 (15.7) | 322 (14.6) | 530 (16.4) | 0.071 |
| Carbapenems | 520 (9.6) | 135 (6.1) | 385 (11.9) | <0.001 |
| Sulfonamides and trimethoprim | 455 (8.4) | 212 (9.6) | 243 (7.5) | 0.008 |
| Medical prophylaxis | 734 (4.7) | 143 (2.1) | 591 (6.7) | <0.001 |
| Sulfonamides and trimethoprim | 272 (37.1) | 30 (21) | 242 (40.9) | <0.001 |
| Macrolides, lincosamides, and streptogramins | 146 (19.9) | 23 (16.1) | 123 (20.8) | 0.248 |
| Quinolones | 102 (13.9) | 37 (25.9) | 65 (11.0) | <0.001 |
| Other antibacterials | 73 (9.9) | 31 (21.7) | 42 (7.1) | <0.001 |
| Penicillins | 72 (9.8) | 12 (8.4) | 60 (10.2) | 0.632 |
| Surgical prophylaxis or other | 137 (0.9) | 67 (1.0) | 70 (0.8) | 0.190 |
| Quinolones | 41 (29.9) | 24 (35.8) | 17 (24.3) | 0.198 |
| Penicillins | 31 (22.6) | 18 (26.9) | 13 (18.6) | 0.339 |
| Sulfonamides and trimethoprim | 22 (16.1) | 6 (9.0) | 16 (22.9) | 0.047 |
| Macrolides, lincosamides, and streptogramins | 18 (13.1) | 9 (13.4) | 9 (12.9) | 1.000 |
| Aminoglycosides | 8 (5.8) | 3 (4.5) | 5 (7.1) | 0.719 |
| Other indications | 101 (0.7) | 27 (0.4) | 74 (0.8) | 0.001 |
| Penicillins | 21 (20.8) | 5 (18.5) | 16 (21.6) | 0.950 |
| Quinolones | 19 (18.8) | 4 (14.8) | 15 (20.3) | 0.774 |
| Macrolides, lincosamides, and streptogramins | 17 (16.8) | 2 (7.4) | 15 (20.3) | 0.227 |
| Cephalosporins | 14 (13.9) | 4 (14.8) | 10 (13.5) | 1.000 |
| Other antibacterials | 9 (8.9) | 4 (14.8) | 5 (6.8) | 0.243 |
| Sulfonamides and trimethoprim | 8 (7.9) | 3 (11.1) | 5 (6.8) | 0.438 |
| Unknown indication | 56 (0.4) | 35 (0.5) | 21 (0.2) | 0.005 |
| Quinolones | 18 (32.1) | 10 (28.6) | 8 (38.1) | 0.658 |
| Penicillins | 15 (26.8) | 8 (22.9) | 7 (33.3) | 0.585 |
| Sulfonamides and trimethoprim | 8 (14.3) | 7 (20.0) | 1 (4.8) | 0.235 |
| Other antibacterials | 4 (7.1) | 2 (5.7) | 2 (9.5) | 0.626 |
| Cephalosporins | 3 (5.4) | 2 (5.7) | 1 (4.8) | 1.000 |
| Systemic antifungals | 3 (5.4) | 2 (5.7) | 1 (4.8) | 1000 |
ATB: antibiotic. Antibiotic families with a percentage below 5% in all three periods (overall) have been omitted from the table results.
Our study provides a comprehensive analysis of HAIs in LTCFs in Catalonia, Spain, over a nearly decade-long period. An overall reduction in HAI prevalence was observed during the study period, highlighting the efforts to implement infection prevention and control measures over the years by LTCFs.
The comparison of data from the VINCat Program, the ECDC's PPS, and a systematic review and meta-analysis of PPS of HAIs in LTCFs recently published, revealed significant differences in resident baseline conditions, invasive procedures, and HAI rates.7,13 Although the systematic review did not provide detailed information on invasive devices or specific comorbidities, the VINCat program reported a higher use of urinary and vascular catheters compared to the ECDC's PPS. This could be attributed to the higher complexity of cases managed in Catalonian LTCFs, where post-acute care is more commonly provided. Additionally, the overall HAI prevalence in the VINCat study (8.5%) was notably higher than that reported by the ECDC (3.7%) and the systematic review (3.5%). Despite the differences in HAI prevalence rates, the frequency of infection types was similar across the three studies; in the VINCat study and the meta-analysis, urinary tract infections were the most frequent, followed by respiratory tract infections and skin and soft tissue infections. In contrast, the ECDC PPS identified respiratory tract infections as the most common type of HAI. These results suggest that differences in the type of LTCFs included in the studies affect the use of invasive devices, comorbidities and HAI rates. The detailed study of patient characteristics, their requirements, and HAI rates according to units of admission represents a very important field of research, for which there is currently limited data.
Similarly to the ECDC's PPS and the data from the systematic review, the predominant pathogens causing HAIs in Catalonian LTCFs were GNB (72%). The most frequently identified species was E. coli, followed by P. aeruginosa, K. pneumoniae, and P. mirabilis. Gram-positive cocci accounted for 18.3% of the isolates, with S. aureus and Enterococcus spp. being the most common. In contrast to the VINCat data, the ECDC PPS reported a slightly lower prevalence of P. aeruginosa. While GNB were primarily associated with UTIs, S. aureus and other GPC were frequently related to respiratory and skin infections. Notably, the prevalence of Enterococcus spp. increased in the second period of the VINCat study, suggesting a potential shift in the etiology of HAIs. Additionally, the prevalence of C. difficile infections remained stable over the study period, accounting for 0.9% of the total isolates in both periods. In comparison, the ECDC PPS reported a median prevalence of 1.0% for C. difficile across European LTCFs, with considerable variability between countries, ranging from 0.4% in Ireland to 2.8% in Italy and up to 4.4% in Spain.7
We observed a stable antibiotic use rate of 12% in our facilities, being the most common antibiotics penicillins, quinolones, and cephalosporins. There was a noticeable shift toward more targeted treatments, with a decrease in quinolone use and an increase in cephalosporin prescriptions, suggesting better diagnostic practices and antimicrobial stewardship. In contrast, the European PPS reported a lower average antibiotic use rate of 4.9%.7 This difference might be due again to varying patient populations and prescription practices, with our facilities handling more complex cases.
Addressing the prevention of HAI in LTCF is essential. Reducing the use of urinary catheters and ensuring proper catheter care is crucial for preventing UTIs, the most frequent cause of HAIs in these settings. UTIs are often linked to the presence of indwelling catheters. By minimizing catheter use and adhering to strict hygiene protocols, including proper insertion techniques, regular monitoring, and timely removal, LTCFs can significantly reduce the incidence of UTIs.14 This not only enhances the quality of life for residents but also decreases the overall burden of HAIs, improving patient outcomes and reducing healthcare costs. Lower respiratory tract infections, frequently caused by aspiration, are the second leading cause of HAI. This condition is especially prevalent among residents with swallowing difficulties, cognitive impairments, or severe physical disabilities. The consequences of aspiration can be severe, often resulting in prolonged illness, increased mortality, and extended hospital stays. Preventive measures are essential to mitigate these risks, including regular assessment of swallowing function, positioning residents properly during feeding, implementing dietary modifications, and maintaining oral hygiene.15 Additionally, staff training on early recognition and management of aspiration events can further reduce the incidence of aspiration-related HAIs. A recently published cluster-randomized trial involving universal decolonization as compared with routine-care bathing performed in 28 USA nursing homes, resulted in a significant reduction in infection-related hospitalizations and a relative reduction in MDRO carriage by 30.9%.16 The USA study's focus on decolonization resulted in clear benefits, particularly in reducing MDRO-related infections and hospitalizations. The higher overall HAI prevalence in Catalonia suggests a potential area for improvement, possibly through more targeted interventions.
The study's long duration and large sample size provide a robust dataset for analyzing trends, with consistent methodologies enhancing comparability and reliability. The inclusion of various unit types within LTCFs offers valuable insights into infection patterns. However, the study has limitations, such as the lack of data on microorganism resistance mechanisms, specific pathology-related antimicrobial use, and the impact of nosocomial COVID-19 on HAI rates. The reliance on PPS may miss year-round variations in HAIs, and differences in data collection practices across facilities could affect results. Additionally, seasonal variations were not addressed, which might influence prevalence rates
In conclusion, while our study demonstrates a moderate reduction in the prevalence of HAIs in Catalonia's LTCFs, the rates remain higher than those reported in other European studies. This underscores the need for continuous improvement in infection prevention and control strategies, particularly in managing more complex medical cases in LTCFs. Future research should focus on incorporating data on antimicrobial resistance and examining antimicrobial use by specific pathologies to further enhance infection control efforts in these settings. The findings contribute valuable insights to the broader understanding of HAIs in LTCFs, offering a benchmark for future comparisons and improvements.
FundingThe VINCat Programme is supported by public funding from the Catalan Health Service, Department of Health, Generalitat de Catalunya.
Conflicts of interestThe authors declare no conflicts of interest.
Data availability statementRestrictions apply to the availability of these data, which belong to a national database and are not publicly available. Data was obtained from VINCat and are only available with the permission of the VINCat Technical Committee.
This article is our original work, has not been previously published, and is not under consideration elsewhere. All named authors are appropriate co-authors, and have seen and agreed to the submitted version of the paper.
The authors thank all participating facilities and their staff who enthusiastically attended training workshops and collected and submitted data.
Vicens Diaz-Brito, Parc Sanitari Sant Joan de Deu; David Arlandiz Puchol, Nou Hospital Evangelic; Jennifer Knäpper, Fundació Sant Francesc d’Assís – Centre d’Atenció Intermèdia Can Torras; Anna Besolí Codina, Hospital Sant Jaume de Manlleu i Hospital Santa Creu de Vic; Ramón Torres Lluelles, Casal de Curació; Alejandro Smithson Amat, Fundació Hospital de l’Esperit Sant; Noemí Sech Macías, Centre Mutuam Collserola; Olga Santos Marín, Clínica Nuestra Señora de Guadalupe; Oriol Rovira Vergés, Tania Freitas Rodriguez and Marco Antonio Rovira Isanda, Sociosanitari d’Esplugues; Hermann Villada Lenz, Clinica Sant Antoni; Anabel Llopis Calvo, Hospital de Sant Jaume i Santra Magdalena. Mataró; Gemma Torres Gómez and Imma Grau Joaquim, Centre d’Atenció Intermèdia Monterols; Cristina Trevin Vuelta, Colisee Salou; Rosa Magdalena Fernandez Pla and Dolors Cabré Torrell, Centre Assistencial Mutuam La Creueta; Anna Martinez Sibat, Hospital de Campdevànol; Núria Agramunt Perelló and Joan Galbany Padrós, Hospital Comarcal de Móra d’Ebre; M. Farners Riera i Torras, Palamós Gent Gran; José Luis Guillén Mejías, CSS-Policlinica Comarcal del Vendrell; Mercè Vargas Garcia and Montserrat Mas Rocabayera, Fundació Sociosanitaria Santa Susanna; Ana Lacal Martínez, Centre sociosanitari Hospital del Vendrell; Raquel Talón Monclús, Centre Sociosanitari Verge del Puig i Hospital de Sant Celoni; Jesús Alexander Navarro Llanes, Centre Medic Molins de Rei; Helena Palau Gispert, Hospital Sant LLàtzer Terrassa/Hospital Terrassa-Consorci Sanitari Terrassa. CST; Mª Delia Gongora Rodriguez and Teresa Ros Prats, Fundació Sant hospital. Unitat sociosanitària; Esther Pallarès fernandez, Hestia Palau; Judit Santamaria Rodriguez, Hospital d’igualada; Cristina Araguas Flores and Pilar Rosich, Albada Centre Sociosanitari; Sonia Susana Fernandez Ruiz, CSS Colisee Dolors Aleu; Alicia Cambra López, Hospital Sociosanitari de L’Hospitalet; Mª Angeles 3 Ariño Ariño and Ludivina Ibáñez Soriano, Centre Sociosanitari d’Aran; Rosa Laplace Enguinados and Ana Lacal Martínez, Sociosanitari Hospital del Vendrell; Carmen Marqués Ruíz, Centre Social i Sanitari Frederica Montseny; Marta Ruiz Figueras, Hospital d’atenció intermitja Parc Sanitari Pere Virgili; Dolors Cruz Guerrero and Victoria Bonet Heras, Centre Polivalent Can Focs; Glòria Oton Aguilar, Pius Hospital de Valls; Maria Vizcarro Cristoful, Hospital Comarcal Amposta; Inmaculada Egido Pérez, HSS Mutuam Girona; Jordi Bantulà Pi, L’Estada; Francesc Riba Porquet, Hospital Santa Creu, Jesús-Tortosa; Núria Bosch Ros, Parc Hospitalari Martí i Julià. Edifici la Republica; Rosina Piquer Sire, Sant Jordi; Eneida Quinayas Ruiz, Residència Vila-seca; Sonia Moreno Lucas, CSS CIS Cotxeres; Ester Campmol Aymerich and Montserrat Xargay Sidrach, Residència per gent gran i sòcio sanitari Puig d’en Roca. Girona; Gerard Baldomà Campos, Hestia Balaguer; Esther Guardiola Romero, Centre Sociosanitari de Vilafranca del Penedès. Ricard Fortuny; Eva Redón Ruiz and Elisabeth Mauri Nicolás, Centre Sociosanitari Mollet; Sebastian Fradejas Moschino and Dolors Quera Ayma, Hospital Atencio Intermedia Mutuam Güell; Zebenzuí José Santana Rodríguez, Hospital Sociocanitari Francolí de Tarragona; Llanos Mira Garcia-Gutierrez and Santi Bernades Teixidó, Hospital Sagrat Cor Martorell; Julián Andrés Mateus Rodríguez and Julián Andrès Mateus Rodríguez, Colisee Barcelona Isabel Roig; Gabriel de Febrer Martínez, Hospital Universitari Sant Joan de Reus; Susana Fernandez Menendez, Centro Sociosanitario Bernat Jaume; Antoni Barceló Montalà and Eugeni Jove Subirada, CSS Hospital Jaume Nadal Meroles; Esther Calbo Sebastian, Centre Sociosanitari Vallparadís; M. Eugènia Viladot Blasi, Centre Hospitalari Manresa – Althaia; Gemma Novelles Serena, Centre Sanitari del Solsonès; M. Dolores Dapena Diaz, Consorci Sanitari Alt Penedès Garraf. H. Sant Camil i H. Sant Antoni Abat; Aleix Roig i Vidal, Ciutat de Reus; Joan Ventura Junyent, Fundació Sanitària Sant Josep; Beatriz Pacheco Gonzalez, DomusVi la Salut.
The members of this VINCat Programme Long-Term Care Facilities Prevalence Point Survey group appear in Appendix 1.