


To assess the prevalent consumption trend between 2001 and 2017 and the healthy lifestyles associated with consuming a plant-based diet in the Spanish population.
MethodologyA representative Spanish sample was analysed (>15 years old) from the Spanish National Health Survey for years 2001 (n=8568), 2006 (n=25,649), 2011 (n=19,027) and 2017 (n=21,986). The population was classified as omnivore, vegetarian, or vegan. The lifestyle variables were physical activity, tobacco and alcohol consumption, and body mass index (BMI). The χ2 test was used to evaluate diet change between 2001 and 2017. T-Student and χ2 were used to compare lifestyles of omnivores and vegetarians/vegans. Logistic regression was used to analyse lifestyles associated with plant-based diets.
Results0.2% of the Spanish population followed a plant-based diet. Between plant-based diet consumers there was an increase in vegans vs. vegetarians between 2001 (9.5% vs. 90.5%) and 2017 (65.3% vs. 34.7%) (p=0.007). Compared to 2001, following a plant-based diet was more likely in 2006 (OR=2.08, p=0.004), 2011 (OR=1.89, p=0.02) and 2017 (OR=1.75, p=0.04). Those who consume alcohol (OR=0.65, p=0.008), who were overweight (OR=0.48, p<0.001) or who were obese (OR=0.40, p=0.001) were less likely to consume a plant-based diet.
ConclusionsDespite an increase in the consumption of plant-based diets between 2001 and 2017, there was a low prevalence of consumption in all years studied. There was a greater probability of consuming plant-based diets among the Spanish population with healthy behaviours. These findings could help design strategies focused on healthy nutritional behaviours.
Evaluar la prevalencia, tendencia del consumo entre 2001 y 2017 y estilos de vida saludables asociados al consumo de dietas vegetarianas en población española.
MetodologíaSe analizó una muestra representativa española (≥15 años) con datos de las encuestas nacionales de salud de 2001 (n=8.568), 2006 (n=25.649), 2011 (n=19.027) y 2017 (n=21.986). La población se clasificó como omnívora, vegetariana o vegana. Las variables de estilos de vida fueron actividad física, consumo de tabaco y alcohol e índice de masa corporal (IMC). Se utilizó la prueba χ2 para evaluar el cambio de dieta entre 2001 y 2017. Se utilizó t de Student y χ2 para comparar estilos de vida de omnívoros y vegetarianos/veganos. Se utilizaron regresiones logísticas para asociar estilos de vida con dietas vegetarianas.
ResultadosEl 0,2% de la población española siguió una dieta vegetariana o vegana. Entre los consumidores de dietas vegetarianas hubo un aumento de veganos vs. vegetarianos, entre 2001 (9,5 vs. 90,5%) y 2017 (65,3 vs. 34,7%) (p=0,007). En comparación con 2001, fue más probable seguir dietas vegetarianas en 2006 (OR=2,08, p=0,004), 2011 (OR=1,89, p=0,02) y 2017 (OR=1,75, p=0,04). Los consumidores de alcohol (OR=0,65, p=0,008), personas con sobrepeso (OR=0,48, p<0,001) y obesidad (OR=0,40, p=0,001) fueron menos propensos a consumir dietas vegetarianas.
ConclusionesA pesar del aumento en las dietas vegetarianas entre 2001 y 2017, hubo una baja prevalencia de consumo, en los años estudiados. Hubo mayor probabilidad de consumir dietas vegetarianas entre los españoles con comportamientos saludables. Estos resultados podrían ayudar a diseñar estrategias centradas en comportamientos nutricionales saludables.
Knowledge about the population's dietary habits is key to disease prevention, nutrition education, and elaboration of food policy. Furthermore, understanding food preferences positively impacts the health and economy since that allows access to quality food and diets and improves the offer in the restaurant and market field. Individuals choose to follow different dietary patterns, such as reducing the meat intake1 or following a plant-based diet2 for many reasons: environmental, health, or because they are against animal cruelty.3 Plant-based diets are a healthy option when well-prepared and planned,4 and have positive environmental impacts.5 The current literature has focused on analysing people's motivation for following a plant-based diet.6 However, there is a lack of research, with the current number of vegetarian and vegan populations provided from data obtained from national health surveys.7
Food consumption research has classified the world population according to the quantity and quality of protein and fat consumed8: 73% have been classified as omnivores, 14% as flexitarians (occasional consumption of meat and fish), 5% as vegetarians, 3% as vegans, and the remaining 3% as pescetarian (consumption of fish and seafood but no meat products). On the other hand, the studies show an increase in the global average consumption of meat per capita,9 and at the same time, an increase in the population following a vegan diet.10 Graça et al.11 conclude that there is a transition toward plant-based diets but in a fragmented way. The rise of the vegetarian and vegan dietary patterns could be related to an increasing interest in the global environmental issues shown by the literature,12 with an increased incidence in cardiovascular risk factors,13 or both.
The purpose of this study is to provide up-to-date information about the Spanish population that follows a plant-based diet since there are no data available from national surveys at a population level. The aim is to quantify the Spanish vegetarian and vegan population from the Spanish National Health Survey, evaluating whether there has been a trend change throughout the century (2001–2017). In addition, lifestyle profile (physical activity, tobacco, and alcohol consumption, and body mass index – BMI) associated with consumption of plant-based diets will be analysed.
Material and methodsDataData was collected from the free-to-access Spanish National Health Survey.14 We used questionnaires from four different years with similar time intervals (2001, 2006, 2011, 2017) to analyse the trend of consumption of plant-based diets. These surveys collect information voluntarily and anonymously, following the Code of Good Practice for European Statistics, and include individuals aged 15 years or older. After excluding missing data and mistakes in the variables analysed, a sample of 85,230 individuals was studied: 18,568 in 2001, 25,649 in 2006, 19,027 in 2011, and 21,986 in 2017.
Variables measuredWe classified dietary intake based on the source of protein: omnivore diet (animal-source protein) and plant-based diet (non-animal source of protein). The vegetarian (ovo-lacto-vegetarian) and vegan (no animal-source protein) diets were considered plant-based diets. The type of diet was obtained from the weekly frequency of food intake of fresh fruit, meat (e.g., poultry, beef, pork, lamb), eggs, fish, pasta, rice and potatoes, bread and cereals, vegetables, salads, legumes, processed-meat, dairy (e.g., milk, cheese, yogurt), and fast food (e.g., fried chicken, pizza, hamburgers). The answer options were: “Daily. One or more times per day”, “Four to six times per week”, “Three times per week”, “One or two times per week”, “Less than one time per week” or “Never.” All the categories were renamed as “I do consume” and “I do not consume.” We then elaborated the variable “diet” with the categories: omnivores being those who consume “meat”, “fish”, and/or “processed meat”, as well as the rest of the food groups; vegetarians being those who consumed dairy and/or eggs, as well as the rest of the food groups but who do not consume meat, fish, processed meat and fast food; and vegans being those who do not consume meat, fish, processed meat, dairy, eggs, or fast food.
We estimated the BMI (kg/m2) from the self-reported weight (kg) and height (cm) of the participants, who responded to the following questions: “How much do you weigh (kg) without clothes and shoes?”, “How tall are you without shoes (cm)?”. Based on the answers, we classified the individuals as normal weight (BMI<24.9kg/m2), overweight (BMI≥25kg/m2 and <29.9kg/m2) and obese (BMI≥30kg/m2).
The surveys collected information about how often individuals do physical activity in their leisure time. This variable was classified into two categories: “no/occasionally” (when they answered, “I do not exercise” or “I do exercise occasionally”) and “yes” (when they answered “several times a month” or “several times a week”).
Tobacco and alcohol consumption were classified in “non/ex-smoker” and “yes”, and “no/occasionally” and “yes” (I consume daily, weekly, or monthly).
Statistical analysisWe used the χ2 test to evaluate the changes in diet pattern proportions (omnivorous vs. plant-based and vegetarian vs. vegan diets) and lifestyles between 2001 and 2017. The χ2 test and t-Student test were used to compare the demographic and lifestyle characteristics of omnivores and vegetarians/vegans. In addition, logistic regression tests were used to analyse the associated lifestyle profiles to plant-based diets (vs. omnivorous diets) and to assess whether there is a greater probability of consuming plant-based diets in recent years. The results show the odds ratio (OR) with a 95% confidence interval (95% CI). The OR value represents if the variables analysed are predictive factors (OR>1) or present less likely (OR<1) of consuming plant-based diets. All the analysis was performed using SPSS 26. The significance level was established at alpha <0.05.
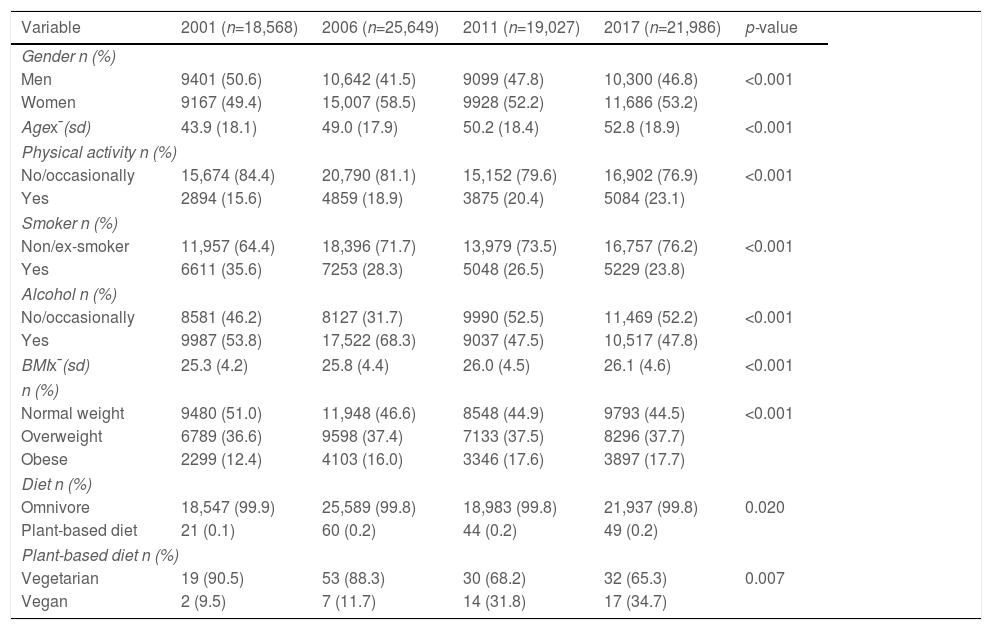
ResultsChange in the prevalence of plant-based diets from 2001 to 2017The characteristics of the population studied by study year are in Table 1. The prevalence of plant-based diet consumption was low compared to omnivorous diets, 0.1% in 2001 and 0.2% in 2006, 2011 and 2017 (p=0.020). Among the types of plant-based diets, we found a positive and progressive trend (p=0.007) on the vegan compared to vegetarian options. The percentage of individuals following a vegan diet increased from 9.5% in 2001 to 34.7% in 2017.
Demographic characteristics, lifestyles, and type of diet of studied populations by study year.
| Variable | 2001 (n=18,568) | 2006 (n=25,649) | 2011 (n=19,027) | 2017 (n=21,986) | p-value |
|---|---|---|---|---|---|
| Gender n (%) | |||||
| Men | 9401 (50.6) | 10,642 (41.5) | 9099 (47.8) | 10,300 (46.8) | <0.001 |
| Women | 9167 (49.4) | 15,007 (58.5) | 9928 (52.2) | 11,686 (53.2) | |
| Agex¯(sd) | 43.9 (18.1) | 49.0 (17.9) | 50.2 (18.4) | 52.8 (18.9) | <0.001 |
| Physical activity n (%) | |||||
| No/occasionally | 15,674 (84.4) | 20,790 (81.1) | 15,152 (79.6) | 16,902 (76.9) | <0.001 |
| Yes | 2894 (15.6) | 4859 (18.9) | 3875 (20.4) | 5084 (23.1) | |
| Smoker n (%) | |||||
| Non/ex-smoker | 11,957 (64.4) | 18,396 (71.7) | 13,979 (73.5) | 16,757 (76.2) | <0.001 |
| Yes | 6611 (35.6) | 7253 (28.3) | 5048 (26.5) | 5229 (23.8) | |
| Alcohol n (%) | |||||
| No/occasionally | 8581 (46.2) | 8127 (31.7) | 9990 (52.5) | 11,469 (52.2) | <0.001 |
| Yes | 9987 (53.8) | 17,522 (68.3) | 9037 (47.5) | 10,517 (47.8) | |
| BMIx¯(sd) | 25.3 (4.2) | 25.8 (4.4) | 26.0 (4.5) | 26.1 (4.6) | <0.001 |
| n (%) | |||||
| Normal weight | 9480 (51.0) | 11,948 (46.6) | 8548 (44.9) | 9793 (44.5) | <0.001 |
| Overweight | 6789 (36.6) | 9598 (37.4) | 7133 (37.5) | 8296 (37.7) | |
| Obese | 2299 (12.4) | 4103 (16.0) | 3346 (17.6) | 3897 (17.7) | |
| Diet n (%) | |||||
| Omnivore | 18,547 (99.9) | 25,589 (99.8) | 18,983 (99.8) | 21,937 (99.8) | 0.020 |
| Plant-based diet | 21 (0.1) | 60 (0.2) | 44 (0.2) | 49 (0.2) | |
| Plant-based diet n (%) | |||||
| Vegetarian | 19 (90.5) | 53 (88.3) | 30 (68.2) | 32 (65.3) | 0.007 |
| Vegan | 2 (9.5) | 7 (11.7) | 14 (31.8) | 17 (34.7) | |
BMI=Body Mass Index; x¯: Mean value; SD: Standard deviation; p-value obtained by χ2 test to qualitative variables and by ANOVA test to quantitative variables.
In Table 1, we found a significant increase in the practice of physical activity (p<0.001) and BMI average value (p<0.001) between 2001 and 2017. This increase in the BMI was due to an increase by 5.3 points in the proportion of obesity. Also, we found a significant negative trend in tobacco (p<0.001) and alcohol consumption (p<0.001).
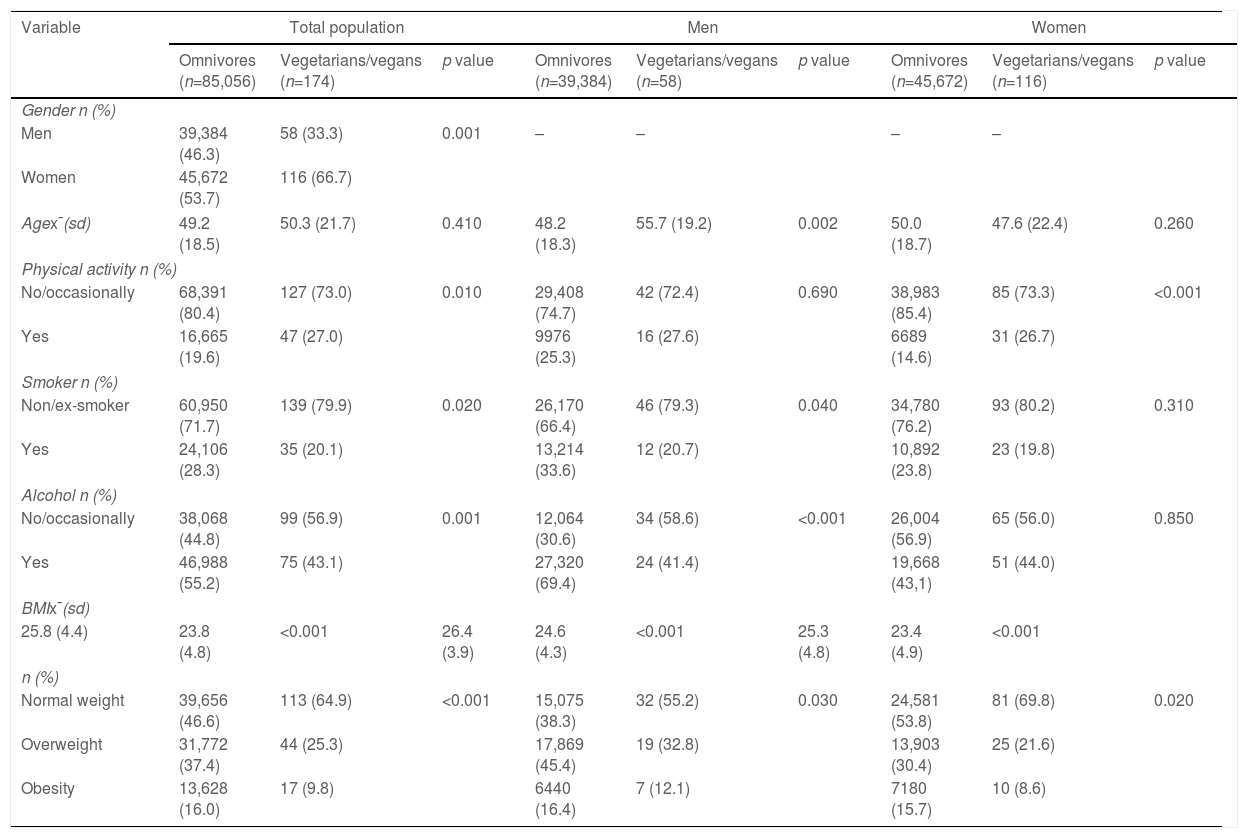
Demographic and lifestyle profile associated with the type of dietThe demographic and lifestyle characteristics of omnivores and vegetarians or vegans are shown in Table 2. We have analysed vegetarians and vegans together because of the low number of people following plant-based diets. We observed twice as many women as men following a plant-based diet (67% vs. 33%, p<0.001) and better lifestyle in individuals following a plant-based diet, 27.0% practising physical activity (19.6% in omnivores, p=0.010), 20.1% were smokers (28.3% in omnivores, p=0.020), 43.1% consumed alcohol (55.2% in omnivores, p=0.001) and 9.8% were obese (16.0% in omnivores, p<0.001). We found significant differences in BMI average as well, it falling within the normal-weight range in vegetarians and vegans (23.8kg/m2) and within the overweight range in omnivores (25.8kg/m2, p<0.001).
Demographic characteristics and lifestyles according to the type of diet for all years of study, analysed for the total population and by gender.
| Variable | Total population | Men | Women | ||||||
|---|---|---|---|---|---|---|---|---|---|
| Omnivores (n=85,056) | Vegetarians/vegans (n=174) | p value | Omnivores (n=39,384) | Vegetarians/vegans (n=58) | p value | Omnivores (n=45,672) | Vegetarians/vegans (n=116) | p value | |
| Gender n (%) | |||||||||
| Men | 39,384 (46.3) | 58 (33.3) | 0.001 | – | – | – | – | ||
| Women | 45,672 (53.7) | 116 (66.7) | |||||||
| Agex¯(sd) | 49.2 (18.5) | 50.3 (21.7) | 0.410 | 48.2 (18.3) | 55.7 (19.2) | 0.002 | 50.0 (18.7) | 47.6 (22.4) | 0.260 |
| Physical activity n (%) | |||||||||
| No/occasionally | 68,391 (80.4) | 127 (73.0) | 0.010 | 29,408 (74.7) | 42 (72.4) | 0.690 | 38,983 (85.4) | 85 (73.3) | <0.001 |
| Yes | 16,665 (19.6) | 47 (27.0) | 9976 (25.3) | 16 (27.6) | 6689 (14.6) | 31 (26.7) | |||
| Smoker n (%) | |||||||||
| Non/ex-smoker | 60,950 (71.7) | 139 (79.9) | 0.020 | 26,170 (66.4) | 46 (79.3) | 0.040 | 34,780 (76.2) | 93 (80.2) | 0.310 |
| Yes | 24,106 (28.3) | 35 (20.1) | 13,214 (33.6) | 12 (20.7) | 10,892 (23.8) | 23 (19.8) | |||
| Alcohol n (%) | |||||||||
| No/occasionally | 38,068 (44.8) | 99 (56.9) | 0.001 | 12,064 (30.6) | 34 (58.6) | <0.001 | 26,004 (56.9) | 65 (56.0) | 0.850 |
| Yes | 46,988 (55.2) | 75 (43.1) | 27,320 (69.4) | 24 (41.4) | 19,668 (43,1) | 51 (44.0) | |||
| BMIx¯(sd) | |||||||||
| 25.8 (4.4) | 23.8 (4.8) | <0.001 | 26.4 (3.9) | 24.6 (4.3) | <0.001 | 25.3 (4.8) | 23.4 (4.9) | <0.001 | |
| n (%) | |||||||||
| Normal weight | 39,656 (46.6) | 113 (64.9) | <0.001 | 15,075 (38.3) | 32 (55.2) | 0.030 | 24,581 (53.8) | 81 (69.8) | 0.020 |
| Overweight | 31,772 (37.4) | 44 (25.3) | 17,869 (45.4) | 19 (32.8) | 13,903 (30.4) | 25 (21.6) | |||
| Obesity | 13,628 (16.0) | 17 (9.8) | 6440 (16.4) | 7 (12.1) | 7180 (15.7) | 10 (8.6) | |||
BMI=Body Mass Index; x¯: mean value; SD: standard deviation; p-value obtained by χ2 test to qualitative variables and by T-Student test to quantitative variables.
Based on gender (Table 2), we found profiles different in both men and women. Males that followed a plant-based diet were older (56 years) than omnivores (48 years, p=0.002), did not show significant differences in physical activity, had a lower percentage of tobacco (20.7% vs. 33.6%, p=0.04) and alcohol (41.4% vs. 69.4%, p<0.001) consumption and a better nutritional profile, with a lower prevalence of obesity (12.1% vs. 16.4%, p=0.03) and an average BMI of 24.6kg/m2, whereas male omnivores’ mean BMI was 26.4kg/m2 (p<0.001). Among women, we found significant differences in both omnivorous and vegetarians/vegan groups in physical activity and nutritional status, with better results in women following a plant-based diet: 27.6% exercise (14.6% in omnivorous women, p<0.001, 8.6% were obese (15.7% in omnivorous women, p=0.020), and the BMI average was normal weight in vegetarians/vegans (23.4kg/m2) and overweight in omnivorous women (25.3kg/m2, p<0.001).
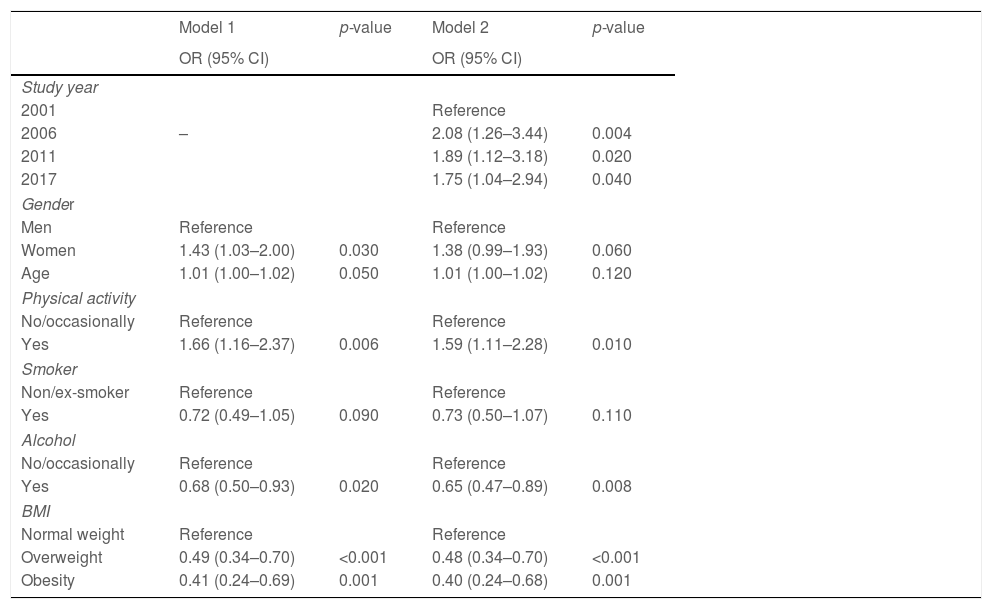
Association between plant-based diets and lifestylesA profile of adherence to plant-based diets can be established from the factors associated with their consumption (Table 3). We had analysed two models, and in both we assessed the relationship between the type of diet and lifestyles, but in model 2, we used the study year as a control variable.
Factors associated with the consumption of plant-based diets. Model 1: a pooled analysis of all years studied. Model 2: a pooled analysis controlling for the years studied.
| Model 1 | p-value | Model 2 | p-value | |
|---|---|---|---|---|
| OR (95% CI) | OR (95% CI) | |||
| Study year | ||||
| 2001 | Reference | |||
| 2006 | – | 2.08 (1.26–3.44) | 0.004 | |
| 2011 | 1.89 (1.12–3.18) | 0.020 | ||
| 2017 | 1.75 (1.04–2.94) | 0.040 | ||
| Gender | ||||
| Men | Reference | Reference | ||
| Women | 1.43 (1.03–2.00) | 0.030 | 1.38 (0.99–1.93) | 0.060 |
| Age | 1.01 (1.00–1.02) | 0.050 | 1.01 (1.00–1.02) | 0.120 |
| Physical activity | ||||
| No/occasionally | Reference | Reference | ||
| Yes | 1.66 (1.16–2.37) | 0.006 | 1.59 (1.11–2.28) | 0.010 |
| Smoker | ||||
| Non/ex-smoker | Reference | Reference | ||
| Yes | 0.72 (0.49–1.05) | 0.090 | 0.73 (0.50–1.07) | 0.110 |
| Alcohol | ||||
| No/occasionally | Reference | Reference | ||
| Yes | 0.68 (0.50–0.93) | 0.020 | 0.65 (0.47–0.89) | 0.008 |
| BMI | ||||
| Normal weight | Reference | Reference | ||
| Overweight | 0.49 (0.34–0.70) | <0.001 | 0.48 (0.34–0.70) | <0.001 |
| Obesity | 0.41 (0.24–0.69) | 0.001 | 0.40 (0.24–0.68) | 0.001 |
BMI=Body Mass Index; CI: Confidence Interval; OR=Odds Ratio.
In both models, we found that individuals with healthier lifestyles had a greater probability of consuming a plant-based diet after controlling for gender and age. In model 2, the probability of following a plant-based diet is double or almost double in 2006, 2011 and 2017 compared to 2001 (2006: OR=2.08, p=0.004; 2011: OR=1.89, p=0.020; 2017: OR=1.75, p=0.040). Controlling for gender, age and study year, a greater probability of consuming a plant-based diet is associated with practising physical activity (OR=1.59, p=0.010). Those who consumed alcohol, who were overweight or who were obese had a lower probability of consuming a plant-based diet (OR=0.65, p=0.008, OR=0.48, p<0.001 and OR=0.40, p=0.001, respectively).
DiscussionThis study hypothesised that the Spanish population would show a positive significantly increased trend in the consumption of plant-based diets between 2001 and 2017. The results showed significantly increased prevalence in plant-based diets compared to omnivorous diets. Among individuals following plant-based diets, a significant increase in vegan diets compared to vegetarian diets was evident. We obtained almost double the probability in plant-based diet consumption in all years studied (2006, 2011, and 2017) compared to 2001. The literature shows an increase in the consumption of plant-based diets with different prevalence in the United States and Europe in recent years.15
The data obtained shows that only 0.2% of the population in Spain follows a plant-based diet. According to The Spanish National Dietary report,16 compared to other European countries (The Netherlands, France, and United Kingdom), the Spanish population consumes more fish and seafood and has the second-highest consumption of meat in Europe (after the United Kingdom).
The literature suggests a lower adherence to a plant-based diet in Spain than in other countries. In the United States, 5% and 2% of the population self-reported to be vegetarian and vegan, respectively.10 In France, 3.4% are considered vegetarians or vegans.7 According to Mao et al.,17 in China, 0.77% of the population followed plant-based diets, 0.45% vegetarians, and 0.12% vegans. In India, where vegetarianism is considered a tradition from birth,18 3.2% of the population is lacto-ovo-vegetarian, and 1.6% vegan.19 But it is necessary to consider that all the data available are self-reported questionnaires, which may not accurately represent the actual vegetarian and vegan individuals. Some individuals who self-reported as following a plant-based diet may not be rigorous with their dietary intake and occasionally consume some meat products.20 Consequently, the plant-based diet consumer's prevalence obtained by the questionnaires on the frequency of food consumption may be lower than that reflected by the self-reported questionnaires. Previous studies also pointed to the presentation of survey questions as a reason for the discrepancies in prevalence rates reported.6
Our study had also aimed to investigate the lifestyle profile associated with the consumption of plant-based diets. We found better results in physical activity, tobacco and alcohol consumption, and BMI among vegetarian and vegan individuals than omnivores in the general population. But by gender, we found different behaviours associated with the type of diet, exercise prevalence was similar among omnivorous and vegetarian/vegan males, and tobacco and alcohol consumption were not associated with the type of diet in women. However, regardless of gender, there was a greater probability of following a plant-based diet in individuals who have a healthier lifestyle (exercise, non-alcohol consumers, and healthy BMI) which can point to healthy motivations in the choice of this type of diet.
Individuals who choose a plant-based diet could have multiple reasons to follow it.21 But it seems that the perception of the health benefits of plant-based diets plays a key role in people choosing these diets.6 Among the main recommendations regarding maintaining or improving cardiovascular health are healthy lifestyles such as not smoking; no, or very moderate, alcohol consumption; exercise; and body weight control. The individuals who follow a vegetarian diet have a better metabolic profile (prevention and treatment of cardiovascular disease, lower blood pressure, and blood lipids) than the omnivores22 and this may help prevent chronic degenerative diseases.23 Other studies found that vegetarians have a lower prevalence of overweight and obesity and that a vegetarian dietary pattern could prevent obesity.24
Nevertheless, Jaacks et al.25 found an association between the vegetarian diet and a lower risk of overweight/obesity in American adults (48% in vegetarian vs. 58% in non-vegetarian, p<0.050), but a lower association in south-Asian adults (49% in vegetarian vs. 53% in non-vegetarian, p<0.050). Agrawal et al.19 did not find any significant differences in BMI between the omnivores, vegetarians, and vegans. The vegetarian and vegan diets could sometimes include non-healthy foods, such as soda, snacks, desserts, and pre-cooked meals.26 Mayra et al.26 pointed out that the quality of the diet should remain over the protein source since it is one of the determinant factors providing the health benefits. Thus, the rationale behind choosing a plant-based diet could have a relevant impact on health. Vegan individuals who choose the diet for health reasons have a healthier diet, with higher consumption of fruits and less candy than the vegan individuals who choose veganism for ethical reasons.27
Therefore, it should be recommended that the population be advised towards reducing meat consumption and at the same time be informed about the dietary quality impact on health. This will improve the nutritional health of the population and contribute to reducing the environmental impacts since environmental sustainability is inherent to dietary behaviours.28 Rose et al.28 call for the necessity of integrating nutritional health and environmental sustainability in dietary guidelines.
Healthy nutritional behaviour requires a successful public health plan supported by health, environmental, and nutrition specialists, contributing to divulgation of nutritional knowledge to the population. It is challenging to provide information, strategies, and the tools to teach the population about healthy dietary choices within a sustainable food system.29 Within this challenge, and to succeed with nutritional recommendations and policies, the food on offer and the different gastronomic techniques applied to each society's culture and traditions should be considered.9
The current study has some limitations to acknowledge. The classification made for the type of diet is based on the intake frequency and not on the self-reported data. Even though this classification may suggest a better description of the intake,20 it could limit our results’ comparison with others who used self-reported data. BMI was estimated by self-reported anthropometric measurements (weight and height), but previous studies suggested that self-reported height and weight correlated with researchers taking measurements.30 In addition, there were few vegetarians and vegans, but it has been enough to obtain significant results. To our knowledge, this is the first study in Spain to analyse the prevalence and time trends of vegetarianism and veganism and their relationship with lifestyles in terms of health. The current research can provide information for designing recommendations for more sustainable and healthier food policies.
ConclusionsThere is a positive increase in the consumption of the plant-based diet in Spain due to an increase in vegan diets. The association between plant-based consumption and healthy lifestyles could suggest motivations in health, mainly to follow a plant-based diet. The greater probability of consuming plant-based diets among people with healthy behaviours determines the profile of a vegetarian person in Spain.
The findings of this study can help design communication strategies focused on healthy nutritional behaviours. The evidence of low adherence to plant-based diets and the increasing trend in vegan diets reflect the importance of educating the population about the benefits of plant-based proteins and how to increase their consumption. Furthermore, the association of the consumption of plant-based diets with evaluated lifestyles suggests that plant-based diets are another feature of healthy lifestyles. However, it would be necessary to investigate more deeply the motivation for following plant-based diets at different ages, and the eating behaviour, according to the type of protein and fat consumed (omnivorous, pescetarian, vegetarian, and vegan diets). Expanding knowledge about dietary behaviour will lead to the development of disease prevention and control strategies adapted to each population according to their age and their motivations for consumption.
FundingNo funding.
Authorship contributionsP. Acevedo: conceptualisation, methodology, data analysis and drafted the manuscript; C. Ortega: conceptualisation, drafted the manuscript, revision of English and final revision; N. López-Ejeda: drafted the manuscript and final revision. All authors read and approved the final manuscript.
Conflicts of interestNone.
The authors thank the National Statistics Institute for the free publication of the National Health Surveys and those who collaborate in carrying out the surveys.
