


Strict blood glucose control in the treatment of diabetes can sometimes lead to hypoglycemia. The main aim of this study was to assess the prevalence of hypoglycemia among patients receiving sulfonylureas alone, or in combination with metformin, for the treatment of Type 2 Diabetes Mellitus (T2DM) in Argentina.
MethodsThis is a real life, multi-center, retrospective, and cross-sectional study based on clinical chart reviews including cross-sectional data, and evaluation of patient questionnaires of T2DM patients (>30 years), treated with sulfonylureas alone or in combination with metformin, during a routine clinic visit in 16 medical centers across Argentina. Socio-demographic and clinical parameters were collected from medical records, as well as hypoglycemic events from both the medical records and the patient questionnaires. The glycated hemoglobin (HbA1c) levels were obtained from medical records as well as a blood test.
ResultsThe study included a total of 397 patients with a mean age of 62.5 years, diagnosed for 9.9 years, and 54.2% male. Mean HbA1c levels were 8.1%, (65mmol/mol) at enrolment, with 36.4% being in control (HbA1c<7%, (53mmol/mol). Patients with HbA1c<7%, (53mmol/mol) were significantly older, diagnosed at older age, and had lower triglyceride levels. Almost 50% reported hypoglycemic episodes that were mostly mild, and with women more likely to report them. The large majority (86%) were on combined metformin and sulfonylureas, most commonly Glibenclamide (48.6%). Patients on combined therapy were significantly younger and more likely to have uncontrolled diabetes.
ConclusionsThis study demonstrated that out of a sample of 397 patients with T2DM treated with sulfonylureas alone or in combination with metformin in Argentina, around 50% of them reported symptoms of hypoglycemia induced by sulfonylureas, and one third of them achieved target HbA1c<7% levels.
El control estricto de la glucemia en el tratamiento de la diabetes puede provocar hipoglucemia. El objetivo principal de este estudio fue evaluar la prevalencia de hipoglucemia en pacientes que reciben sulfonilureas (SU) solas o en combinación con metformina para el tratamiento de la diabetes tipo 2 en Argentina.
MétodosEste es un estudio multicéntrico, retrospectivo y transversal de la vida real basado en la revisión de historias clínicas que incluyen datos transversales y evaluación de cuestionarios de pacientes con diabetes mellitus tipo 2 (>30 años) tratados con SU solas o en combinación con metformina, durante una consulta de rutina en 16 centros médicos en toda Argentina. Se recogieron los parámetros sociodemográficos y clínicos de los registros médicos y los eventos hipoglucémicos de los registros médicos y los cuestionarios de los pacientes. Los niveles de hemoglobina glucosilada (HbA1c) se obtuvieron a partir de registros médicos y un análisis de sangre.
ResultadosSe incluyeron 397 pacientes. La edad media fue de 62,5 años, con diagnóstico realizado hace 9,9 años y donde el 54,2% de los pacientes fueron varones. Los niveles de HbA1c fueron del 8,1% (65mmol/mol) al momento del enrolamiento y del 36,4% estaban en meta terapéutica (HbA1c<7%, 53mmol/mol). Dichos pacientes tenían una edad avanzada y los niveles de triglicéridos más bajos. Cerca del 50% informó de episodios de hipoglucemia, en su mayoría leves, y las mujeres eran más propensas a informar dichos episodios. El 86% estaban con metformina combinada con SU, más comúnmente glibenclamida (48,6%). Dichos pacientes eran significativamente más jóvenes y más propensos a tener diabetes no controlada.
ConclusionesEste estudio demostró que de una muestra de 397 pacientes con diabetes mellitus tipo 2 tratados con SU solas o en combinación con metformina en Argentina, alrededor del 50% de ellos informaron síntomas de hipoglucemia inducida por SU y un tercio de ellos alcanzaron el objetivo HbA1c<7%.
Tight glycemic control and more intensive treatment regimens for Type 2 diabetes mellitus (T2DM) patients are leading to an increased incidence of hypoglycemia,1,2 which negatively impacts morbidity, mortality, quality of life and adherence to therapy.3–7 Hypoglycemia has been associated with a risk of adverse events, namely cardiovascular, neurological, psychosocial and obesity.4 Two recent large-scale studies reported a high prevalence of hypoglycemia in treated T2DM patients in Europe8 and in the Asia-Pacific region.9 Additionally, these studies highlighted a large degree of variability across regions and countries. A meta-analysis with data from 46 studies also showed a high prevalence of hypoglycemia among T2DM patients on oral therapies and insulin.10
Sulfonylureas are a class of compounds that stimulate insulin secretion and are currently endorsed as a second-line therapy for the treatment of T2DM patients,11 either as monotherapy or in combination with other hypoglycemic agents. Even though newer classes of anti-diabetic drugs exist, sulfonylureas are still a primary choice due to their efficacy, wide availability and low cost.12 However, they are known to cause side effects such as weight gain and the risk of severe hypoglycemia,6,13–15 which leads to other adverse clinical outcomes.
According to the International Diabetes Foundation, in 2015 diabetes had a prevalence of 6% in Argentina, affecting approximately 1.7 million people.26 Yet, no data regarding the real prevalence of hypoglycemia during treatment with sulfonylureas has been reported. A better understanding of glycemic control, and of the prevalence of hypoglycemia in sulfonylurea-treated patients, could help in the planning of therapy intensification or alternatives for better management of the disease. The RECAP-DM program comprises a series of real-world evidence studies aimed to assess the prevalence and characteristics of hypoglycemia associated with the treatment of T2DM in samples of patients from different countries in Asia-Pacific, Europe and Latin-America,14,23 This is the first report obtained from a Latin American country (Argentina). Therefore, the general aims of this observational study are to assess the prevalence and severity of hypoglycemia in a sample of sulfonylurea-treated T2DM patients and their attainment of recommended glycated hemoglobin (HbA1c) levels, based on clinical chart reviews and patient self-reported data, in selected centers in Argentina.
Materials and methodsStudy design and data collectionThis is a real-life, multi-center, retrospective, and cross-sectional study, based on clinical chart reviews including cross-sectional data, and evaluation of patient questionnaires of T2DM patients scheduled for a routine office visit in 16 medical centers across Argentina.
Sixteen centers were selected in Buenos Aires city and in different provinces of the country taking in consideration their expertise in Clinical Research, real-world evidence studies, as well as an adequate number of patients. Most of the centers are specialized in Internal Medicine, Endocrinology, Diabetes and/or Nutrition. Other institutions included 2 Private Hospitals, 1 Respiratory Center, 1 Hematological Center, and 1 Cardiovascular Center.
The study population comprised a sample of consecutive adult patients diagnosed with T2DM patients according to ADA criteria,22 aged 30 years or older, that had been taking sulfonylureas (SU's) either as monotherapy or in combination with metformin for at least 6 months at the time of the study, and whose clinical records were available for at least 6 months preceding the study (regarding patient demographics, risk factors, disease/medication history, resource use and laboratory values).
Exclusion criteria included patients who had been taking DPP4 inhibitors, GLP-1 Receptor agonists, Meglitinides, PPAR-gamma agonists, SGLT2 inhibitors or insulin during the 6 months prior to enrollment. Informed consent was obtained from all study participants prior to data collection.
During the visit, the eligible participants were tested using a capillary blood test for glycated hemoglobin levels (HbA1c) using reactive strips (Siemens DCA system) and completed a survey regarding their self-reported hypoglycemia events.
Self-monitoring of capillary blood glucose was contemplated in the study.
69.1% of patients performed self-monitoring of their blood glucose, of which 27.8% did so several times a week, and 24.1% once a day during the mornings.
The average FPG was 155.43mg/dL with a median of 140mg/dL.
Hypoglycemia registries collected from the clinical charts as well as the history of symptoms compatible with hypoglycemia were taken into consideration for analysis.
Hypoglycemia experience was evaluated through the Experience of Low Blood Sugar (Hypoglycemia) Questionnaire developed by Merck & Co., Inc. and used at all the previous RECAP-DM studies. The questionnaire was designed to measure patients’ experience of hypoglycemia during the previous 6 months. The questionnaire contains 6 items that must be answered by yes or no or using a Likert scale of 5 points and published elsewhere.8,9,21
The symptoms of hypoglycemia described were the following: sweating, confusion/feeling disoriented, trembling, clumsy or spasmodic movements, dizziness, sudden changes in mood or behavior; feeling hungry, tingling sensation around the mouth, headache, difficulty concentrating and/or paleness.
Based on the symptoms, the severity of hypoglycemia episodes were defined as:
- •
Mild hypoglycemia: with little or no interruption of activities.
- •
Moderate hypoglycemia: defined as some interruption of activities, but without needing the assistance to manage its symptoms.
- •
Severe Hypoglycemia: there was a need for assistance from others to manage the symptoms (for example, to provide food or drink).
- •
Very severe hypoglycemia: there was a need for medical attention (for example, calling an ambulance, visiting an emergency room or hospital, or visiting a doctor or nurse).
Data regarding subjects’ demographic characteristics and clinical history were collected at baseline. The prevalence of inadequate glycemic control was determined by comparing the measured HbA1c with recommended clinical guidelines. Both the Sociedad Argentina de Diabetes (Argentina Diabetes Society) and the Asociación Latinoamericana de Diabetes (Latin American Diabetes Association) recommend an HbA1c target of less than 7% (53mmol/mol), therefore this was the cut-off used in the present work.
The study was approved by the ethics committee and conducted according to the applicable local regulatory requirements and laws.
Statistical analysisSample size calculationThe primary objective of this study was to evaluate the prevalence of hypoglycemia in a sample of T2DM patients treated with SU's alone or in combination with metformin. Due to lack of data in Argentina on the prevalence of hypoglycemia, the sample size was calculated based on the observed hypoglycemia prevalence in previous RECAP-DM studies.
Previous RECAP-DM studies conducted in eleven countries across Europe and Asia have reported hypoglycemia prevalence ranging between approximately 0.25 and 0.50 (as proportion). In the Europe RECAP-DM Study, the highest prevalence of hypoglycemia was reported in the UK (0.536).8
Assuming a confidence interval of 95%, a margin of error of ±5% (absolute precision) and a prevalence of 0.50, n=384 was required. In the Argentinean RECAP-DM study, a total of 401 patients were recruited in 16 sites.
Statistical analysisQuantitative variables were summarized by total number of observations (n), mean±standard deviation (SD) and median (minimum–maximum). For categorical variables the total number of observations (n), and the number and frequency distribution (%) were obtained. Missing values were not replaced.
Categorical variables were analyzed using the Chi-square test or Fisher's Exact test, where applicable. Continuous variables were analyzed using Student's t-test for independent samples or the Mann–Whitney non-parametric test, according to the validity assumptions of the statistical test.
Concordance between the hypoglycemia obtained by medical charts and self-reported hypoglycemia was analyzed using kappa concordance coefficient. According to value of kappa concordance coefficient, the strength of agreement was considered as20: poor (<0.20), fair (0.21–0.40), moderate (0.41–0.60), good (0.61–0.80), and very good (0.81–1.00).
Multivariate logistic regression analysis was performed with HbA1c as an outcome variable. Odds ratios and 95% confidence intervals as well as p-values were generated. Only variables with p<0.050 in the bivariate analysis were included in the multivariate logistics model. The optimized model presented only variables with statistically significant odds ratios.
Two-tailed statistical tests with a significance level of 5% were conducted using the SAS software (version 9.4; SAS Institute Inc., Cary, USA).
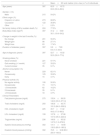
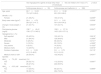
ResultsSocial-demographic and clinical characteristicsFrom a total of 401 patients with T2DM patients, enrolled between July and November 2015 in 16 centers across Argentina, 397 (99%) fulfilled all study criteria and were included in the present analysis. The baseline socio-demographic and clinical characteristics of the study patients are summarized in Table 1. The mean age of T2DM patients was 62.5 years and 54.2% were male. Most of them were Hispanic or Latino (68.9%) and had no family history of myocardial infarction or sudden death (77.5%). The mean body mass index (BMI) was 31.2kg/m2 and 55.5% experienced no change in body weight during the 6 months preceding the study, while 27.1% experienced a gain in body weight. These patients had diabetes, on average, for about 10 years, and their mean age at diagnosis was 52.7 years. More than half of the subjects never smoked (57.7%) or consumed alcohol (62.1%) and very few are current smokers (9.1%) or daily alcohol consumers (4.1%), with almost 50% reporting at least some type of physical activity.
Socio-demographic and clinical characteristics.
| n | Mean±SD and median (min–max) or % of individuals | |
|---|---|---|
| Age (years) | 397 | 62.5±10.72 |
| 63.0 (33.0–89.0) | ||
| Gender, n (%) | ||
| Male | 215 | 54.2% |
| Ethnic origin (%) | ||
| Hispanic or Latino | 273 | 68.9% |
| Caucasian | 122 | 30.8% |
| Other | 1 | 0.3% |
| No family history of MI or sudden death (%) | 224 | 77.5% |
| Body Mass Index (kg/m2) | 397 | 31.2±5.69 |
| 30.1 (19.6–54.2) | ||
| Change in weight in the last 6 months (%) | ||
| No change | 201 | 55.5% |
| Weight gain | 98 | 27.1% |
| Weight loss | 63 | 17.4% |
| Duration of diabetes (years) | 397 | 9.9±7.69 |
| 8.0 (1.0–44.0) | ||
| Age at diagnosis (years) | 397 | 52.7±10.02 |
| 52.0 (30.0–77.0) | ||
| Smoking status (%) | ||
| Never smoked | 221 | 57.7% |
| Quit smoking (>1 month) | 127 | 33.2% |
| Current smoker | 35 | 9.1% |
| Alcohol consumption (%) | ||
| Never | 229 | 62.1% |
| Occasionally | 125 | 33.9% |
| Daily | 15 | 4.1% |
| Physical activity (%) | ||
| No regular activity | 195 | 50.9% |
| Occasionally | 73 | 19.1% |
| <3 times/week | 62 | 16.2% |
| 5 times/week | 35 | 9.1% |
| >5 times/week | 18 | 4.7% |
| Clinical Parameters | ||
| Fast plasma glucose (mg/dl) | 275 | 155.4±56.05 |
| 140.0 (33.0–371.0) | ||
| Total cholesterol (mg/dl) | 250 | 185.8±43.75 |
| 181.0 (84.0–306.0) | ||
| HDL cholesterol (mg/dl | 225 | 45.7±11.32 |
| 44.0 (17.0–89.0) | ||
| LDL cholesterol (mg/dl) | 199 | 107.8±37.98 |
| 107.0 (35.0–224.0) | ||
| Triglycerides (mg/ml) | 236 | 166.6±93.02 |
| 147.0 (1.3–676.0) | ||
| Systolic blood pressure (mmHg) | 302 | 131.1±14.58 |
| 130.0 (80.0–180.0) | ||
| Diastolic blood pressure (mmHg) | 302 | 76.5±9.38 80.0 |
| (50.0–100.0) | ||
MI: myocardial infarction; n: number of patients, SD: standard deviation; min: minimum; max: maximum.
Renal function was evaluated, with a median eGFR that was 94.50ml/min/1.73m2 for the study population. Albuminuria was also evaluated with an average of 91.37μg/ml in the study population.
Clinical parameters from the last 6 months revealed median values of 140.0mg/dl for fast plasma glucose (FPG), 181.0mg/dl for total cholesterol (HDL: 44.0mg/dl; LDL: 107.0mg/dl) and 147.0mg/dl for triglycerides. In addition, the median systolic and diastolic blood pressures were 130.0 and 80.0mm Hg, respectively.
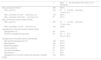
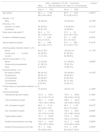
HbA1c levels and hypoglycemic eventsAt study enrollment most patients (99.2%) had their HbA1c levels measured from a capillary blood sample using the Siemens DCA system (Table 2). This revealed a mean HbA1c level of 8.1% (65mmol/mol), with 36.4% of the patients having their diabetes controlled (HbA1c<7% (53mmol/mol), and 22.1% had HbA1c levels under 6.5% (48mmol/mol). Data from the medical charts within the 6 months preceding the study revealed a very similar picture, with mean HbA1c levels of 7.9% (63mmol/mol) and 34.6% of the patients having their diabetes under control (HbA1c<7% (53mmol/mol)). A comparison of socio-demographic and clinical characteristics between patients with adequate control of diabetes (HbA1c<7% (53mmol/mol) and those with inadequate control are presented in Table 3. The age of the patients revealed to be a significant parameter, showing that patients with controlled diabetes were older than those uncontrolled (mean age of 65.4 years versus 60.9 years; p=0.0001), and that the median age at diagnosis was also higher for the controlled patients (54.0 years versus 51.0 years, p=0.0015). Regarding the clinical parameters, only triglycerides showed a significant difference, with controlled patients presenting a lower median value compared with uncontrolled patients (130.0mg/dl versus 162.0mg/dl; p=0.0028). These parameters were included in a multivariable logistic regression that revealed that only age was associated with HbA1ccontrol. Thus, older age increases the probability of having controlled HbA1c levels (OR=1.041 with a 95% CI of [1.020; 1.063], p<0.001).
HbA1c levels and incidence of hypoglycemic events.
| n | Mean±SD and median (min–max) or % of individuals | |
|---|---|---|
| HbA1cat study enrollment | 394 | 99.2% |
| HbA1c level (%) | 393 | 8.1±2.12 (65mmol/mol) |
| 7.4 (4.8–14.0) | ||
| HbA1c controlled (<7% (53mmol/mol)), (%) | 143 | 36.4% |
| HbA1c controlled (<6.5% (48mmol/mol)), (%) | 87 | 22.1% |
| HbA1cin the last 6 months (medical charts) | ||
| HbA1c level (%) | 355 | 7.9±1.87 (63mmol/mol) |
| 7.5 (4.4–14.8) | ||
| HbA1c controlled (<7% (53mmol/mol), (%) | 123 | 34.6% |
| Hypoglycemia in the last 6 months (medical charts) | ||
| Hypoglycemia (%) | 84 | 21.4% |
| Number of hypoglycemic episodes | 76 | 4.9±6.70 |
| 3.0 (1.0–48.0) | ||
| Hypoglycemia in the last 6 months (self-reported) | ||
| Self-reported hypoglycemia (%)a | 180 | 45.5% |
| Mild symptoms | 150 | 84.7% |
| Moderate symptoms | 75 | 43.4% |
| Severe symptoms | 25 | 14.5% |
| Very severe symptoms | 14 | 8.3% |
| All symptoms | 6 | 3.8% |
| Hypoglycemia in the last 6 months (self-reported or medical charts) | 183 | 46.3% |
n: number of patients, SD: standard deviation; min: minimum; max: maximum.
Comparison of socio-demographic and clinical characteristics of patients with adequate and inadequate control of diabetes (cut-off<7%).
| HbA1c controlled (<7% (53mmol/mol)) Mean±SD and median (min–max) or % of individuals | p-value | ||
|---|---|---|---|
| Yes (n=143) | No (n=250) | ||
| Age (years) | 65.4±11.00 66.0 (34.0–89.0) | 60.9±10.27 61.0 (33.0–87.0) | 0.0001a |
| Gender, n (%) | |||
| Male | 78 (36.6%) | 135 (63.4%) | 0.9168b |
| Ethnicity, n (%) | |||
| Hispanic or Latino | 94 (34.6%) | 178 (65.4%) | 0.2113b |
| Caucasian | 49 (41.2%) | 70 (58.8%) | |
| Body mass index (kg/m2) | 30.4±5.1 29.7 (19.8–47.9) | 31.5±6.0 30.5 (19.6–54.2) | 0.1041c |
| Duration of diabetes (years) | 10.7±9.46 8.0 (1.0–44.0) | 9.4±6.46 8.0 (1.0–30.0) | 0.8700c |
| Age at diagnosis (years) | 54.7±9.98 54.0 (30.0–77.0) | 51.6±9.89 51.0 (30.0–77.0) | 0.0015c |
| Smoking status (medical charts), n (%) | |||
| Never | 83 (37.9%) | 136 (62.1%) | 0.7175b |
| Former (quit>1 month) | 44 (35.2%) | 81 (64.8%) | |
| Current | 11 (31.4%) | 24 (68.6%) | |
| Alcohol consumption, n (%) | |||
| Never | 77 (33.8%) | 151 (66.2%) | 0.6659b |
| Occasionally/at weekends | 47 (38.5%) | 75 (61.5%) | |
| Daily | 5 (33.3%) | 10 (66.7%) | |
| Physical activity, n (%) | |||
| No regular activity | 68 (35.4%) | 124 (64.6%) | 0.4142b |
| Occasionally | 26 (63.1%) | 46 (63.9%) | |
| <3 times/week | 29 (46.8%) | 33 (53.2%) | |
| 5 times/week | 10 (28.6%) | 25 (71.4%) | |
| >5 times/week | 6 (33.3%) | 12 (66.7%) | |
| Family history of myocardial infarction, n (%) | |||
| No | 73 (32.9%) | 149 (67.1%) | 0.1090b |
| Clinical parameters | |||
| Fast plasma glucose (mg/dl) | 127.2±36.51 | 172.0±59.24 | 0.1683c |
| 121.0 (74.0–371.0) | 165.0 (33.0–347.0) | ||
| Total cholesterol (mg/dl) | 180.1±44.93 | 188.9±43.02 | 0.1267c |
| 178.5 (100.0–300.0) | 183.0 (84.0–306.0) | ||
| HDL cholesterol (mg/dl) | 45.9±10.15 | 45.4±11.93 | 0.6072c |
| 46.0 (26.0–72.0) | 43.0 (17.0–89.0) | ||
| LDL cholesterol (mg/dl) | 105.7±37.39 | 109.2±38.51 | 0.5652c |
| 107.0 (35.0–218.0) | 107.0 (38.0–224.0) | ||
| Triglycerides (mg/dl) | 151.1±90.82 | 176.5±94.01 | 0.0028c |
| 130.0 (49.0–575.0) | 162.0 (1.3–676.0) | ||
| Systolic blood pressure (mm Hg) | 130.5±14.37 | 131.5±14.86 | 0.3964c |
| 130.0 (87.0–180.0) | 130.0 (80.0–180.0) | ||
| Diastolic blood pressure (mm Hg) | 75.1±8.44 | 77.3±9.79 | 0.0505c |
| 76.0 (59.0–94.0) | 80.0 (50.0–100.0) | ||
Percentages were calculated per row. SD: Standard deviation; min: minimum; max: maximum.
Hypoglycemic events were frequent among the study population, as shown in Table 2. According to recorded data from the 6 months preceding our study, 21.4% of the patients experienced at least one hypoglycemic event, with a median number of 3 episodes per patient. However, self-reported data for the same period shows that more than twice the number of patients (45.5%) felt symptoms of hypoglycemia. The combined data from clinical charts and self-reported events reveals that almost 50% of the T2DM patients experienced at least one episode of hypoglycemia in the 6 months preceding the study. A comparative analysis showed a statistically significant agreement between hypoglycemia events reported in the clinical charts and self-reported data (p<0.0001). The rate of concordant answers was greater than 74.9% and the kappa concordance coefficient show a moderate agreement (kappa=0.4685). The self-reported symptoms of low blood sugar were described as mild in 84.7% of the cases, moderate in 43.4%, severe in 14.5% and very severe in 8.3%. Only 3.8% of the patients reported having all types of symptoms.
Analysis on combined objectives was done. It was observed that 45.5% of patients who were under SUs self-reported hypoglycemia. 52.5% of these patients with SUs achieved an HbA1C below 7%, and 30.9% with HbA1C of 6.5%.
Patients taking SU's+metformin were evaluated, and 45.1% self-reported hypoglycemia. 33.5% of these patients had HbA1c<7% and 20.7% of them reached an HbA1c<6.5%
The analysis of socio-demographic and clinical variables between patients with and without self-reported episodes of hypoglycemia in the 6 months preceding study enrollment (Table 4) revealed that women were more likely to experience hypoglycemia than men (54.4% versus 37.9%, respectively; p=0.0010). There was also a significantly higher proportion of self-reported hypoglycemia in patients with daily alcohol consumption compared to those who never drink or drink occasionally (p=0.0009) and in patients who never smoked (p=0.0211).
Comparison of socio-demographic characteristics of patients with and without self-reported hypoglycemia in the last 6 months.
| Self-reported hypoglycemia Mean±SD and median (min–max)or % of individuals | p-value | ||
|---|---|---|---|
| Yes (n=180) | No (n=216) | ||
| Age (years) | 62.3±10.86 | 62.7±10.62 | 0.1557a |
| 62.5 (33.0–87.0) | 62.5 (33.0–89.0) | ||
| Gender, n (%) | |||
| Male | 81 (37.9%) | 133 (62.1%) | 0.0010b |
| Female | 99 (54.4%) | 83 (45.6%) | |
| Ethnicity, n (%) | |||
| Hispanic or Latino | 120 (44.0%) | 153 (56.0%) | 0.3007b |
| Caucasian | 60 (49.6%) | 61 (50.4%) | |
| Body mass index (kg/m2) | 30.6±5.83 | 31.44+5.56 | 0.1160c |
| 29.7 (19.8–49.0) | 30.5 (19.6–54.2) | ||
| Duration of diabetes (years) | 9.7±7.65 | 10.0±7.74 | 0.5490c |
| 7.5 (1.0–42.0) | 8.0 (1.0–44.0) | ||
| Age at diagnosis (years) | 52.6±10.12 | 52.8±9.98 | 0.8479a |
| 52.0 (30.0–77.0) | 52.0 (30.0–77.0) | ||
| Smoking status (medical charts), n (%) | |||
| Never | 112 (50.7%) | 109 (49.3%) | 0.0211b |
| Former (quit>1 month) | 51 (40.5%) | 75 (59.5%) | |
| Current | 10 (28.6%) | 25 (71.4%) | |
| Alcohol consumption, n (%) | |||
| Never | 117 (51.1%) | 112 (48.9%) | 0.0009b |
| Occasionally/at weekends | 39 (31.5%) | 85 (68.5%) | |
| Daily | 9 (60.0%) | 6 (40.0%) | |
| Physical activity, n (%) | |||
| No regular activity | 82 (42.1%) | 113 (57.9%) | 0.7753b |
| Occasionally | 35 (47.9%) | 38 (52.1%) | |
| <3 times/week | 31 (50.8%) | 30 (49.2%) | |
| 5 times/week | 16 (45.7%) | 19 (54.3%) | |
| >5 times/week | 8 (44.4%) | 10 (55.6%) | |
| Family history of myocardial infarction, n (%) | |||
| No | 95 (42.4%) | 129 (57.6%) | 0.1576b |
Percentages were calculated per row. SD: Standard deviation; min: minimum; max: maximum.
It was observed that only 13.5% of patients who did hypoglycemia were doing physical activity at that moment.
Oral hypoglycemic agents and concomitant medicationDuring the 6 months preceding study enrollment, 85.6% of the patients were using metformin for the treatment of T2DM, making it the most widely used oral hypoglycemic agent. Glibenclamide was the most commonly used sulfonylurea, taken by 48.6% of the patients, followed by glimepiride (32.7%) and gliclazide (19.1%). Glipizide was the least used oral hypoglycemic agent, taken by only 1% of the patients. Most of the patients (76.1%) had no change in their anti-diabetic treatment and 13.6% increased their medication dosage. At study entry, most of the patients (86.0%) were on a combination of metformin and sulfonylurea, and only 14% were on sulfonylurea alone. Sulfonylureas, other than glibenclamide, together with metformin were the most common combination of hypoglycemic agents (44.3%), followed closely by glibenclamide in combination with metformin. There were very few patients on a regimen of metformin, glibenclamide and additional sulfonylureas (0.5%).
At the time of study enrollment, the most common concomitant medications were angiotensin converting enzyme (ACE) inhibitors (22.6%) for hypertensive therapy and statins (28.2%) for lipid-lowering treatment.
76.5% of patients had never taken beta-blockers in their lives and only 13.4% of patients were undergoing treatment with a Beta-Blocker during the course of the study.
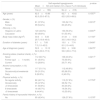
Table 5 presents the comparison between the patients who were on sulfonylurea alone and the patients on a combination of sulfonylurea and metformin regarding their socio-demographic characteristics, episodes of hypoglycemia and HbA1c levels. T2DM patients on sulfonylureas alone were significantly older (69.7 versus 61.3 years, p<0.0001), had lower median BMI (28.8 versus 30.4kg/m2, p=0.0238), and lower median FPG (136.0 versus 142.5mg/dl, p=0.0247) than those on a combination of sulfonylurea and metformin. Additionally, the proportion of patients with controlled diabetes (HbA1c<7% (53mmol/mol) was higher in the patients on sulfonylurea alone when compared to those on a combination therapy of sulfonylurea and metformin (52.7% versus 33.5%, p=0.0061). This difference was no longer apparent if considering a cut-off of HbA1c<6.5% (48mmol/mol). No significant differences in the prevalence of hypoglycemic events, or their self-reported severity, between both treatment groups were found.
Comparison between patients treated with sulfonylureas alone and patients treated with sulfonylureas and metformin regarding their socio-demographic characteristics, episodes of hypoglycemia and HbA1c levels.
| Oral hypoglycemic agents at study entry mean±SD and median (min–max) or % of individuals | p-value | ||
|---|---|---|---|
| Sulfonylureas alone (n=55) | Sulfonylureas and metformin (n=338) | ||
| Age, years | 69.7±10.03 70.0 (47.0–89.0) | 61.3±10.38 62.0 (33.0–88.0) | <0.0001a |
| Gender, n (%) | |||
| Female | 21 (38.2%) | 160 (47.3%) | 0.2065b |
| Body mass index (kg/m2) | 29.4±4.79 28.8 (21.2–41.7) | 31.3±5.81 30.4 (19.6–54.2) | 0.0238c |
| Change in body weight, n (%) | 21 (44.7%) | 137 (44.1%) | 0.9354b |
| Fast plasma glucose (mg/dl) | 138.7±49.41 136.0 (77.0–342.0) | 158.3±57.19 142.5 (33.0–371.0) | 0.0247c |
| Hypoglycemia, n (%) | |||
| Self-reported | 25 (45.5%) | 152 (45.1%) | 0.9614b |
| Mild | 21 (84.0%) | 126 (84.6%) | >0.999d |
| Moderate | 6 (25.0%) | 68 (46.3%) | 0.0741d |
| Severe | 3 (12.0%) | 22 (15.2%) | >0.999d |
| Very severe | 0 (0.0%) | 14 (9.9%) | 0.1323d |
| Medical charts | 14 (25.5%) | 67 (20.1%) | 0.3672b |
| Number of episodes | 9.3±13.55 4.0 (1.0–48.0) | 3.9±3.75 3.0 (1.0–2.0) | 0.4116c |
| Medical charts or self-reported | 28 (50.9%) | 152 (45.2%) | 0.4341b |
| HbA1c<7% (53mmol/mol) (%) | |||
| Yes | 29 (52.7%) | 112 (33.5%) | 0.0061b |
| No | 26 (47.3%) | 222 (66.5%) | |
| HbA1c<6.5% (48mmol/mol) (%) | |||
| Yes | 17 (30.9%) | 69 (20.7%) | 0.0896b |
| No | 38 (69.1%) | 264 (79.3%) | |
Percentages were calculated per column. SD: standard deviation.
The occurrence of hypoglycemia remains one of the major limiting factors in the treatment of diabetes, and has, for a long time, remained an overlooked matter. The occurrence of severe hypoglycemia is a leading cause of visits to the emergency room and hospital admissions,16,17 threatening the patient's health and placing burden on the health care system. However, even moderate hypoglycemia can lead to cognitive and motor impairments and have chronic consequences.18 Previous RECAP-DM studies have shown a high prevalence of hypoglycemia, both in European countries and in the Asia-Pacific region,8,9 and the use of sulfonylureas has been particularly linked to the occurrence of hypoglycemia.6,13–15,19
Our study was the first to analyze the prevalence and severity of hypoglycemia in T2DM patients treated with sulfonylureas in a real-world setting in Argentina. We found that almost half of the T2DM patients self-reported symptoms of hypoglycemia, which heavily contrasted with the 21.4% recorded on medical charts. The disparity in the reporting of hypoglycemic symptoms is further confirmed by the kappa coefficient of 0.4685, which shows only a moderate agreement between medical records and self-reporting. This may be due to incomplete medical charts that do not accurately record patients’ history of hypoglycemia. Another possible contributing factor noted in previous studies is the knowledge gap in the patient's understanding of hypoglycemia, with many attributing the symptoms to the disease rather than to the treatment itself.14,20
The proportion of patients reporting symptoms of hypoglycemia observed in this study is comparable to those reported by patients in previous RECAP-DM studies conducted in Asian and European countries8,9,21 In the vast majority of cases, the reported symptoms were mild, which is in line with other recent studies, where mild hypoglycemic symptoms were the most predominantly reported.8,9 Additionally, significantly more women report hypoglycemic events than men (54% versus 38%). This result is in accordance with other reports showing that women with T2DM patients present a greater risk of hypoglycemia,25 and that the female sex is a potential risk factor in hypoglycemia associated with the use of sulfonylureas.25
T2DM patients that consumed alcohol on a daily basis also reported significantly more hypoglycemic events. Alcohol consumption is an acknowledged risk factor for hypoglycemia in people treated with anti-diabetic medication,25,22 since ethanol impairs gluconeogenesis and delays recovery from hypoglycemia. Surprisingly, patients that never smoked were also more likely to experience hypoglycemia. The reasons for this are unclear since smoking is a risk factor for the development of diabetes, and frequent smoking history has been linked to incident hypoglycemia.7
One important observation in our study was that, despite the large percentage of patients reporting symptoms of hypoglycemia, about 90% (356 patients from 397 patients) of the total patients underwent either no change in medication or even an increase in dosage.
As reported in previous studies, inaction in adjusting anti-diabetic medication dosage can be a strong contributing factor for the development of hypoglycemia.14,27 Therefore, our results may, in fact, reveal a conservative approach to treatment intensification in the face of the high prevalence of hypoglycemic events.
Our study also confirmed and extended the conclusions of numerous other reports, by showing that a large proportion of T2DM patients undergoing hypoglycemic treatment do not present an adequate glycemic control. At study enrollment, only 36.4% of patients had an HbA1c<7% (53mmol/mol), and 22.1% had an HbA1c<6.5% (48mmol/mol). These proportions are only slightly higher than those found in the Taiwanese RECAP-DM study (31.7% and 14.8%, respectively).21 In the European RECAP-DM study, however, the proportion of patients not at HbA1c goal (HBA1c<6.5% (48mmol/mol)) was much higher (92.7%).8 Yet, this study only included patients who had already failed metformin monotherapy, whereas our study included patients either on monotherapy or on combination therapy for T2DM patients
Despite the progressive nature of the disease that leads to declining glycemic control over time, our study revealed that older T2DM patients and those diagnosed at older age, were more likely to have adequate control of diabetes (HbA1c<7% – 53mmol/mol). Similar results were described in a Korean study of T2DM patients under combined metformin and sulfonylurea therapy24 and in the UKPDS study.29 Nevertheless, contrary to the UKPDS study, we found that patients on sulfonylurea monotherapy were more likely to have controlled levels of HbA1c than patients on combination therapy with metformin. In addition, our study does not allow conclusions to be drawn on possible improvements in glycemic goal attainment with changes in treatment regimens due to its cross-sectional nature.
Although the prevalence of CV diseases was not basally evaluated on these patients, information was obtained on major adverse events, among which the major CV events that occurred during the study period were evaluated. In this regard, it was observed that 3% had a major cardiovascular event, including AMI, stroke, CCI, peripheral vascular disease, AF, need for admission to an emergency center and/or the need for hospitalization or performing a medical or surgical procedure for it.
Risk factors must be assessed in order to prevent hypoglycemia. Tailored treatment will reduce the risk as well. The principles of aggressive treatment in order to reduce the risk of hypoglycemia while improving or maintaining glycemic control include patient education and empowerment, rational use of drug regimens, individualization of glycemic goals and continuous professional guidance. Frequent self-monitoring of blood glucose (SMBG) is another important tool.
This study constitutes a real-life setting performed in 16 independent centers in Argentina, which minimizes the potential bias regarding treatment prescription when compared to a single center. Nevertheless, some study limitations should be mentioned. This study was partly based on clinical chart review, which constitutes one of its major limitations due to the missing information and the accuracy of the clinical records. Additionally, major variables of the study, including the prevalence and the severity of hypoglycemia, were self-reported parameters by the patients and can be biased by the individual's perception of the occurrences or willingness to report them. Furthermore, hypoglycemia can be asymptomatic and, therefore, not reported or recorded. Finally, given the cross-sectional nature of the study and the sampling frame, study results may not be necessarily representative of the T2DM patients who take SU's alone or in combination with metformin in Argentina. Future studies with more rigorous designs are needed to investigate the impact of hypoglycemia on patients’ well-being, adherence, and long term clinical outcomes.
In conclusion, this study demonstrated that of a sample of 397 patients with T2DM treated with SU's alone or in combination with metformin in Argentina, around 50% of them reported symptoms of hypoglycemia induced by SU's and only one-third of them achieved target HbA1c<7% levels. A better understanding of the patient's and physician's perspective about diabetes treatment adherence, barriers and satisfaction could provide valuable information for better intervention in diabetes management in Argentina.
Conflicts of interestGC and EF are employees of Merck & Co., Inc., Kenilworth, NJ, USA; MC is employee of MSD Argentina, PA and MH are employees of MSD Latin America.
Argentinean Recap Group: Dra. Sandra Muñoz (Centro Respiratorio Quilmes); Dr. Diego Aizenberg (Centro Médico Viamonte; CABA); Dr. Andrés Francisco Alvarisqueta (Centro de Investigaciones Médicas Mar del Plata); Dra. María Cecilia Cantero (Centro de Investigaciones Clínicas del Litoral); Dr. Alejandro Mario Chertkoff (CEMEDIAB; CABA); Dra. Natacha Maldonado (Instituto de Hematologia y Medicina Clínica Dr. Rubén Davoli, Rosario, Santa Fe); Dr. Lucas Sosa (INIDEN - Instituto de Investigación en Diabetes, Endocrinología y Nutrición de Bahía Blanca); Dr. Pablo Tesolín (Hospital Italiano de Buenos Aires); Dra. Gloria Viñes (Hospital Privado de Comunidad Mar del Plata); Dra. Silvana Solis (Centro Diabetologico Dr Waitman, Córdoba); Dra. Silvina Maria Zabalúa (Centro Médico de Diabetes CEMEDI, Mendoza); Dr. Hugo Daniel Sanabria (Instituto Cardiovascular de Buenos Aires ICBA); Dra. Sonia Griselda Hermida (Consultorio Integral de Atención al Diabético-CIAD, Morón, Bs As); Dra. Graciela Bressi (Centro de Investigaciones Médicas, Florencio Varela, Bs As); Dra. Natalia Cluigt (Instituto de Investigaciones Clínicas de Mar del Plata); Dr. Nelson Rodriguez Papini (Instituto Médico INSARES S.A; Mendoza).
