


The consumption of artificially sweetened beverages (ASBs) has been linked to metabolic alterations. The effect of reducing the regular consumption of these beverages on the metabolism is currently unknown.
ObjectiveTo evaluate the effect of reducing consumption of ASBs on the metabolism in overweight young adults.
DesignA randomised, single-blind, controlled, 12-week, clinical trial was performed in overweight young adults who regularly consume ASBs. The 45 subjects who participated in the study were randomly divided into two groups: (1) control group (n=21) and (2) intervention group (no intake of ASBs, n=24). Body weight and composition, fasting plasma concentrations of glucose, triglycerides, insulin, cholesterol, low-density lipoproteins and high-density lipoproteins were measured at the beginning and end of the study. and the HOMA-IR was calculated.
ResultsAt the end of 12 weeks, the intervention group showed a significant decrease (as opposed to an increase in the control group) in the percentage of change in body weight (−1.22% vs 1.31%, p<0.004), body fat (−6.28% vs 6.15%, p<0.001) and insulin resistance index (−12.06 vs 38.21%, p<0.00002), as well as in levels of glucose (−4.26% vs 0.51%, p<0.05), triglycerides (−14.74% vs 19.90%, p<0.006), insulin (−8.02% vs 39.23%, p<0.00005), cholesterol (−8.71% vs 0.77%, p<0.01) and LDL (−9.46% vs 9.92%, p<0.004).
ConclusionA reduction in habitual consumption of ASBs in overweight young adults decreases biochemical measurements, body weight and composition, suggesting a participation in the metabolic processes.
El consumo de bebidas endulzadas artificialmente (BEA) se ha relacionado con alteraciones metabólicas. Actualmente, no se ha descrito claramente el efecto de la reducción del consumo regular de estas bebidas sobre el metabolismo.
ObjetivoEvaluar el efecto de la disminución del consumo de BEA sobre el metabolismo en adultos jóvenes con sobrepeso.
DiseñoSe realizó un ensayo clínico aleatorizado, ciego, controlado durante 12 semanas, en adultos jóvenes con sobrepeso y consumo regular de BEA. Los 45 sujetos que participaron en el estudio fueron divididos aleatoriamente en 2 grupos: (1) control (n=21) y (2) intervención (sin ingesta de BEA, n=24). Se realizaron mediciones al inicio y final del estudio del peso y composición corporal, concentraciones plasmáticas de glucosa en ayunas, triglicéridos, insulina, colesterol, lipoproteínas de baja y alta densidad, y se calculó el HOMA-IR.
ResultadosAl final de las 12 semanas, el grupo de intervención mostró una disminución significativa (a diferencia del aumento en el grupo control) en el porcentaje de cambio del peso corporal (−1,22 vs. 1,31%; p<0,004), la grasa corporal (−6,28 vs. 6,15%; p<0,001) y el índice de resistencia a la insulina (−12,06 vs. 38,21%; p<0,00002), así como en los niveles séricos de glucosa (−4,26 vs. 0,51%; p<0,05), triglicéridos (−14,74 vs. 19,90%; p<0,006), insulina (−8,02 vs. 39,23%; p<0,00005), colesterol (−8,71 vs. 0,77%; p<0,01) y lipoproteínas de baja densidad (−9,46 vs. 9,92%; p<0,004).
ConclusiónLa reducción del consumo habitual de BEA en adultos jóvenes con sobrepeso disminuye las mediciones bioquímicas, el peso y la composición corporal, evidenciando una participación en los procesos metabólicos.
Excess body weight and obesity are a continuously increasing worldwide epidemic that has become a major public health problem. In 2016, the World Health Organization (WHO) estimated that over 1.9 billion adults were diagnosed as overweight or obese. Moreover, life expectancy is predicted to be reduced by 3 years by 2050 due to this problem.
These pathologies are mainly the result of poor eating habits and a sedentary lifestyle.1–3 The high consumption of sugar sweetened foods (SSFs) and sugar sweetened beverages (SSBs) contributes to the incidence and increased prevalence of overweight and obesity, and is associated with negative health outcomes including type 2 diabetes mellitus (T2DM), cardiovascular diseases and metabolic syndrome.
In the last few years, worldwide efforts have been made to develop new strategies to fight obesity,4 such as the development of non-caloric artificial sweeteners (ASs) to substitute “sugar” in SSBs and SSFs in order to decrease caloric intake. These products were developed to have the same organoleptic features to caloric sweeteners, with the benefit of containing minimal or zero calories.5 Thus, treatment guidelines for overweight and obese individuals recommend their use as part of a nutritional treatment to decrease caloric intake.6 Due to this, there has been an increase in production and consumption of products containing ASs.7–9
Nonetheless, recent studies correlate the consumption of artificially sweetened beverages (ASBs) with deregulation of metabolic homeostasis, promoting physiological modifications such as increased body weight and blood glucose.10 A reduction in the consumption of SSBs and ASBs decreased weight and body fat in young adults,11 as well as in women with T2DM, after substituting the consumption of ASBs for water.12 Some cohort studies reported an association between consumption of ASBs and increase in body weight and waist circumference.13 Likewise, it has been described that consumption of ASs increased glucose and insulin concentrations in blood.10,14 Taking into account that ASs are recommended to the diabetic, overweight and obese population, it is important to determine whether these substances have any effect on human metabolism.10,15,16 Here we evaluated the effect of reducing the consumption of ASBs in overweight young adults.
Materials and methodsStudy designWe performed a single-blinded, parallel, randomised, 12-week clinical trial at Universidad Veracruzana, Mexico, from February to September 2017. Overweight young adults with regular consumption of ASBs were randomly allocated to a 12-week ASB non-consumption intervention group or a control group.
Study populationWe included male and female volunteers between 19 and 27 years of age with body mass index (BMI) of 25–35kg/m2, low-intensity physical activity and ASB consumption of at least 3 servings per week (1 serving=250ml). We excluded anyone reporting hyper- or hypothyroidism, pregnancy and those who performed moderate to high physical activity or who ingested medication that could interfere with their biochemical and anthropometric parameters. Those who had metabolic complications during the study were also excluded. The study is registered at clinicaltrials.gov (NCT03679689).
EthicsThis study was approved by the Research and Human Investigation Ethics Committee of our institution (D005/2017) and performed in accordance with the Helsinki Declaration. All procedures were explained to all subjects participating in this study, who provided written informed consent. No adverse events or unintended harm were reported by any of the participating subjects.
Randomisation and intervention procedureThe selection process consisted of an interview confirming fulfilment of selection criteria. The interview included a food-frequency questionnaire adapted to explore the consumption of food and beverages containing ASs, and a physical activity questionnaire validated for the Mexican population.17 Participants were randomly allocated to the control or intervention group (1:1 allocation ratio) using Microsoft Office Excel. Blinded allocation was done by an external collaborator. A blood sample, anthropometric measures and body composition were taken to establish basal data. To establish basal food intake, a 24-h questionnaire was applied. The intervention group was not allowed to consume ASBs. However, they could consume beverages with no ASs in their formula. Both groups continued normal food habits. Anthropometric measurements, 24-h food recall and food frequency questionnaire data were again collected at weeks 6 and 12. Blood samples were taken at study week 12.
To obtain the ASB and ASF portions consumed, an adapted food-frequency instrument was used.
Anthropometry and body composition measurementsBody weight and fat evaluation was performed using bioelectric impedance (SECA quadra 808, professional). Size was measured with a stadiometer (SECA 20). Subjects wore lightweight clothes and were bare foot. BMI was calculated dividing total body weight (kilograms) by height squared (m2), and then classified according to the WHO standards (overweight ≤25kg/m2, obese ≤30kg/m2).
Biochemical markersFasting blood samples were analysed for glucose, triglycerides, cholesterol, low-density lipoprotein (LDL), high-density lipoprotein (HDL) by enzymatic colorimetry (Spinreact, Girona, Spain). Insulin plasma levels were determined by ELISA (MCA DIGAMEX, Mexico). The Homeostatic Model Assessment of Insulin Resistance (HOMA-IR) formula was used.27
Caloric intakeCaloric intake of macro- and micronutrients was measured at weeks 0, 6 and 12, using the 24-h food recall and food frequency questionnaire. The data was analysed with Food Processor® v9.7.5 (ESHA Research, USA), to determine nutrient values (calories, macronutrients, fibre and sugars).
AdherenceEach participant received a weekly text message as a reminder of their participation in the project. The intervention group message included a reminder to interrupt consumption of ASBs.
Statistical analysisSample size was calculated using a known population from a previous survey performed by our group to detect overweight and obese young adults with regular consumption of ASBs, resulting in a zα=1.96 and 0.05 significance level. The estimated sample was 26 subjects in each group, including an extra 20% for losses to follow-up. The data analysis was performed using the SPSS Statistics 21.0 software (IBM, USA). Variable distribution was evaluated with the Shapiro-Wilk test and is represented as means±standard deviation or medians with interquartile range, according to each variable distribution. Qualitative variables were presented as absolute frequencies and percentages. To compare baseline measurements between groups, the Student's t-test and Mann–Whitney U tests were used, based on data distribution. In order to compare changes between baseline and 12-week measurement, percentage of change was calculated, and the Mann–Whitney U test applied for comparisons between groups. To compare the changes between baseline and 12-week measurement in the same group, the Wilcoxon matched-pairs test was applied. A logistic regression was performed to evaluate biochemical, anthropometry and body composition parameters. A p value <0.05 was considered statistically significant.
Data availabilityThe datasets generated and/or analysed during the current study are available from the corresponding author on reasonable request.
ResultsBaseline characteristicsA total of 47 volunteers were randomly selected for the study. Of these, 45 participants (31 women and 14 men) complied with the 12-week intervention. The sample was divided into a control group (n=21; 70.83% women, 29.16% men) and an intervention group (n=24; 66.6% women, 33.3% men) (Fig. 1).

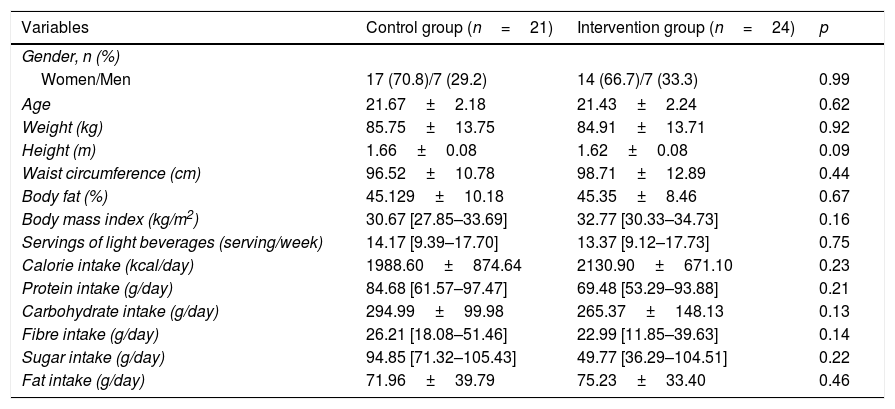
Baseline characteristics and the statistical differences between groups are shown in Table 1. The average age of the entire population was 21.44±2.1 years. According to the BMI, 28.8% of participants were overweight and 71.2% obese. Considering inclusion criteria, all participants consumed more than 3 portions of ASBs per week with an average of ASB consumption of 14.06±7.38 portions per week. There was no significant statistical difference between groups in basal biochemical parameters or HOMA-IR. Caloric intake average of our population was 2,055.01±780.87kcal.
Baseline characteristics according to study groups.
| Variables | Control group (n=21) | Intervention group (n=24) | p |
|---|---|---|---|
| Gender, n (%) | |||
| Women/Men | 17 (70.8)/7 (29.2) | 14 (66.7)/7 (33.3) | 0.99 |
| Age | 21.67±2.18 | 21.43±2.24 | 0.62 |
| Weight (kg) | 85.75±13.75 | 84.91±13.71 | 0.92 |
| Height (m) | 1.66±0.08 | 1.62±0.08 | 0.09 |
| Waist circumference (cm) | 96.52±10.78 | 98.71±12.89 | 0.44 |
| Body fat (%) | 45.129±10.18 | 45.35±8.46 | 0.67 |
| Body mass index (kg/m2) | 30.67 [27.85–33.69] | 32.77 [30.33–34.73] | 0.16 |
| Servings of light beverages (serving/week) | 14.17 [9.39–17.70] | 13.37 [9.12–17.73] | 0.75 |
| Calorie intake (kcal/day) | 1988.60±874.64 | 2130.90±671.10 | 0.23 |
| Protein intake (g/day) | 84.68 [61.57–97.47] | 69.48 [53.29–93.88] | 0.21 |
| Carbohydrate intake (g/day) | 294.99±99.98 | 265.37±148.13 | 0.13 |
| Fibre intake (g/day) | 26.21 [18.08–51.46] | 22.99 [11.85–39.63] | 0.14 |
| Sugar intake (g/day) | 94.85 [71.32–105.43] | 49.77 [36.29–104.51] | 0.22 |
| Fat intake (g/day) | 71.96±39.79 | 75.23±33.40 | 0.46 |
HOMA-IR=Homeostasis Model Assessment of Insulin Resistance. Data is presented as a (%), mean (SD) or median (IOR p25th–p75th).
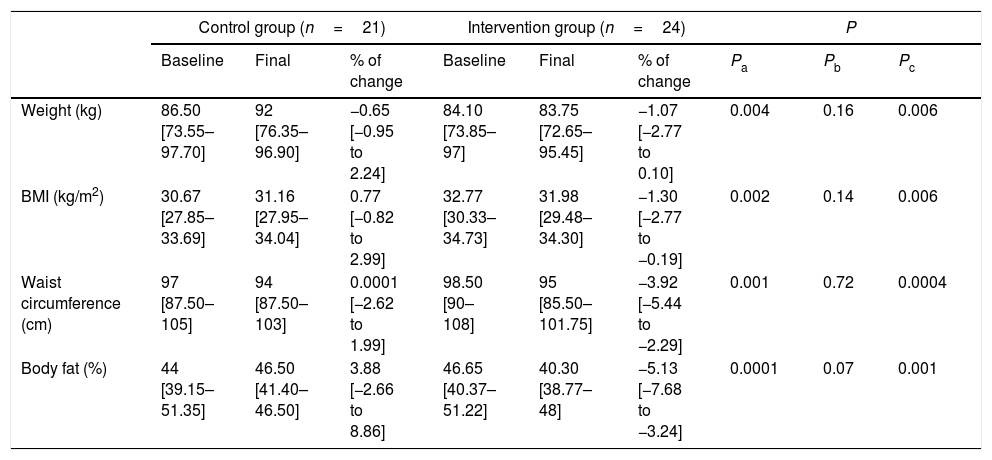
After 12 weeks of follow-up, body weight showed differences between baseline and final measurements between groups. Stopping ASB consumption reduced body weight in the intervention group, while in the control group it increased. When comparing the percentage of change between groups, the intervention group significantly reduced body weight (−1.07 [−2.77 to 0.10]%; p<0.004). As expected, the percentage of change of BMI in the intervention group decreased similarly to body weight (Table 2).
Anthropometry and body composition.
| Control group (n=21) | Intervention group (n=24) | P | |||||||
|---|---|---|---|---|---|---|---|---|---|
| Baseline | Final | % of change | Baseline | Final | % of change | Pa | Pb | Pc | |
| Weight (kg) | 86.50 [73.55–97.70] | 92 [76.35–96.90] | −0.65 [−0.95 to 2.24] | 84.10 [73.85–97] | 83.75 [72.65–95.45] | −1.07 [−2.77 to 0.10] | 0.004 | 0.16 | 0.006 |
| BMI (kg/m2) | 30.67 [27.85–33.69] | 31.16 [27.95–34.04] | 0.77 [−0.82 to 2.99] | 32.77 [30.33–34.73] | 31.98 [29.48–34.30] | −1.30 [−2.77 to −0.19] | 0.002 | 0.14 | 0.006 |
| Waist circumference (cm) | 97 [87.50–105] | 94 [87.50–103] | 0.0001 [−2.62 to 1.99] | 98.50 [90–108] | 95 [85.50–101.75] | −3.92 [−5.44 to −2.29] | 0.001 | 0.72 | 0.0004 |
| Body fat (%) | 44 [39.15–51.35] | 46.50 [41.40–46.50] | 3.88 [−2.66 to 8.86] | 46.65 [40.37–51.22] | 40.30 [38.77–48] | −5.13 [−7.68 to −3.24] | 0.0001 | 0.07 | 0.001 |
Values are represented as medians (IQRs) according to variables distribution.
a Differences between percentage change values of the control group and intervention group using the Mann–Whitney U test.
b Differences between baseline and final values in the control group using the Wilcoxon matched pairs test.
c Differences between baseline and final values in the intervention group using the Wilcoxon matched pairs test.
Moreover, we evaluated changes in waist circumference measured at baseline and after 12 weeks of intervention. Both groups decreased waist circumference, but a comparison of the percentage of change between groups showed that stopping ASB intake significantly decreased waist circumference. Also, the intervention group significantly decreased body fat compared to control group (Table 2).
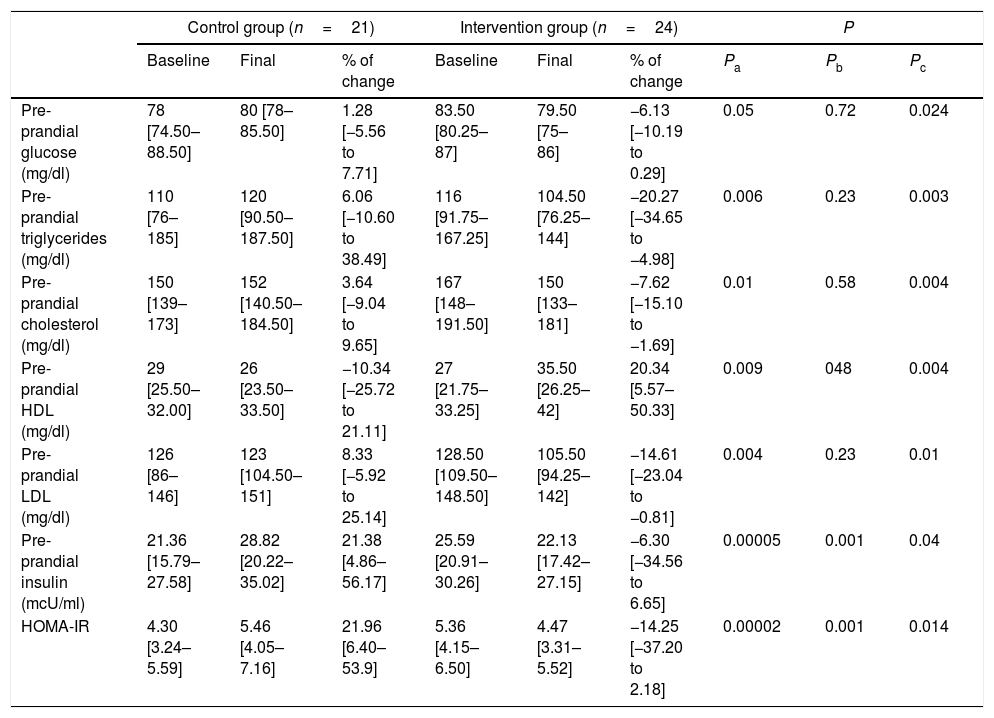
Metabolic outcomesAnalysis of metabolic profiles at the end of the study showed significant changes between groups. In the intervention group, plasma glucose levels decreased while in the control group it increased. Comparison of the percentage of change between groups showed how the intervention significantly decreased glucose levels. Insulin plasma levels also significantly decreased in the intervention group. As expected, the HOMA-IR showed a parallel pattern, increasing in the control group while in the intervention group this index decreased. Comparison of the percentage of change between groups showed a significant decrease in HOMA-IR in the intervention group (Table 3).
Changes in metabolic outcomes.
| Control group (n=21) | Intervention group (n=24) | P | |||||||
|---|---|---|---|---|---|---|---|---|---|
| Baseline | Final | % of change | Baseline | Final | % of change | Pa | Pb | Pc | |
| Pre-prandial glucose (mg/dl) | 78 [74.50–88.50] | 80 [78–85.50] | 1.28 [−5.56 to 7.71] | 83.50 [80.25–87] | 79.50 [75–86] | −6.13 [−10.19 to 0.29] | 0.05 | 0.72 | 0.024 |
| Pre-prandial triglycerides (mg/dl) | 110 [76–185] | 120 [90.50–187.50] | 6.06 [−10.60 to 38.49] | 116 [91.75–167.25] | 104.50 [76.25–144] | −20.27 [−34.65 to −4.98] | 0.006 | 0.23 | 0.003 |
| Pre-prandial cholesterol (mg/dl) | 150 [139–173] | 152 [140.50–184.50] | 3.64 [−9.04 to 9.65] | 167 [148–191.50] | 150 [133–181] | −7.62 [−15.10 to −1.69] | 0.01 | 0.58 | 0.004 |
| Pre-prandial HDL (mg/dl) | 29 [25.50–32.00] | 26 [23.50–33.50] | −10.34 [−25.72 to 21.11] | 27 [21.75–33.25] | 35.50 [26.25–42] | 20.34 [5.57–50.33] | 0.009 | 048 | 0.004 |
| Pre-prandial LDL (mg/dl) | 126 [86–146] | 123 [104.50–151] | 8.33 [−5.92 to 25.14] | 128.50 [109.50–148.50] | 105.50 [94.25–142] | −14.61 [−23.04 to −0.81] | 0.004 | 0.23 | 0.01 |
| Pre-prandial insulin (mcU/ml) | 21.36 [15.79–27.58] | 28.82 [20.22–35.02] | 21.38 [4.86–56.17] | 25.59 [20.91–30.26] | 22.13 [17.42–27.15] | −6.30 [−34.56 to 6.65] | 0.00005 | 0.001 | 0.04 |
| HOMA-IR | 4.30 [3.24–5.59] | 5.46 [4.05–7.16] | 21.96 [6.40–53.9] | 5.36 [4.15–6.50] | 4.47 [3.31–5.52] | −14.25 [−37.20 to 2.18] | 0.00002 | 0.001 | 0.014 |
Values are represented as medians (IQRs) according to variables distribution.
a Differences between percentage change values of the control group and intervention group using the Mann–Whitney U test.
b Differences between baseline and final values in the control group using the Wilcoxon matched pairs test.
c Differences between baseline and final values in the intervention group using the Wilcoxon matched pairs test.
In the intervention group, triglyceride levels decreased, while increasing in the control group. Comparison of the percentage of change between both groups also showed a significant decrease of triglycerides plasma levels in the intervention group (Table 3).
Participants in the intervention group also showed significant changes in cholesterol, LDL and HDL plasma levels. Cholesterol and LDL levels decreased in the intervention group versus the control group, while plasma HDL significantly increased in the intervention group (Table 3). These results showed improvement of biochemical parameters in overweight and obese individuals when stopping ASB consumption, suggesting an influence of ASBs in energy metabolism.
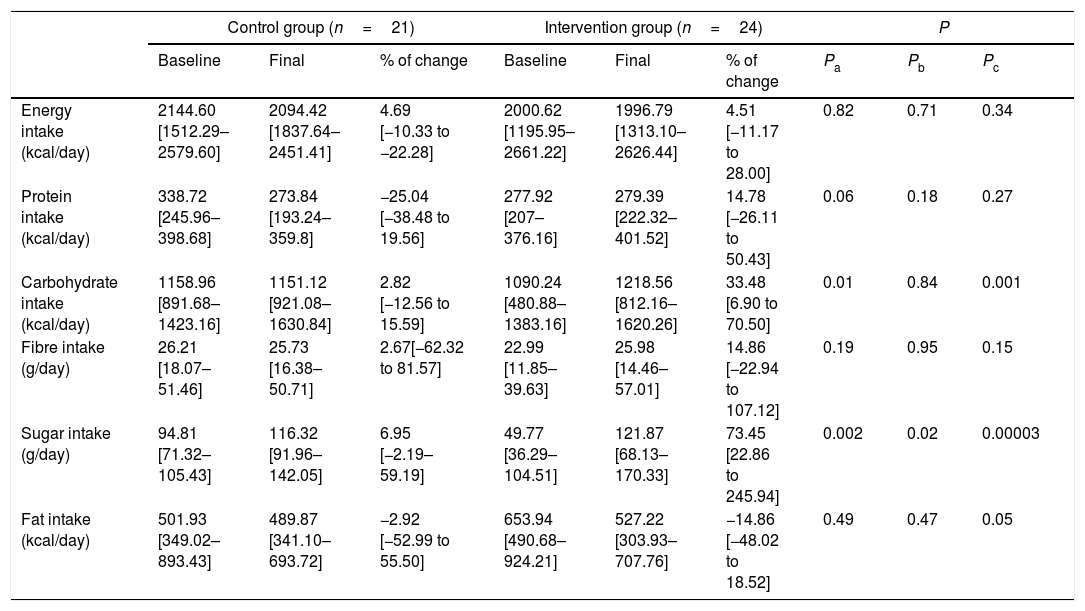
Caloric intakeNo significant changes were found in calorie, fat, protein or fibre intake after the 12-week intervention. However, interestingly, the daily intake of carbohydrates and sugar significantly increased in the intervention group. The distribution of carbohydrate consumption was 35.6% sugar-sweetened beverages and 64.4% sugar-sweetened food (Table 4).
Changes in caloric intake.
| Control group (n=21) | Intervention group (n=24) | P | |||||||
|---|---|---|---|---|---|---|---|---|---|
| Baseline | Final | % of change | Baseline | Final | % of change | Pa | Pb | Pc | |
| Energy intake (kcal/day) | 2144.60 [1512.29–2579.60] | 2094.42 [1837.64–2451.41] | 4.69 [−10.33 to −22.28] | 2000.62 [1195.95–2661.22] | 1996.79 [1313.10–2626.44] | 4.51 [−11.17 to 28.00] | 0.82 | 0.71 | 0.34 |
| Protein intake (kcal/day) | 338.72 [245.96–398.68] | 273.84 [193.24–359.8] | −25.04 [−38.48 to 19.56] | 277.92 [207–376.16] | 279.39 [222.32–401.52] | 14.78 [−26.11 to 50.43] | 0.06 | 0.18 | 0.27 |
| Carbohydrate intake (kcal/day) | 1158.96 [891.68–1423.16] | 1151.12 [921.08–1630.84] | 2.82 [−12.56 to 15.59] | 1090.24 [480.88–1383.16] | 1218.56 [812.16–1620.26] | 33.48 [6.90 to 70.50] | 0.01 | 0.84 | 0.001 |
| Fibre intake (g/day) | 26.21 [18.07–51.46] | 25.73 [16.38–50.71] | 2.67[−62.32 to 81.57] | 22.99 [11.85–39.63] | 25.98 [14.46–57.01] | 14.86 [−22.94 to 107.12] | 0.19 | 0.95 | 0.15 |
| Sugar intake (g/day) | 94.81 [71.32–105.43] | 116.32 [91.96–142.05] | 6.95 [−2.19–59.19] | 49.77 [36.29–104.51] | 121.87 [68.13–170.33] | 73.45 [22.86 to 245.94] | 0.002 | 0.02 | 0.00003 |
| Fat intake (kcal/day) | 501.93 [349.02–893.43] | 489.87 [341.10–693.72] | −2.92 [−52.99 to 55.50] | 653.94 [490.68–924.21] | 527.22 [303.93–707.76] | −14.86 [−48.02 to 18.52] | 0.49 | 0.47 | 0.05 |
Values are represented as medians (IQRs) according to variables distribution.
a Differences between percentage change values of the control group and intervention group using the Mann–Whitney U test.
b Differences between baseline and final values in the control group using the Wilcoxon matched pairs test.
c Differences between baseline and final values in the intervention group using the Wilcoxon matched pairs test.
To corroborate if changes in biochemical markers and body composition were attributed to caloric intake, we performed a bivariate logistic regression. To perform this analysis, we created a dichotomous variable according to the percentage of change of biochemical markers and body composition (decrease and no change/increment) for the intervention and control groups, and the logistic regression according to the previously described influence that caloric intake variables have on changes in biochemical parameters. No significant association was found.
Likewise, we used a bivariate logistic regression to corroborate the effect of the intervention on anthropometry, body composition and biochemical parameters. We decided to adjust the variables with statistical significance in a Wilcoxon analysis. This analysis showed a significant association between reducing consumption of ASBs and weight (OR=1.628, CI 95% 1.439–1.901, p=0.01), waist circumference (OR=1.727, CI 95% 1.577–1.916, p=0.007), body fat (OR=1.857, CI 95% 1.766–1.958, p=0.007), triglycerides (OR=1.973, CI 95% 1.952–1.995, p=0.01), HDL (OR=1.028, CI 95% 1.006–1.050, p=0.01), LDL (OR=1.964, CI 95% 1.935–1.994, p=0.02) and insulin (OR=1.966, CI 95% 1.941–1.992, p=0.01) levels.
DiscussionIn the present study, we showed that 12-week restriction of ASB consumption reduced anthropometric and biochemical metabolic parameters in overweight and obese young adults. Paradoxically, an increase in carbohydrate consumption (especially sugar) was observed in those participants that stopped drinking ASBs. Appleton et al. described that low consumption of ASs increased appetite in response to sweet taste.18 Our results suggest that restriction of ASB consumption increased the necessity to replace the absence of ASBs’ sweet taste. However, further studies are needed to elucidate the effect of a constant reduction on sweet taste receptor stimulation with ASs in metabolic and psychologic response, and if these effects are correlated with the increase in sugar consumption.
Campolo et al. described that high insulin concentrations for long periods of time promote an inadequate increase in insulin sensibility and glucose transporter transcription.19 Our results showed a population with high concentration of blood insulin (normal range 5–20mcU/ml), possibly contributing to the development of cardiometabolic diseases such as insulin resistance and T2DM, through modification of normal glucose and lipid absorption and metabolism.20
We also reported a significant increase in the intake of carbohydrates and sugars in subjects who reduced their consumption of ASBs. Although the intervention group was only restricted in their intake of ASBs, but not SSBs, we expected higher consumption of SSBs in this group. However, the distribution of carbohydrates in the intervention group was 35.6% from ASBs, with 64.4% from sugar-sweetened food. Based on the past statement, we cannot associate the increase of sugar intake with the replacement of ASBs by SSBs. Several authors have demonstrated that the AS consumption did not have an effect on caloric intake.21 Nevertheless, in our study we observed that the reduction of ASB consumption increased sugar-sweetened food consumption. This could be related to a metabolic imbalance caused by AS intake, which was previously reported.22 Moreover, in a cross-sectional study, AS consumption was associated with an increase in caloric intake (especially sugar), and a reduction in the consumption of some vitamins,23 supporting our findings.
Conversely, calculating the percentage of change between weeks 0 and 12 of the intervention, we observed that weight, BMI and waist circumference decreased when young normal consumers reduced their ASB consumption. In contrast, subjects who continued consuming ASBs slightly increased their weight. Similar behaviour was described when comparing water versus ASB consumption for 6 months in healthy subjects. Consumers of ASBs increased their weight and BMI while those who consumed water significantly reduced their waist circumference.11 It is important to mention that in our study, the intervention only reduced the consumption of ASBs, and not SSBs, during a period of 12 weeks as opposed to 6 months. However, these data suggest it only takes 12 weeks of intervention to observe significant and measurable changes in metabolic parameters. Moreover, Madjd et al. reported a decrease in weight and BMI in T2DM women when ASB consumption was exchanged for water for 24 weeks.12 Additionally, a meta-analysis evaluating the relationship between low-calorie sweeteners and body weight and composition, showed a slight decrease in weight and BMI compared to the change in the AS intake per caloric sweeteners.24 Similarly, Fowler et al. reported the relationship between ASB consumption and long-term weight, BMI and waist circumference increases in a dose response manner.13 All these data suggest that the restriction of ASB consumption decreases weight, BMI and waist circumference.
Furthermore, we show that subjects with restricted ASB consumption for 12 weeks had decreased blood glucose and insulin concentrations, while triglycerides, cholesterol and LDL increased. Several authors have proposed different mechanisms to explain the increase in blood glucose and insulin concentrations, which at the same time modifies other parameters, including cholesterol and triglycerides. First, the activation of sweet taste receptors by ASBs25 in mouth and intestinal cells prepares the organism for glucose reception, activating glucose transporters and insulin receptors, interfering with normal metabolic responses and modifying energetic homeostasis. Another proposed mechanism is the activation of metabolic enzymes responsible for the accumulation of glucose and insulin in the bloodstream. The literature has shown that consumption of ASs by obese subjects increased blood levels of insulin, peptide C and GLP-1.10 A third mechanism has been suggested as a change in the gut microbiome of mice consuming ASs, promoting an increase in glucose concentrations.15 Similar results were found when supplying acesulfame K or Neotame, showing an alteration of intestinal microbiota conformation and increased glucose concentrations and body weight.26,27
The HOMA-IR index allows the evaluation of the homeostatic balance between the production of insulin and the concentrations of glucose in the blood. A value above 2.5 in this index is associated with insulin resistance. Being overweight and obese has been related to the development of insulin resistance. The participants in our study had an average baseline in the HOMA-IR index over the recommended value. This result implies that most of our studied population were insulin resistant. However, participants who reduced their consumption of ASBs decreased their HOMA-IR score by almost 15%. Accumulating evidence suggests that the consumption of ASs increases the risk of developing T2DM, which is widely related to insulin resistance.28 Nevertheless, there is still no consensus regarding the interaction of ASs with metabolism. Therefore, more studies must be performed in the future for a determining conclusion.
According to the scientific literature, excess insulin in the blood promotes the formation of triglycerides from free fatty acids. The participants in this study presented baseline serum triglyceride values within the values suggested by the WHO. However, triglyceride concentrations decreased significantly after the elimination of ASB consumption. In this regard, it has been stated that the excess of triglycerides in the blood is stored in adipose tissue, which increases its volume, therefore causing an increase in body weight and in body fat percentage.16,29 Likewise, Wilcox et al. described that high blood insulin concentration decreases cholesterol absorption.30 Although there was no significant difference in the percentage of change in fat intake after 12 weeks of intervention, we did observe a 14% decrease (not significant) in fat intake in the intervention group. However, results from bivariate logistic regression showed no significant association between reduced fat intake in the intervention group and changes in anthropometric and biochemical variables. Future research should include food intake control to elucidate the association between the decrease in AS consumption, fat consumption and biochemical and anthropometric parameters.
There are several limitations for this study. We did not include the exact amount of AS intake from ASBs as this information is not available in the nutritional information given on these beverages. Although the sample size provided sufficient power to distinguish statistically significant effects, it may not be representative of the general population as there is no detailed information regarding the prevalence of ASB consumption. Finally, we did not have complete information regarding the AS intake in each participant's consumed food.
This study demonstrated that a reduction of ASB consumption decreases blood glucose concentrations and insulin secretion, which favours a decrease in weight and body fat percentage, waist circumference, triglycerides and cholesterol concentration after 12 weeks’ follow-up, with an increase in the consumption of simple sugars. The decrease in biochemical values described within our intervention group participants suggests that changes in energy metabolism may occur with only a reduction of ASB consumption. Therefore, our results support the hypothesis that reduction of ASB consumption in overweight and obese subjects could prevent the development of cardiometabolic diseases such as T2DM. It is important to mention that our findings do not represent a recommendation to increase sugar intake. However, future studies should consider the amount of AS content in ASBs and their interaction with other components in the formula such as sugars.
FundingThis work was funded by the CONACYT programme grants 261689 and 256639 and Promep 23753. PEVW was supported by the CONACYT Postgraduate Scholarship Scheme: 366086.
Author contributionsPEVW, OLF, LCM and MFM designed and conducted the research, analysed the data and wrote the paper. GA provided feedback on the report. RCZ, JCRA and MAGM analysed the data. All authors read and approved the final manuscript.
Conflicts of interestThe authors declare no conflict of interest.
We thank Prof. Stuart Nicklin (University of Glasgow, UK) for English proofreading, José Manuel Aguilar Hernández and Rosa Alicia Vera Alatorre for technical assistance, and Dr Beatriz Torres Flores for advice and guidance.
