


The role of ADIPOQ gene rs266729 variants on weight loss after a dietary intervention are still unclear.
ObjectiveTo analyze the effects of the ADIPOQ gene rs266729 variant n weight loss, cardiovascular risk factors, and adiponectin levels after two hypocaloric diets with different dietary fatty profiles.
DesignA population of 362 obese patients was enrolled in a randomized clinical trial with two diets (Diet M, monounsaturated fat-enriched diet, and Diet P, polyunsaturated-fat enriched diet). Anthropometric measurements, an assessment of nutritional intake, and biochemical tests were performed at baseline and after 12 weeks.
ResultsWeight loss was similar with both diets. After Diet M, only subjects with CC genotype showed significant improvements in total cholesterol (CC vs. CG±GG) (−9.0±1.1mU/L vs. −4.5±2.4mg/dL, p=0.01), LDL cholesterol (−6.0±1.1mg/dL vs. −3.0±0.9mg/dL, p=0.03), glucose (−4.7±1.1mg/dL vs. −0.6±0.5mg/dL, p=0.01), and insulin levels (−2.6±1.0mU/L vs. −0.7±0.3mU/L, p=0.02) and in HOMA-IR (−0.5±0.2 units vs. −0.2±0.4 units, p=0.03). The same improvement was reported after Diet P in all parameters, including total cholesterol (CC vs. CG±GG) (−8.0±1.2mU/L vs. −2.1±1.4mg/dL, p=0.02), LDL cholesterol (−7.3±1.2mg/dL vs. −2.1±0.8mg/dL, p=0.02), glucose (−3.2±0.1mg/dL vs. −0.2±0.5mg/dL, p=0.01), and insulin levels (−2.5±1.0mU/L vs. −1±0.6mU/L, p=0.02) and HOMA-IR (−0.5±0.1 units vs. −0.3±0.4 units, p=0.02). Only subjects with CC genotype showed significant increases in adiponectin levels after both diets: (Diet M: 10.3±2.0ng/dL vs. Diet P: 9.3±2.9ng/dL, p=0.43).
ConclusionThe CC genotype of ADIPOQ gene rs266729 variant is associated to increased adiponectin levels and decreases in LDL cholesterol, glucose, insulin, and HOMA-IR levels after weight loss.
El papel de las variantes del gen ADIPOQ en la pérdida de peso después de una intervención dietética sigue sin estar claro.
ObjetivoNuestro objetivo fue analizar los efectos de la variante rs266729 del gen ADIPOQ sobre la pérdida de peso, los factores de riesgo cardiovascular y los niveles de adiponectina después de 2 dietas hipocalóricas con diferentes perfiles de grasas en la dieta.
DiseñoUna población de 362 pacientes obesos se incluyeron en un ensayo clínico aleatorizado con 2 dietas (dieta M: dieta enriquecida con grasas monoinsaturadas y dieta P: dieta enriquecida con grasas poliinsaturadas). Antes y tras 12 semanas, se realizó una evaluación antropométrica, evaluación de la ingesta nutricional y un análisis bioquímico.
ResultadosLa pérdida de peso fue similar con ambas dietas. Después de la dieta M, solo los sujetos con genotipo CC mostraron una mejoría significativa en el colesterol total (CC vs. CG±GG) (−9,0±1,1mU/l vs. −4,5±2,4mg/dl; p=0,01), colesterol LDL (−6,0±1,1mg/dl vs. −3,0±0,9mg/dl; p=0,03), glucosa (−4,7±1,1mg/dl vs. −0,6±0,5mg/dl; p=0,01), niveles de insulina (−2,6±1,0mU/l vs. −0,7±0,3mU/l; p=0,02) y HOMA-IR (−0,5±0,2 unidades vs. −0,2±0,4 unidades; p=0,03). La misma mejora en todos los parámetros se informó después de la dieta P; niveles de colesterol total (CC vs. CG±GG) (−8,0±1,2mU/l vs. −2,1±1,4mg/dl; p=0,02), colesterol LDL (−7,3±1,2mg/dl vs. −2,1±0,8mg/dl; p=0,02), glucosa (−3,2±0,1mg/dl vs. −0,2±0,5mg/dl; p=0,01), niveles de insulina (−2,5±1,0mU/l vs. −1±0,6mU/l; p=0,02) y HOMA-IR (−0,5±0,1 unidades vs. −0,3±0,4 unidades; p=0,02). Solo los sujetos con genotipo CC mostraron un aumento significativo de los niveles de adiponectina después de ambas dietas: (dieta M: 10,3±2,0ng/dl vs. dieta P: 9,3±2,9ng/dl; p=0,43).
ConclusiónEl genotipo CC de la variante rs266729 del gen ADIPOQ se asocia con aumentos en los niveles de adiponectina y disminución del colesterol LDL, glucosa, insulina y HOMA-IR tras la pérdida de peso.
Adiponectin is the most quantitatively abundant adipokine secreted by adipocytes, which is known to regulate insulin sensitivity and glucose metabolism1 and concentrations of adiponectin are reduced in obese subjects. Adiponectin is encoded by the adiponectin C1Q and collagen domain containing (ADIPOQ) gene, which located on chromosome 3q27. In humans, associations have been found between many polymorphisms in ADIPOQ and adiponectin concentrations, insulin resistance and obesity.2 The most common single nucleotide polymorphism (SNP) of this gene is rs266729 (−11,377C>G), it is located in the proximal promoter region of the ADIPOQ gene. Data in the literature indicates that ADIPOQ rs266729 polymorphism functionally regulates adiponectin promoter activity and adiponectin levels.3 Moreover, ADIPOQ rs266729 has been found to be correlated with circulating adiponectin levels in obesity.4 This ADIPOQ variant has been identified to be associated with high body mass index, insulin resistance and diabetic nephropathy.5–7
The effect of weight loss or dietary interventions on metabolic response taking to account this SNP is scarce in the literature. For example, the Finnish Diabetes Prevention Study (Caucasian population) showed that the genetic variant of ADIPOQ gene rs266729 contributes to variation in body weight and serum adiponectin concentrations.8 Hsiao et al.9 show that this genetic variant may contribute to weight reduction in response to an antiobesity drug such as sibutramine. A recent study10 has demonstrated that C allele of this genetic variant is a predictor of better lipid profile after weight loss secondary to a bariatric surgery. This SNP influence in the modification of adiponectin levels, insulin and HOMA.IR after a huge loss of weight secondary to a biliopancreatic diversion,11 too. In addition, the effect of modifying the fatty acid profiles of the diet has not been compared, and it may be a relevant fact when this polymorphism modifies the metabolic response secondary to weight loss
Our aim was to analyze the effects of rs266729 of ADIPOQ gene on weight loss, cardiovascular risk factors and serum adipokine levels after two hypocaloric diets with different dietary fatty profile.
Subjects and methodsSubjects and clinical investigationWe conducted a prospective study approved by the Ethics Committee (HCUVA Committee 05/2017) and it was in accordance with the guidelines laid down in the Declaration of Helsinki. The intent-to-treat population consisted of 362 unrelated obese patients in a randomized clinical trial with two different diets. Subjects were recruited from Primary Care Physicians of an urban area of Spain. Data of these subjects were collected at the beginning and after 12 weeks of dietary treatment and all participants provided written informed consent. All the recruited patients fulfilled the next inclusion criteria; age between 25 and 65 years old and a body mass index (BMI)≥30kg/m2. Subjects with a history of thyroid disease, cardiovascular disease, renal or hepatic disorders, history of alcoholism, malignant tumor, and within the 6 months before the study were receiving medications known to influence lipid (hormonal therapy, glucocorticoids and anti-inflammatory drugs) or glucose levels (sulfonylureas, thiazolidinedione, insulin, GLP-1 receptor antagonists, DPP-IV inhibitors, metformin) were excluded.
The first endpoint was body weight loss after 12 weeks versus baseline. The second endpoints were cardiovascular risk factors and serum adiponectine changes. All anthropometric parameters (weight, height, body mass index (BMI), waist circumference, fat mass by impedance) and blood pressure were recorded at basal time and after 12 weeks. Blood samples were collected in EDTA-treated and plain tubes after a 12h overnight fast for analysis of insulin, total cholesterol, LDL-cholesterol, HDL-cholesterol, triglycerides and leptin, total adiponectin and resistin levels. The variant of ADIPOQ gene was assessed at basal time by polymerase chain reaction at real-time.
Dietary interventionThe subjects in this interventional study received individualized counseling on diet and exercise. As above-mentioned, patients were randomly allocated to one of two diets for a period of 12 weeks (Diet M, enriched in monounsaturated fatty acids) and Diet P (enriched in polyunsaturated fatty acids) restricting 500 daily calories to the usual intake. The target percentage of energy derived from carbohydrate, fat and protein in the two diets were; Diet M P (46.6% of carbohydrates, 34.1% of lipids and 19.2% of proteins) and Diet P (45.7% of carbohydrates, 34.4% of lipids and 19.9% of proteins). The distribution of fats in Diet M was; 21.7% of saturated fats, 67.5% of monounsaturated fats and 10.8% of polyunsaturated fats. The distribution of fats in Diet P was; 21.8% of saturated fats, 55.5% of monounsaturated fats and 22.7% of polyunsaturated fats (7g per day of w-6 fatty acids, 2g per day of w-3 fatty acids and a ratio w6/w3 of 3.5). The recommended physical activity consisted of an aerobic exercise at least two times per week (60min each).
All enrolled subjects received instruction to record their daily dietary intake for seven non-consecutive days including a weekend day. A dietitian assessed this adherence each fourteen days with a phone call in order to improve accomplishment. Dietary records were analyzed using a computer-based data evaluation system, including national composition food tables as reference12 (Dietosource®, Ge,Swi). The patient with a self-reported questionnaire recorded the exercise activity.
Biochemical and adipokine assaysPlasma glucose levels were measured using an automated glucose oxidase method (Glucose analyser 2, Beckman Instruments, Fullerton, California). Insulin was measured by radioimmunoanalysis (RIA) (RIA Diagnostic Corporation, Los Angeles, CA) with a sensitivity of 0.5mUI/L (normal range 0.5–30mUI/L)13 and the homeostasis model assessment for insulin resistance (HOMA-IR) was calculated using these values14 with the next formula: HOMA-IR=(glucose×insulin/22.5). Serum total cholesterol and triglyceride concentrations were determined by enzymatic colorimetric assay (Technicon Instruments, Ltd., New York, N.Y., USA), while HDL cholesterol was determined enzymatically in the supernatant after precipitation of other lipoproteins with dextran sulphate-magnesium. LDL cholesterol was calculated using Friedewald formula.15
All adipokine levels were measured by enzyme-linked immunosorbent assay (ELISA). Resistin was measured by ELISA (Biovendor Laboratory, Inc., Brno, Czech Republic) with a sensitivity of 0.2ng/ml with a normal range of 4–12ng/ml.16 Leptin was measured by ELISA (Diagnostic Systems Laboratories, Inc., Texas, USA) with a sensitivity of 0.05ng/ml and a normal range of 10–100ng/ml.17 Adiponectin was measured by ELISA (R&D systems, Inc., Mineapolis, USA) with a sensitivity of 0.246ng/ml and a normal range of 8.65–21.43ng/ml.18
Genotyping ADIPOQ geneDNA was isolated from blood samples using QIAamp® DNA blood kit following the manufacture's instructions. To extract DNA we use 200uL of blood. Oligonucleotide primers and probes were designed with the Beacon Designer 5.0 (Premier Biosoft International®, LA, CA). The polymerase chain reaction (PCR) was carried out with 50ng of genomic DNA, 0.5μL of each oligonucleotide primer (primer forward: 5′-ACGTTGGATGATGTGTGGCTTGCAAGAACC-3′ and reverse 5′-ACGTTGGATGCAACATTCAACACCTTGGAC-3′ in a 2μL final volume (Termociclador Life Tecnologies, LA, CA). DNA was denaturated at 90°C for 2min; this was followed by 50 cycles of denaturation at 90°C for 20s, and annealing at 56.1°C for 50s). The PCR were run in a 25μL final volume containing 10.5μL of IQTM Supermix (Bio-Rad®, Hercules, CA) with hot start Taq DNA polymerase Hardy Weimberg equilibrium was assessed with a statistical test (Chi-square) to compare our expected and observed counts. The variant was in Hardy Weimberg equilibrium (p=0.28).
Anthropometric parameters and blood pressure determinationWeight and height were measured with an electrical scale (Omrom, LA, CA) and a telescopic height-measuring instrument (Omrom, LA, CA). Body weight was measured in the morning while the subjects were minimally unclothed and not wearing shoes. Body mass index (BMI) was calculated as body weight (in kg) divided by height (in m2). Waist circumference (WC) was measured with a flexible non-stretchable measuring tape (Type SECA, SECA. Birmingham, UK). Bio impedance was used to determine body composition with an accuracy of 5g19 (EFG, Akern, It). Blood pressure was measured twice after a 10min rest with a random zero mercury sphygmomanometer (Omrom, Los Angeles, Calif., USA), and averaged.
Statistical analysisSample size was calculated to detect differences over 2kg in body weight loss with 90% power and 5% significance (n=170 in each dietary group). Numerical variables with normal distribution were analyzed with a two-tailed Student's t-test. Non-parametric variables were analyzed with the Mann–Whitney's U-test. Categorical variables were analyzed with the chi-square test, with Yates correction as necessary, and Fisher's test. The statistical analysis to evaluate the gene – diet interaction was a univariate ANCOVA using gender, and baseline weight. Correction for multiple hypothesis testing for single SNP analyses was performed. A Chi square test was used to evaluate the Hardy–Weinberg equilibrium. All analyses were performed under a dominant genetic model with rs266729 G-allele as the risk allele (GG+GC vs. CC). A p-value<0.05 was considered significant. All the data were analyzed using SPSS for Windows, version 19.0 software package (SPSS Inc., Chicago, IL).
ResultsThree hundred and sixty two obese subjects were enrolled in the study (197 CC (53.6%), 142 CG (33.1%) and 23 GG (6.3%)). All patients completed the 12-weeks follow-up period without dropouts. The mean age of the all group was 49.1±7.2 years (range: 28–62) and the mean BMI 37.9±4.3kg/m2 (range: 31.8–40.3). Sex distribution was 260 women (71.8%) and 102 men (28.2%). Age was similar in both genotype groups (wild type (CC) vs. mutant type (CG+GG)) (48.1±7.1 years vs 49.9±6.0 years: ns). Sex distribution was similar in both genotype groups, males (27.1% vs 29.2%) and females (72.9% vs 70.8%).
In the 177 subjects (97 CC as wild genotype and 68 CG/12 GG as mutant genotype (CG+GG)) treated with diet M, basal dietary intake with a 3 days written food record showed a calorie intake of 2008.6±302.1kcal/day with the next distribution of macronutrients: carbohydrate intake of 210.1±21.1g/day (44.0% of calories), fat intake of 81.1±12.3g/day (34.6% of calories) and protein intake of 87.2±17.1g/day (22.4% of calories). During the dietary intervention, these patients reached the right recommendations of the diet M; 1436.6 calories per day (45.0% of carbohydrates, 34.1% of lipids and 20.9% of proteins). The distribution of dietary fats was; 20.1% of saturated fats, 68.1% of monounsaturated fats and 11.8% of polyunsaturated fats. Physical activity was similar in both genotype groups (54.1±14.3min/week vs 52.3±13.2min/week: p=0.52).
In the 175 obese patients (100 CC as wild genotype and 74 CG/11 GG as mutant genotype (CG+GG)) treated with diet P, basal evaluation of dietary intakes with a 3 days written food record showed a calorie intake of 2009.8±342.4kcal/day with the next macronutrient distribution: carbohydrate intake of 210.1±50.0g/day (44.2% of calories), fat intake of 80.0±21.3g/day (35.6% of calories) and protein intake of 86.0±27.1g/day (20.2% of calories). During the 3 months of dietary intervention, these obese subjects reached the recommendations of diet P; 1468.1 calories per day (45.1% of carbohydrates, 34.3% of lipids and 20.6% of proteins). The distribution of fats was; 20.3% of saturated fats, a 53.9% of monounsaturated fats and a 23.8% of polyunsaturated fats (6.9g per day of w-6 fatty acids, 1.8g per day of w-3 fatty acids and a ratio w6/w3 of 3.7). Physical activity was similar in both genotype groups (54.1±12.3min/week vs 55.1±1302min/week: p=0.46).
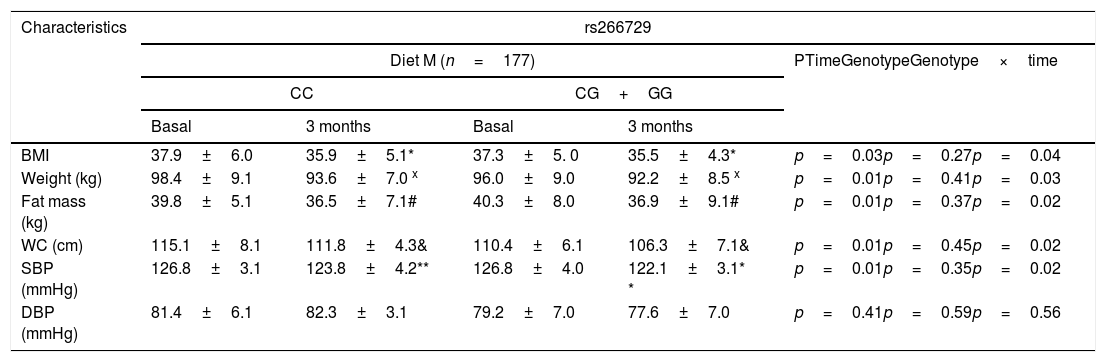
As indicated in Table 1, there were no significant genotype related differences (baseline and after dietary intervention) in anthropometric parameters and blood pressure. After both dietary caloric restriction strategies with two different profile of dietary fatty acids, body weight, body mass index (BMI), fat mass, waist circumference and systolic blood pressure decreased. Obese patients with both genotypes (CC vs. CG+GG) after Diet M showed similar improvement in body weight (−4.8±1.3kg vs. −4.9±1.3kg: p=0.31), BMI (−2.0±0.2kg/m2 vs. −1.8±0.5kg/m2: p=0.16), fat mass (−3.3±1.2kg vs. −3.5±1.2kg: p=0.41), waist circumference (−3.3±1.1cm vs. −3.4±0.9cm: p=0.22) and systolic blood pressure (−6.0±3.0mmHg vs. −4.7±2.3mmHg: p=0.41). After caloric restriction with Diet P, both genotype groups (CC vs. CG+GG) showed also similar decrease in body weight (−4.1±1.2kg vs. −4.6±1.3kg: p=0.23), BMI (−2.1±0.1kg/m2 vs. −2.2±0.3kg/m2: p=0.38), fat mass (−3.1±1.2kg vs. −3.4±1.4kg: p=0.61), waist circumference (−3.9±1.3cm vs. −4.1±1.2cm: p=0.41) and systolic blood pressure (−4.2±3.1mmHg vs. −5.7±2.2mmHg: p=0.31), too. The improvements in all below-mentioned parameters were similar with both diets.
Anthropometric variables and blood pressure at basal time and after both dietary intervention (mean±SD).
| Characteristics | rs266729 | ||||
|---|---|---|---|---|---|
| Diet M (n=177) | PTimeGenotypeGenotype×time | ||||
| CC | CG+GG | ||||
| Basal | 3 months | Basal | 3 months | ||
| BMI | 37.9±6.0 | 35.9±5.1* | 37.3±5. 0 | 35.5±4.3* | p=0.03p=0.27p=0.04 |
| Weight (kg) | 98.4±9.1 | 93.6±7.0 x | 96.0±9.0 | 92.2±8.5 x | p=0.01p=0.41p=0.03 |
| Fat mass (kg) | 39.8±5.1 | 36.5±7.1# | 40.3±8.0 | 36.9±9.1# | p=0.01p=0.37p=0.02 |
| WC (cm) | 115.1±8.1 | 111.8±4.3& | 110.4±6.1 | 106.3±7.1& | p=0.01p=0.45p=0.02 |
| SBP (mmHg) | 126.8±3.1 | 123.8±4.2** | 126.8±4.0 | 122.1±3.1* * | p=0.01p=0.35p=0.02 |
| DBP (mmHg) | 81.4±6.1 | 82.3±3.1 | 79.2±7.0 | 77.6±7.0 | p=0.41p=0.59p=0.56 |
| rs266729 | |||||
|---|---|---|---|---|---|
| Diet P (n=185) | PTimeGenotypeGenotype×time | ||||
| CC | CG+GG | ||||
| Basal | 3 months | Basal | 3 months | ||
| BMI | 38.0±4.1 | 35.9±4.2* | 37.9±4.1 | 35.8±4.1* | p=0.01p=0.48p=0.02 |
| Weight (kg) | 96.1±12.2 | 92.0±8.1 x | 96.6±7.1 | 92.0±7.0 x | p=0.01p=0.59p=0.03 |
| Fat mass (kg) | 39.3±6.1 | 36.2±5.1# | 38.6±7.1 | 35.1±5.9# | p=0.01p=0.48p=0.02 |
| WC (cm) | 113.9±8.1 | 110.0±6.1& | 112.2±8.0 | 108.1±4.0& | p=0.01p=0.51p=0.01 |
| SBP (mmHg) | 128.3±9.1 | 124.1±7.0* * | 127.9±7.1 | 123.1±7.9** | p=0.01p=0.48p=0.02 |
| DBP (mmHg) | 83.1±5.0 | 80.2±5.1 | 83.2±5.1 | 81.1±5.5 | p=0.51p=0.70p=0.49 |
BMI: body mass index DBP, diastolic blood pressure; SBP, systolic blood pressure; WC, waist circumference; Statistical differences in each genotype group (* BMI, x Weight, #fat mass, & WC, **SBP). No statistical differences between genotype groups. In the column “p”, “time” is the p value between basal and at 3 months values, “genotype” is the p value at basal’ time between each genotype and at 3 months’ time between each genotype, “time×genotype” is the p value of the interaction.
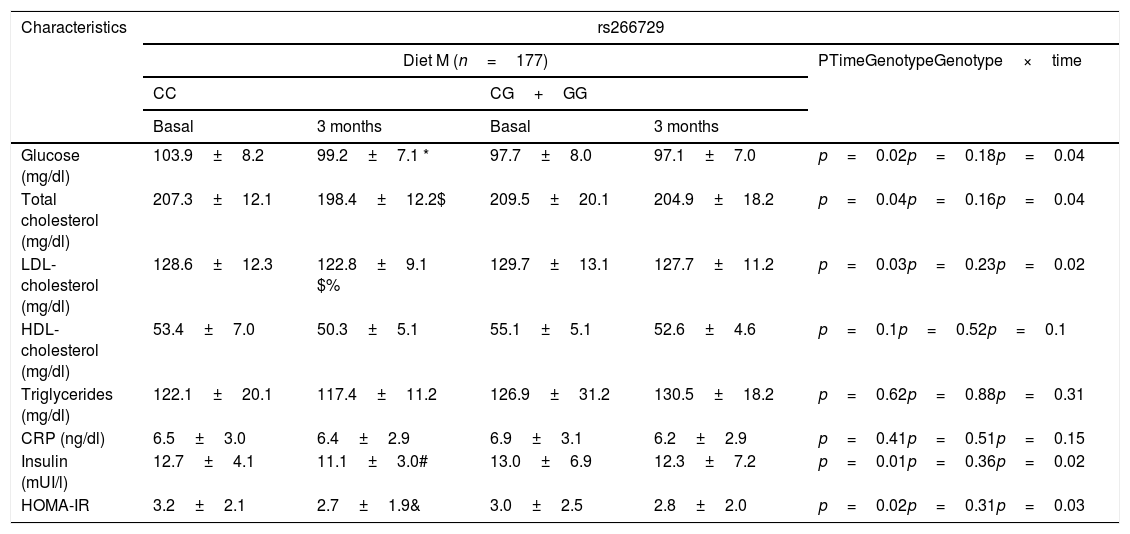
Table 2 shows biochemical parameters. No statistical differences were detected among baseline and post-treatment values of these variables between both genotypes (CC vs. CG+GG. After dietary intervention with a monounsaturated enriched hypocaloric diet (Diet M), only subjects with CC genotype showed a significant improvement in total cholesterol levels (CC vs. CG+GG) (−9.0±1.1mU/L vs. −4.5±2.4mg/dl: p=0.01), LDL-cholesterol (−6.0±1.1mg/dl vs. −3.0±0.9mg/dL: p=0.03), glucose (−4.7±1.1mg/dl vs. −0.6±0.5mg/dl: p=0.01), insulin levels (−2.6±1.0mU/L vs. −0.7±0.3mU/L: p=0.02) and HOMA-IR (−0.5±0.2 units vs. −0.2±0.4 units: p=0.03). The same improvement in both parameters was reported after a polyunsaturated enriched hypocaloric diet (Diet P) and only subjects with CC genotype showed a significant improvement in total cholesterol levels (CC vs. CG+GG) (−8.0±1.2mU/L vs. −2.1±1.4mg/dl: p=0.02), LDL-cholesterol (−7.3±1.2mg/dl vs. −2.1±0.8mg/dL: p=0.02), glucose (−3.2±0.1mg/dl vs. −0.2±0.5mg/dl: p=0.01), insulin levels (−2.5±1.0mU/L vs. −1±0.6mU/L: p=0.02) and HOMA-IR (−0.5±0.1 units vs. −0.3±0.4 units: p=0.02).
Biochemical parameters at basal time and after both dietary intervention (mean±SD).
| Characteristics | rs266729 | ||||
|---|---|---|---|---|---|
| Diet M (n=177) | PTimeGenotypeGenotype×time | ||||
| CC | CG+GG | ||||
| Basal | 3 months | Basal | 3 months | ||
| Glucose (mg/dl) | 103.9±8.2 | 99.2±7.1 * | 97.7±8.0 | 97.1±7.0 | p=0.02p=0.18p=0.04 |
| Total cholesterol (mg/dl) | 207.3±12.1 | 198.4±12.2$ | 209.5±20.1 | 204.9±18.2 | p=0.04p=0.16p=0.04 |
| LDL-cholesterol (mg/dl) | 128.6±12.3 | 122.8±9.1 $% | 129.7±13.1 | 127.7±11.2 | p=0.03p=0.23p=0.02 |
| HDL-cholesterol (mg/dl) | 53.4±7.0 | 50.3±5.1 | 55.1±5.1 | 52.6±4.6 | p=0.1p=0.52p=0.1 |
| Triglycerides (mg/dl) | 122.1±20.1 | 117.4±11.2 | 126.9±31.2 | 130.5±18.2 | p=0.62p=0.88p=0.31 |
| CRP (ng/dl) | 6.5±3.0 | 6.4±2.9 | 6.9±3.1 | 6.2±2.9 | p=0.41p=0.51p=0.15 |
| Insulin (mUI/l) | 12.7±4.1 | 11.1±3.0# | 13.0±6.9 | 12.3±7.2 | p=0.01p=0.36p=0.02 |
| HOMA-IR | 3.2±2.1 | 2.7±1.9& | 3.0±2.5 | 2.8±2.0 | p=0.02p=0.31p=0.03 |
| Characteristics | rs266729 | ||||
|---|---|---|---|---|---|
| Diet P (n=185) | PTimeGenotypeGenotype×time | ||||
| CC | CG+GG | ||||
| Basal | 3 months | Basal | 3 months | ||
| Glucose (mg/dl) | 101.2±10.1 | 98.0±8.3 | 101.1±10.2 | 99.9±8.2 | p=0.01p=0.10p=0.02 |
| Total cholesterol (mg/dl) | 207.2±8.0 | 199.2±9.0$ | 195.9±11.9 | 194.8±12.1 | p=0.01p=0.16p=0.02 |
| LDL-cholesterol (mg/dl) | 130.5±21.0 | 123.2±9.1% | 120.8±22.1 | 118.4±10.1 | p=0.02p=0.16p=0.03 |
| HDL-cholesterol (mg/dl) | 51.7±6.2 | 50.5±5.0 | 48.8±9.0 | 48.9±7.1 | p=0.19p=0.41p=0.28 |
| Triglycerides (mg/dl) | 131.1±13.1 | 124.8±9.2 | 139.1±11.9 | 137.2±8.1 | p=0.60p=0.81p=0.23 |
| CRP (ng/dl) | 6.2±3.1 | 6.3±2.0 | 6.5±3.0 | 5.9±3.1 | p=0.58p=0.79p=0.31 |
| Insulin (mUI/l) | 13.4±5.0 | 11.9±3.2# | 12.9±6.0 | 11.9±8.1 | p=0.01p=0.32p=0.04 |
| HOMA-IR | 3.4±1.1 | 2.9±1.0& | 3.3±2.6 | 3.1±2.1 | p=0.02p=0.36p=0.04 |
CRP: C reactive protein. HOMA-IR (homeostasis model assessment).; Statistical differences in each genotype group(* glucose, # Insulin, & HOMA IR, $ Total cholesterol, %LDL cholesterol). No statistical differences between genotype groups. No statistical differences between genotype groups. In the column “p”, “time” is the p value between basal and at 3 months values, “genotype” is the p value at basal’ time between each genotype and at 3 months’ time between each genotype, “time×genotype” is the p value of the interaction.
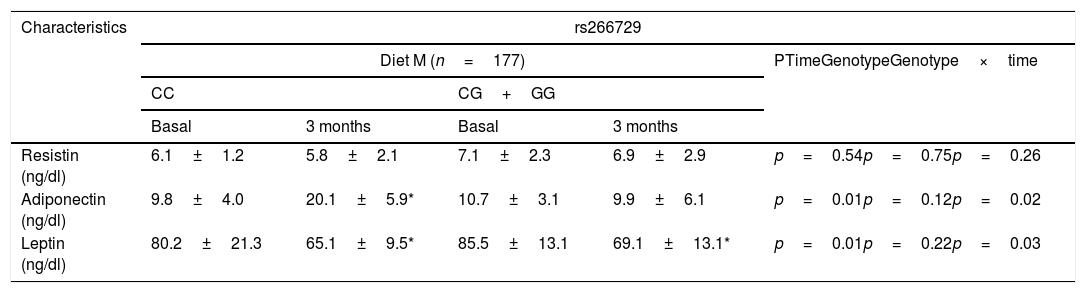
Table 3 shows levels of adipokines. No differences were detected among baseline and post-treatment values of serum adipokine levels between both genotypes. Only subjects with CC genotype showed a significant increase of adiponectin levels after both diets: (Diet M: 10.3±2.0ng/dl vs. Diet P: 9.3±2.9ng/dl: p=0.43). After both hypocaloric diets, leptin levels decreased in both genotypes in a similar way (Table 3).
Adipokines and cytokine levels (mean±SD).
| Characteristics | rs266729 | ||||
|---|---|---|---|---|---|
| Diet M (n=177) | PTimeGenotypeGenotype×time | ||||
| CC | CG+GG | ||||
| Basal | 3 months | Basal | 3 months | ||
| Resistin (ng/dl) | 6.1±1.2 | 5.8±2.1 | 7.1±2.3 | 6.9±2.9 | p=0.54p=0.75p=0.26 |
| Adiponectin (ng/dl) | 9.8±4.0 | 20.1±5.9* | 10.7±3.1 | 9.9±6.1 | p=0.01p=0.12p=0.02 |
| Leptin (ng/dl) | 80.2±21.3 | 65.1±9.5* | 85.5±13.1 | 69.1±13.1* | p=0.01p=0.22p=0.03 |
| Characteristics | rs266729 | ||||
|---|---|---|---|---|---|
| Diet P (n=185) | PTimeGenotypeGenotype×time | ||||
| CC | CG+GG | ||||
| Basal | 3 months | Basal | 3 months | ||
| Resistin (ng/dl) | 7.1±1.2 | 7.6±11 | 6.2±1.1 | 5.1±0.9 | p=0.61p=0.72p=0.24 |
| Adiponectin (ng/dl) | 10.9±6.1 | 20.2±5.2* | 11.0±8.9 | 13.7±9.0 | p=0.03p=0.41p=0.04 |
| Leptin (ng/dl) | 81.3±10.1 | 62.8±8.3* | 80.7±7.1 | 63.2±8.1* | p=0.01p=0.21p=0.03 |
p<0.05, in each genotype group. No statistical differences between genotype groups. In the column “p”, “time” is the p value between basal and at 3 months values, “genotype” is the p value at basal’ time between each genotype and at 3 months’ time between each genotype, “time×genotype” is the p value of the interaction.
Our study is one of the few that has shown that ADIPOQ variant rs266729 is significantly associated with weight decrease, cholesterol levels, insulin resistance changes and adiponectin after two different moderate caloric restriction with different fatty dietary profile in obese subjects. Non G-allele carriers showed a better response of glucose, HOMA-IR, insulin, total cholesterol, LDL-cholesterol and adiponectin levels than G-allele carriers after both diets. Thus, a promising finding reported for the first time was that this ADIPOQ gene variant may play an important role in modulating treatment outcomes with dietary interventions.
There are some studies showing the association between rs266729 and obesity and its associated pathologies as diabetes mellitus type 2 and metabolic syndrome,20–21 but there is few data about the influence of weight loss on this association in interventional designs. There are five interventional designs in the literature, two studies have been performed with a non-surgical intervention8–9 and three after a bariatric surgery.10,11,22
The first non-surgical study has been realized with an anti-obesity drug (sibutramine). Hsiao et al.9 reported a significantly greater weight loss and far for ADIPOQ rs266729 CC genotype as compared to the placebo group during a 12-week period. This study included non Caucasian patients, 44 in the placebo group and 87 in the sibutramine group with 10mg daily. In fact, the study population was different of our design and the weight reduction was higher (7.9kg) than our data. The other study was an analysis of the Finnish Diabetes Prevention Program,8 a randomized, controlled multicenter study with a dietary intervention of reduction in the intake of total fat<30%, saturated fat to <10% of daily energy and increase of dietary fiber to at least 15g per 1000kcal The authors showed that G allele carriers had higher weight after 4-year follow-up and C allele was associated with an increased risk of developing diabetes mellitus type 2. This curious result, association of higher posttreatment body weight and lower diabetes mellitus, seems therefore that the effect of this ADIPOQ variant on glucose metabolism is independent of its effect on body weight.
The first surgical interventional study was realized with a Roux Y gastroenterostomy.10 In the design 60 morbid obese subjects were evaluated after 32 months, individuals with C allele were more prone to show a reduction in LDL-cholesterol levels (−43%) after bariatric surgery vs (−18%) in G allele carriers. The decrease in LDL cholesterol in this study was higher than our findings (5%), possibly related to greater weight loss after bariatric surgery (35%) than in our work with nutritional intervention (5%). In this surgical intervention, weight loss was similar in both genotypes after bariatric surgery, as our dietary study. Moreover, adiponectin levels have not been measured after weight loss in these three previous studies.
The first study that evaluates the effect of this polymorphism and weight loss on adiponectin levels was the one developed by Poitou et al.22 These authors reported that rs266729 variant did not have any significant effect on circulating adiponectin concentrations in 65 obese subjects undergoing gastric banding surgery after 12 months. However, lipid profile and glucose metabolism have not been measured in this study. De Luis et al.11 realized the other study that evaluate adiponectin levels. In this interventional study of three years with biliopancreatic diversion, adiponectin concentrations increased after weight loss in CC subjects, which was not observed in carriers of the G allele. Furthermore, a better improvement in lipid profile, insulin levels and HOMA-IR were also observed in CC genotype subjects than G-allele carriers.
The potential physiological mechanisms to explain the dependency of the weight loss effect between these genetic variant and metabolic parameters remain unknown. ADIPOQ encodes adiponectin expressed exclusively in both brown and white adipose tissues.23 Recent findings has indicated that G allele alters the sequence for one transcriptional stimulatory protein binding sites and secondarily reduces adiponectin promoter activity.3 In addition, some studies have demonstrated that there was an association between adiponectin and adipose tissue mass and suggested that adiponectin secretion and circulating levels were inversely proportional to body fat.24 Perhaps a molecular pathway relates this genetic variant of the ADIPOQ gene with adipogenesis and adipokine secretion. A second potential hypothesis to explain these associations is a gene-nutrient interaction. Fergusson et al.25 have demonstrate that G allele for this SNPs was identified as having degrees of insulin resistance, and was highly responsive to differences in plasma saturated fatty acids. In other study,26 a gene-nutrient interaction was reported between rs266729 variant of ADIPOQ gene and the percentage of energy derived from dietary fat in the diet. Perhaps, dietary fatty acids could modulate the involvement of the adiponectin gene and its receptors in downstream pathways. In our study with two different dietary fatty acids, we did not find any differences between both dietary profiles and perhaps weight loss is more relevant than the composition of the diet that produces this weight loss.
Limitations of our study included; the recruitment of our obese subjects without established diabetes mellitus or cardiovascular disease. Second, we only analyzed one SNP of ADIPOQ gene, so other ADIPOQ variants could be related with metabolic parameters. Third, there are many uncontrolled factors that could influence our results (epigenetic, hormonal status and level of physical activity). Finally, the self-reported dietary intake is not reliable and it might include bias of under- or over-reporting.
In conclusion, the CC genotype of ADIPOQ gene variant (rs266729) is associated with increases in adiponectin levels and decreases of LDL-cholesterol, glucose, insulin and HOMA-IR after weight loss. These results are independent of the dietary fatty acids profile of the diet and appreciate more related to the weight loss generated by both caloric restrictions
Authors’ contributionD.A. de Luis and R. Aller designed the study and realized statistical analysis.
O. Izaola anthropometric evaluation and control of dietary intake.
D. Primo realized biochemical evaluation and genotype.
Ethical approvalAll procedures performed in studies involving human participants were in accordance with the ethical standards of the institutional and/or national research committee and with the 1964 Helsinki declaration and its later amendments or comparable ethical standards. Informed consent: Informed consent was obtained from all individual participants included in the study.
FundingNo funding.
Conflict of interestThe authors declare no conflict of interest.
