


It is estimated that 37% of Mexican adults have undiagnosed diabetes, and are therefore at high risk of developing the severe and devastating complications associated to it. In recent years, a variety of screening tools based on the characteristics of the adult Mexican population have been proposed in order to reduce the negative effects of the disease.
ObjectivesTo assess the performance of screening models to diagnose diabetes in the Mexican adult population and to propose a screening model based on HbA1c measurements.
Materials and methodsData from the 2016 Halfway National Health and Nutrition Survey (NHNS) were used to assess the screening models and to develop and validate the proposed 2016 NHNS model, built using a multivariate logistic regression model. Explanatory variables included in the 2016 NHNS 2016 model were selected through a stepwise backward procedure, using sensitivity and specificity as performance indicators.
ResultsOf the screening models assessed, only the model based on the 2006 NHNS survey showed a performance consistent with previous reports. The proposed 2016 NHNS model included age, waist circumference, and systolic blood pressure as explanatory variables and showed a sensitivity of 0.72 and a specificity of 0.80 in the validation data set.
ConclusionsAge, waist circumference, and systolic blood pressure are variables of special importance for early detection of undiagnosed diabetes in Mexican adults. Based on the consistent performance of the 2006 NHNS model in different data sets, its use as a screening tool for adults with undiagnosed diabetes in Mexico is recommended.
Se estima que el 37% de adultos mexicanos que padecen diabetes no han sido diagnosticados, teniendo un alto riesgo de desarrollar las graves y devastadores complicaciones asociadas. En los últimos años, con el objetivo de reducir los efectos negativos de la enfermedad, se han propuesto herramientas de detección basadas en las características de la población adulta mexicana.
ObjetivosEvaluar el funcionamiento de los modelos de detección de diabetes no diagnosticada en la población adulta mexicana y proponer un modelo de detección basado en mediciones de HbA1c.
Material y métodosSe utilizaron datos de la Encuesta Nacional de Salud y Nutrición (NHNS) de Medio Camino 2016 para evaluar los modelos de detección y para desarrollar y validar el modelo NHNS 2016, construido usando un modelo de regresión logística multivariada. Las variables incluidas en el modelo NHNS 2016 se seleccionaron mediante un procedimiento de pasos hacia atrás, utilizando la sensibilidad y la especificidad como indicadores de funcionamiento.
ResultadosDe los modelos de detección evaluados, únicamente el modelo basado en la encuesta NHNS 2006 mostró un funcionamiento consistente con lo reportado anteriormente. Las variables seleccionadas para el modelo propuesto (NHNS 2016) fueron edad, circunferencia de cintura y presión sistólica como variables explicativas, mostrando una sensibilidad de 0,72 y una especificidad de 0,80 en el conjunto de datos de validación.
ConclusionesEdad, circunferencia de cintura y presión sistólica son variables de relevancia especial para la detección temprana de diabetes no diagnosticada en adultos mexicanos. Dada la consistencia en el funcionamiento mostrado por el modelo NHNS 2006 en diferentes conjuntos de datos, se recomienda su uso como herramienta de detección de adultos con diabetes no diagnosticada en México.
In 2017, the International Diabetes Federation (IDF) estimated that 50% of people with diabetes worldwide (>200 million) remain undiagnosed.1 Likewise, it is estimated that in Mexico, at least 37% of individuals with diabetes are unaware of their disease.1 These numbers are alarming given the fact that type 2 diabetes (T2D) can remain asymptomatic for several years before diagnosis,2 thus increasing the risk of developing the associated complications.3 For this reason, the American Diabetes Association4 recommends the use of screening or risk assessment tools in asymptomatic adults for the opportune detection and treatment of those subjects with or at high risk of developing T2D. In this regard, screening models have been developed within specific populations or regions, taking into account the possible effect of ethnic, racial, cultural or/and environmental differences on the risk of T2D (reviewed in5–7).
In Mexico, one of the countries with a highest number of people with diabetes (according to the 2017 IDF Diabetes Atlas1), a variety of screening models for undiagnosed diabetes have been proposed in the last years, aiming to provide low cost and simple-to-use tools to identify the population with undiagnosed diabetes or at high risk of developing the disease. Rojas-Martínez et al.8 evaluated waist circumference cutoff values as potential explanatory variable to identify Mexican adults with undiagnosed diabetes. Although this approach was capable of correctly identifying ∼85% of subjects with diabetes when tested in a validation dataset, it also yielded a high percentage of false positives (∼80%). In a later study, Rojas-Martínez et al.9 used data from a cohort of Mexican adults obtained in the Instituto Nacional de Ciencias Médicas y Nutrición Salvador Zubirán (INCMNSZ) (National Institute of Medical Sciences and Nutrition), to design a model that identified correctly 53.9 and 41.7% of Mexican adult males and females with undiagnosed diabetes, respectively, in an external validation dataset, with only 32.5 and 15.1% of false positives. On the other hand, in a previous report, we proposed two models based on the NHNS 2006 and 2012 surveys10 that correctly identifyed ∼74 and 76% of Mexican adults with undiagnosed diabetes in an external validation dataset, with 38 and 45% of false positives, respectively. Finally, there is also a risk score distributed and implemented by the Mexican Secretariat of Health11 which, to our knowledge, has been neither developed nor validated using data from Mexican adults.
The main objective of this work is to evaluate these models using recent data from the halfway National Health and Nutrition Survey (NHNS) 201612 in order to assess how they perform in external validation scenarios. In addition, using the same NHNS 2016 dataset, we propose a new screening model for undiagnosed diabetes in the Mexican adult population based on glycated hemoglobin (HbA1c) measurements.
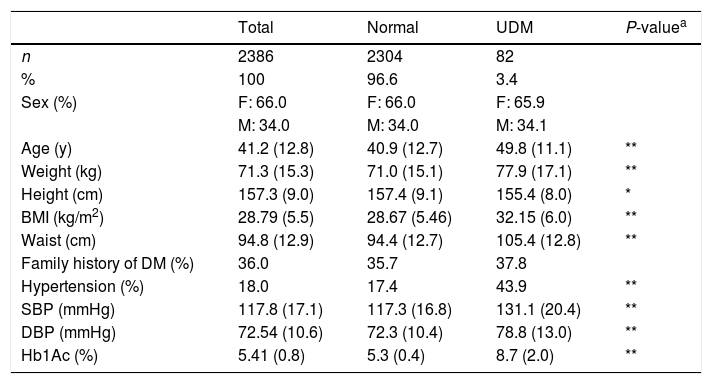
Material and methodsDataset: National Health and Nutrition Survey 2016 (NHNS 2016)Data from Mexican adults interviewed in the context of the halfway National Health and Nutrition Survey 2016 (NHNS 2016)12 was used to evaluate the screening models as well as to develop the NHNS 2016 model. The NHNS 2016 survey was implemented nationwide in Mexico to assess the general state of health and nutrition of the Mexican population with a particular interest in aspects related to the prevention and control of obesity and diabetes.12 Household interviews were conducted in which individuals were asked about several subjects related to chronic diseases, physical activity, diet diversity, quality of care for patients, among others.12 In addition, anthropometric measurements and blood samples were taken to determine the evolution of obesity, hypertension and diabetes.12,13 Methodological details of the halfway NHNS 2016 survey can be found in Ref.13 From the 9406 Mexican adults interviewed for the NHNS 2016 survey, we selected the subsample from which blood samples were taken and all the variables listed in Table 1 were available. Neither subjects with a previous diagnosis of diabetes nor those with missing information were included in the final dataset used for the evaluation, development, optimization or validation of the screening models. The resulting dataset was therefore composed of 2386 observations (whose characteristics are summarized in Table 1). The fact that the NHNS 2016 dataset includes HbA1c measurements, in addition to all the relevant variables used by all the models evaluated, constitutes an important advantage since HbA1c measurements are a better indicator of glycemic exposure and risk for long-term complications.14 Moreover, HbA1c assays have important advantages when compared to measurements of the fasting plasma glucose or the oral glucose tolerance test, such as less day-to-day or intraindividual variability, less preanalytic instability and the fact that fasting is not required for HbA1c tests.1,14 For this reason, undiagnosed diabetes was determined in the NHNS 2016 dataset adopting the criteria established by the American Diabetes Association,4 according to which a measurement of glycated hemoglobin (HbA1c)≥6.5% indicate the presence of the disease. As a result, only 82 of the 2386 observations contained in the NHNS 2016 dataset used in this work (∼3.4%) were classified as having undiagnosed diabetes. Important differences between the subjects with undiagnosed diabetes and those considered as normal were observed in most of the variables listed in Table 1.
Characteristics of the NHNS 2016 dataset used in this work. Continuous variables are presented as means (SD) and categorical variables are presented as number of observations and percentages.
| Total | Normal | UDM | P-valuea | |
|---|---|---|---|---|
| n | 2386 | 2304 | 82 | |
| % | 100 | 96.6 | 3.4 | |
| Sex (%) | F: 66.0 | F: 66.0 | F: 65.9 | |
| M: 34.0 | M: 34.0 | M: 34.1 | ||
| Age (y) | 41.2 (12.8) | 40.9 (12.7) | 49.8 (11.1) | ** |
| Weight (kg) | 71.3 (15.3) | 71.0 (15.1) | 77.9 (17.1) | ** |
| Height (cm) | 157.3 (9.0) | 157.4 (9.1) | 155.4 (8.0) | * |
| BMI (kg/m2) | 28.79 (5.5) | 28.67 (5.46) | 32.15 (6.0) | ** |
| Waist (cm) | 94.8 (12.9) | 94.4 (12.7) | 105.4 (12.8) | ** |
| Family history of DM (%) | 36.0 | 35.7 | 37.8 | |
| Hypertension (%) | 18.0 | 17.4 | 43.9 | ** |
| SBP (mmHg) | 117.8 (17.1) | 117.3 (16.8) | 131.1 (20.4) | ** |
| DBP (mmHg) | 72.54 (10.6) | 72.3 (10.4) | 78.8 (13.0) | ** |
| Hb1Ac (%) | 5.41 (0.8) | 5.3 (0.4) | 8.7 (2.0) | ** |
Statistical significances between normal and UDM groups were assessed using the Student's t-test for the interval/ratio variables (Age, Weight, Height, BMI, Waist, SBP, DBP and Hb1Ac) and the χ2-test for the categorical variables (Sex, Family history of DM and Hypertension). A P-value<0.05 was considered to be statistically significant (*P<0.05, **P<0.001).
Screening models for undiagnosed diabetes developed specifically for the Mexican adult population were evaluated using the NHNS 2016 dataset described in the last section. In the following, the five models evaluated are briefly described (see also Appendix A). Performance of the models was determined by their capability to correctly identify subjects with undiagnosed diabetes while yielding the lowest number of false positives. Sensitivity (i.e. the proportion or percentage of people with undiagnosed diabetes correctly identified by the models) and specificity (i.e. the proportion or percentage of healthy people correctly identified by the models) were used to compare the models performance.
Waist circumference modelThe first effort to detect adults with undiagnosed diabetes in Mexico using minimal and simple obtainable explanatory variables was made by Rojas et al.,8 who evaluated the use of cutoff values for abdominal obesity (i.e. waist circumference) as indicators of undiagnosed diabetes using data from the NHNS 2006 survey. The authors evaluated the waist circumference cutoff values proposed, on the one hand, by the American Heart Association and the National Heart, Lung and Blood Institute (AHA/NHLBI, ≥102 for males and ≥82 for females),15 and on the other, by the International Diabetes Federation (IDF, ≥90 for males and ≥80 for females).16 In short, according to this model, a subject was classified as at high risk of having undiagnosed diabetes if her or his waist circumference measurement was above either of the two cutoff values evaluated. This approach was capable of identifying correctly ∼85% of subjects with diabetes, although at the expense of an extremely high percentage (∼80%) of false positives.
Mexican Secretariat of Health (SSA) risk scoreA simple risk score distributed by the Mexican Secretariat of Health (SSA)11 was also evaluated in this work. Surprisingly, there is no information about how it was developed or validated, or how it has performed as a tool to identify Mexican subjects with undiagnosed diabetes. According to Rojas-Martínez et al.,9 the SSA score is based on a score developed by the American Diabetes Association17 and has not been validated for the Mexican population. The explanatory variables used in the SSA risk score are body mass index, waist circumference, physical activity, age, family history of diabetes and birth weight as an indicator of possible gestational diabetes in the female population. The SSA risk score is reproduced in Appendix A.1.
INCMNSZ risk scoreRecently, Rojas-Martínez et al.9 developed a risk score for detecting prediabetes and undiagnosed diabetes in Mexican adults. The risk score is based on data from a cohort of Mexican adults obtained in the Instituto Nacional de Ciencias Médicas y Nutrición Salvador Suvirán (INCMNSZ) and was developed using multiple logistic regression. Explanatory variables considered in the INCMNSZ risk score were age, family history of diabetes, waist circumference, body mass index, hypertension status and physical activity. External validation was performed using a dataset from the National Health and Nutrition Survey 2012.18 As a result, they proposed two different scores for the male and female populations (described in detail in Appendix A.2) and reported a sensitivity and specificity in the external validation dataset of 53.9 and 67.5% for the female population, and 53.2 and 69.1% for the male population, respectively.
NHNS 2006 and 2012 modelsIn a previous study,10 we developed two screening models for undiagnosed diabetes based on data from two National Health and Nutrition Surveys carried out in Mexico in 2006 and 2012.18,19 The models were developed using multiple logistic regression with a minimal set of explanatory variables determined by a stepwise backward procedure (see Appendix A.3). The explanatory variables used in the NHNS 2006 model were age, waist circumference and systolic blood pressure, while in the NHNS 2012 model the explanatory variables used were age, waist circumference, height and family history of diabetes. The models proposed achieved a sensitivity and specificity of 74 and 62% for the NHNS 2006 model and 76% and 55% for the NHNS 2012 model in an external validation dataset obtained from the National Health Survey performed in 2000.20
New screening model for undiagnosed diabetes in Mexican adults based on HbA1c measurementsIn addition to evaluating the models described above, a new screening model for undiagnosed diabetes in Mexican adults was developed using data from the halfway National Health and Nutrition Survey 2016.12 The methodology followed to develop the NHNS 2016 model was similar to that used in a previous work for the development of the NHNS 2006 and 2012 models 10 and consisted in deriving a multivariate logistic regression model to calculate the probability P of having undiagnosed diabetes (UDM) based on selected explanatory variables Xi as:
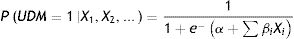
Once the probability is calculated, each observation from the dataset is classified as healthy or at high risk of having undiagnosed diabetes according to a probability cutoff value determined through an optimization procedure using a separate optimization dataset.
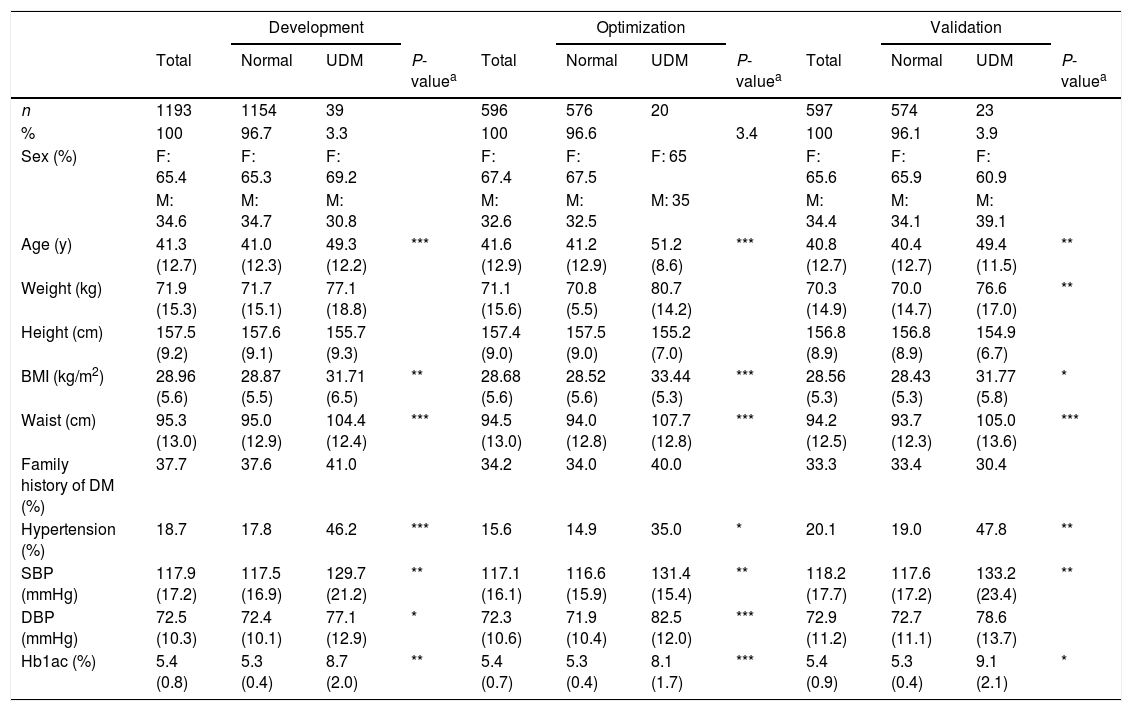
The dataset used to derive the NHNS 2016 model (described in Section 2.1) was divided in development (n=1193), optimization (n=596) and validation (n=597) datasets comprising 50, 25 and 25% of the complete NHNS 2016 dataset (n=2386), respectively. The characteristics of the resulting datasets are presented in Table 2, where it can be seen that, in general, the differences between normal observations and those classified as having undiagnosed diabetes are also present in most of the variables listed, as observed in Table 1 for the complete NHNS 2016 dataset.
Characteristics of the development, optimization and validation datasets (NHNS 2016). Continuous variables are presented as means (SD) and categorical variables are presented as number of observations and percentages.
| Development | Optimization | Validation | ||||||||||
|---|---|---|---|---|---|---|---|---|---|---|---|---|
| Total | Normal | UDM | P-valuea | Total | Normal | UDM | P-valuea | Total | Normal | UDM | P-valuea | |
| n | 1193 | 1154 | 39 | 596 | 576 | 20 | 597 | 574 | 23 | |||
| % | 100 | 96.7 | 3.3 | 100 | 96.6 | 3.4 | 100 | 96.1 | 3.9 | |||
| Sex (%) | F: 65.4 | F: 65.3 | F: 69.2 | F: 67.4 | F: 67.5 | F: 65 | F: 65.6 | F: 65.9 | F: 60.9 | |||
| M: 34.6 | M: 34.7 | M: 30.8 | M: 32.6 | M: 32.5 | M: 35 | M: 34.4 | M: 34.1 | M: 39.1 | ||||
| Age (y) | 41.3 (12.7) | 41.0 (12.3) | 49.3 (12.2) | *** | 41.6 (12.9) | 41.2 (12.9) | 51.2 (8.6) | *** | 40.8 (12.7) | 40.4 (12.7) | 49.4 (11.5) | ** |
| Weight (kg) | 71.9 (15.3) | 71.7 (15.1) | 77.1 (18.8) | 71.1 (15.6) | 70.8 (5.5) | 80.7 (14.2) | 70.3 (14.9) | 70.0 (14.7) | 76.6 (17.0) | ** | ||
| Height (cm) | 157.5 (9.2) | 157.6 (9.1) | 155.7 (9.3) | 157.4 (9.0) | 157.5 (9.0) | 155.2 (7.0) | 156.8 (8.9) | 156.8 (8.9) | 154.9 (6.7) | |||
| BMI (kg/m2) | 28.96 (5.6) | 28.87 (5.5) | 31.71 (6.5) | ** | 28.68 (5.6) | 28.52 (5.6) | 33.44 (5.3) | *** | 28.56 (5.3) | 28.43 (5.3) | 31.77 (5.8) | * |
| Waist (cm) | 95.3 (13.0) | 95.0 (12.9) | 104.4 (12.4) | *** | 94.5 (13.0) | 94.0 (12.8) | 107.7 (12.8) | *** | 94.2 (12.5) | 93.7 (12.3) | 105.0 (13.6) | *** |
| Family history of DM (%) | 37.7 | 37.6 | 41.0 | 34.2 | 34.0 | 40.0 | 33.3 | 33.4 | 30.4 | |||
| Hypertension (%) | 18.7 | 17.8 | 46.2 | *** | 15.6 | 14.9 | 35.0 | * | 20.1 | 19.0 | 47.8 | ** |
| SBP (mmHg) | 117.9 (17.2) | 117.5 (16.9) | 129.7 (21.2) | ** | 117.1 (16.1) | 116.6 (15.9) | 131.4 (15.4) | ** | 118.2 (17.7) | 117.6 (17.2) | 133.2 (23.4) | ** |
| DBP (mmHg) | 72.5 (10.3) | 72.4 (10.1) | 77.1 (12.9) | * | 72.3 (10.6) | 71.9 (10.4) | 82.5 (12.0) | *** | 72.9 (11.2) | 72.7 (11.1) | 78.6 (13.7) | |
| Hb1ac (%) | 5.4 (0.8) | 5.3 (0.4) | 8.7 (2.0) | ** | 5.4 (0.7) | 5.3 (0.4) | 8.1 (1.7) | *** | 5.4 (0.9) | 5.3 (0.4) | 9.1 (2.1) | * |
Statistical significances between normal and UDM groups were assessed using the Student's t-test for the interval/ratio variables (Age, Weight, Height, BMI, Waist, SBP, DBP and Hb1Ac) and the χ2-test for the categorical variables (Sex, Family history of DM and Hypertension). A P-value<0.05 was considered to be statistically significant (*P<0.05, **P<0.01, ***P<0.001).
Explanatory variables used in the final NHNS 2016 model were determined from the development dataset by a stepwise backward procedure based in the Akaike Information Criterion (AIC) using 10-fold crossvalidation repeated five times. Sex, age, weight, height, waist circumference, family history of diabetes, hypertension status and systolic and diastolic blood pressure were initially evaluated as potential explanatory variables. In this procedure, a model containing all these explanatory variables is iteratively fitted, removing variables from the model in order to choose only those variables that contribute significantly to the model according to the AIC, calculated at each iteration. Afterwards, an optimization procedure was performed using the resulting model in order to determine the optimal probability cutoff value that maximize both the sensitivity and specificity in the optimization dataset. Finally, the performance of the final model, composed of the selected explanatory variables and the optimized cutoff probability value, was evaluated in the validation dataset in terms of the sensitivity, specificity and area under the receiver operation characteristic (ROC) curve (AUC).
Computational detailsR 3.5.121 was used for the evaluation, development and validation of the screening models. Fit and validation of the models were performed using the Caret package.22 The area under the ROC curves and optimal probability cutoff values were calculated using the ROCR package.23
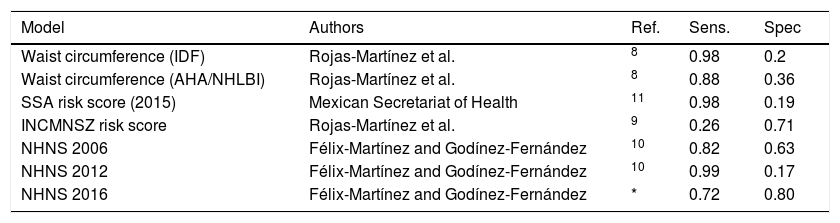
Results and discussionEvaluation of screening models for undiagnosed diabetes in Mexican adultsModels described above were evaluated using the NHNS 2016 dataset. The main objective was to determine which model behaves the best in terms of its capability of correctly identifying the 82 subjects with undiagnosed diabetes while yielding the lowest number of false positives (i.e. high sensitivity and specificity). Performance parameters of all the models evaluated are shown in Table 3. Most of the models, including the waist circumference models (IDF and AHA/NHLBI), the NHNS 2012 model and the SSA risk score, showed a high sensitivity (between 0.88 and 0.99), although also showing a very low specificity, in the range of 0.17–0.36. This means that practically all the subjects with undiagnosed diabetes were identified correctly, with the drawback that around 75–80% of normal subjects would be incorrectly classified as at high risk of having the disease. The opposite scenario occurred with the INCMNSZ score risk,9 which was only capable of identifying 17% of adults with undiagnosed diabetes, while classifying correctly more than 70% of normal or healthy subjects.
Comparison between screening models for undiagnosed diabetes in Mexican adults.
| Model | Authors | Ref. | Sens. | Spec |
|---|---|---|---|---|
| Waist circumference (IDF) | Rojas-Martínez et al. | 8 | 0.98 | 0.2 |
| Waist circumference (AHA/NHLBI) | Rojas-Martínez et al. | 8 | 0.88 | 0.36 |
| SSA risk score (2015) | Mexican Secretariat of Health | 11 | 0.98 | 0.19 |
| INCMNSZ risk score | Rojas-Martínez et al. | 9 | 0.26 | 0.71 |
| NHNS 2006 | Félix-Martínez and Godínez-Fernández | 10 | 0.82 | 0.63 |
| NHNS 2012 | Félix-Martínez and Godínez-Fernández | 10 | 0.99 | 0.17 |
| NHNS 2016 | Félix-Martínez and Godínez-Fernández | * | 0.72 | 0.80 |
Imagining a scenario where these models were used as a an initial step of a stepwise program for the early detection of subjects at high risk of having undiagnosed diabetes, in which those subjects detected by the screening model as at high risk of having the disease would be further evaluated by blood test analyses and/or by a specialist physician, a model with a high number of false positives would increase considerably the cost of detection of those who do have undiagnosed diabetes. This is no worse than the opposite scenario in which a screening model yields a high number of false negatives, implying that people with undiagnosed diabetes would remain undetected, which would put them at risk of developing the devastating long-term complications of diabetes, with the economic consequences associated for the patients, their families and the health system as a whole.
The only model that showed consistent balanced results was the NHNS 2006 model.10 As it can be seen in Table 3, the NHNS 2006 model showed a high sensitivity of 0.82 and a specificity of 0.63. These numbers resemble those obtained by the NHNS 2006 model in the optimization and validation datasets, where the model showed a sensitivity and specificity of 0.74 and 0.62, respectively (see the original work in Ref.10). In contrast to the other models evaluated, the NHNS 2006 model was the only model that showed a consistent performance in the development (NHNS 2006), validation (NHS 2000) and external datasets (NHNS 2016).
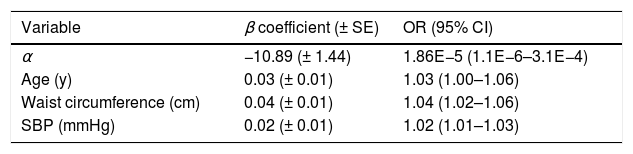
NHNS 2016 modelFrom the stepwise backward procedure in the development dataset (n=1193, see Table 2), only age, waist circumference and systolic blood pressure were considered in the final NHNS 2016 model. Model parameters α and βi, as well as the corresponding odds ratios are shown in Table 4. According to the β coefficients, an increase of one unit in age (in years), waist circumference (in centimeters) and systolic blood pressure (in mmHg) increases the odds of having undiagnosed diabetes by 3, 4 and 2%, respectively. Interestingly, explanatory variables selected by the stepwise backward procedure in the NHNS 2016 model are exactly the same than those selected through the same procedure for the NHNS 2006 model which, as mentioned in the previous section, was the only model that showed a stable performance when evaluated in different datasets.
Explanatory variables included in the NHNS 2016 model, odds ratios and model parameters α, β used in Eq. (1) to calculate the probability of having undiagnosed diabetes.
| Variable | β coefficient (± SE) | OR (95% CI) |
|---|---|---|
| α | −10.89 (± 1.44) | 1.86E−5 (1.1E−6–3.1E−4) |
| Age (y) | 0.03 (± 0.01) | 1.03 (1.00–1.06) |
| Waist circumference (cm) | 0.04 (± 0.01) | 1.04 (1.02–1.06) |
| SBP (mmHg) | 0.02 (± 0.01) | 1.02 (1.01–1.03) |
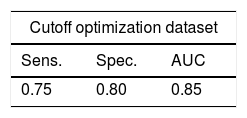
The performance of the NHNS 2016 model in the optimization and validation datasets (see Table 2) is summarized in Table 5. The NHNS 2016 model performed similarly in the optimization and validation datasets (using the cutoff probability value of 0.042), achieving a sensitivity of 0.75 and 0.72, respectively, and a specificity of 0.80 in both cases. These numbers translate to an AUC of 0.85 and 0.82 in the optimization and validation datasets, respectively. In practice, these numbers mean that the NHNS 2016 model correctly identified about 80% of Mexican adults with undiagnosed diabetes in the NHNS 2016 dataset, with only between 18 to 15% of false positives. In comparison to the NHNS 2006 model, which achieved specificity values of 61–63% (in the optimization and external validation datasets), the NHNS 2016 model was better at identifying healthy subjects, as indicated by its greater specificity (between 82 and 85%). Regarding the sensitivity, both models showed similar values (0.72–0.75 for the NHNS 2016 model and 0.74–0.75 for the NHNS 2006 model). The main difference between these two models is therefore that the NHNS 2016 showed a higher specificity, which may be reflecting the fact that HbA1c measurements were used in the NHNS 2016 dataset to determine which observations were classified as having undiagnosed diabetes, in contrast to the NHNS 2006 model in which measurements of fasting plasma glucose were used. In spite of these optimistic results, external validation of the NHNS 2016 model must be performed in order to determine if it shows a stable and balanced performance in different datasets.
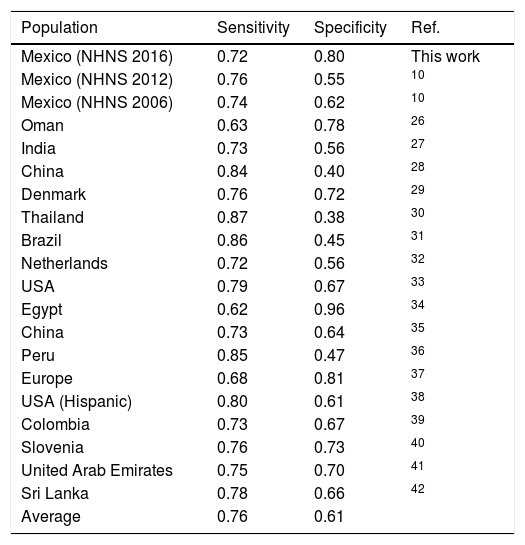
A comparison between the performance of the NHNS 2016 model and other models developed for other countries and/or populations is shown in Table 6. In terms of the capability of the models to correctly identify subjects with undiagnosed diabetes (i.e. sensitivity), the NHNS 2016 model showed a slightly lower value (0.72) with respect to the mean of the models included in Table 6 (0.76), although also showing a considerably higher specificity (0.80) if compared to the average value of the specificity achieved by the other models (0.61). In general, as can be seen in Table 6, the models developed for the Mexican adult population perform within the range of the models developed for other countries or populations. It is worth noting that the NHNS 2006, 2012 and 2016 models were designed as screening tools for undiagnosed diabetes, thus leaving aside the possibility of identifying those subjects with prediabetes. This is an important aspect to consider in future models given the fact that the prevalence of prediabetes in the Mexican adult population is also high, as indicated by a study performed by Kumar et al.,24 who calculated a prevalence of prediabetes of 44.2% from a subsample of the 2012 Mexican Health and Aging Study, in which Mexican adults older than 50 years of age were surveyed in both rural and urban areas of Mexico to study the aging process and its impact on their health state.25
Comparison between the NHNS 2016 model and similar models developed for other countries, regions or populations.
| Population | Sensitivity | Specificity | Ref. |
|---|---|---|---|
| Mexico (NHNS 2016) | 0.72 | 0.80 | This work |
| Mexico (NHNS 2012) | 0.76 | 0.55 | 10 |
| Mexico (NHNS 2006) | 0.74 | 0.62 | 10 |
| Oman | 0.63 | 0.78 | 26 |
| India | 0.73 | 0.56 | 27 |
| China | 0.84 | 0.40 | 28 |
| Denmark | 0.76 | 0.72 | 29 |
| Thailand | 0.87 | 0.38 | 30 |
| Brazil | 0.86 | 0.45 | 31 |
| Netherlands | 0.72 | 0.56 | 32 |
| USA | 0.79 | 0.67 | 33 |
| Egypt | 0.62 | 0.96 | 34 |
| China | 0.73 | 0.64 | 35 |
| Peru | 0.85 | 0.47 | 36 |
| Europe | 0.68 | 0.81 | 37 |
| USA (Hispanic) | 0.80 | 0.61 | 38 |
| Colombia | 0.73 | 0.67 | 39 |
| Slovenia | 0.76 | 0.73 | 40 |
| United Arab Emirates | 0.75 | 0.70 | 41 |
| Sri Lanka | 0.78 | 0.66 | 42 |
| Average | 0.76 | 0.61 |
Screening models for undiagnosed diabetes in Mexican adults were evaluated using data from the Mexican halfway National Health and Nutrition Survey 2016. According to our results, the NHNS 2006 model was the only model that showed similar performance indicators than those reported previously in the optimization and external validation datasets,10 as indicated by its capability of identifying correctly 82% of subjects with undiagnosed diabetes with a reasonable percentage of false positives of 37%.
A new screening model for undiagnosed diabetes in the Mexican adult population, derived using recent data from the NHNS 2016 survey, was also proposed. As the NHNS 2006 model, the NHNS 2016 model considered age, waist circumference and systolic blood pressure as explanatory variables and correctly identified 72% of subjects with undiagnosed diabetes with a low percentage of false positives of 20%. The fact that the stepwise backward procedure in both the NHNS 2006 and 2016 models yielded the same explanatory variables to determine the probability of having the disease, allow us to conclude that age, waist circumference and systolic blood pressure are of special importance for the early detection of Mexican adults with undiagnosed diabetes. According to our results, the use of HbA1c measurements to classify subjects as normal or as having undiagnosed diabetes for the development of the NHNS 2016 model contributed to achieve a higher specificity (0.8), in comparison to the NHNS 2006 and 2012 models, in which subjects were classified as normal or with undiagnosed diabetes based on measurements of the fasting plasma glucose. In spite of this, classification using HbA1c for the development of the NHNS 2016 model did not lead to an improvement of the sensitivity achieved by our previous models (NHNS 2006 and 201210).
Despite the fact that the NHNS 2016 model showed a better performance than the NHNS 2006 model (when evaluated in the NHNS 2016 dataset), the NHNS 2016 model must be tested in different datasets in order to confirm the results here presented. For this reason, in accordance with the results of the comparative analysis performed in this work, the use of the NHNS 2006 screening model is recommended for the detection of Mexican adults with undiagnosed diabetes.
Conflict of interestsThe authors declare no conflict of interest.
G.J. Félix-Martínez (CVU 302514) acknowledges CONACYT (National Council of Science and Technology, México) for the support given to this project.
The following are the supplementary data to this article:
