


In every healthcare center a huge amount of data are generated, usually computed-recorded data through different coexisting applications. Any data hosted in the hospital information system (HIS) can be extracted, processed and related to each hospitalized patient, either demographic data, a vital sign as the cardiac frequency or temperature, a laboratory value, a medical treatment (for instance antimicrobial therapy), the presence of multi-resistant bacteria and the need of isolation, or different scales of severity or complexity (NEWS, Barthel, EVA, etc.) and it's possible to create different access profiles for the different healthcare professionals (doctors, nurses) and also for administration or facility staff. The cost of its process could be very high if there are no specific objectives addressed to management decisions.
Therefore, any management support tool must be efficient, effective, friendly and easy to use for the professionals, and would allow as well an easy interaction with the hospital information system (HIS).1
COVID-19 pandemic challenge has accelerated multilevel organizational changes (clinical, infrastructures, human resource management); also in information management. Health information systems have experienced an outstanding leap forward in a record time, creating and adapting different tools for data management, monitoring apps, or dashboards in real time; digital transformation to create value has definitely consolidated. Business Intelligence (BI) strategies have been stressed once more. Thus, the need of obtaining and treating the minimum set of necessary data in the shortest lapse of time, in order to be able to provide essential information for the pandemic management has been overwhelming. These strategies combined with the use of advanced Visual Analytics techniques, have allowed to capture all the relevant information in an advanced visual information system, with an additional agile interaction for a better informed decision making in near-real time.
COVID-19 pandemic has also required a greater temporal criticality. So that, further advances in Business Intelligence techniques and strategies has enabled a display evolution, providing real time information about the viral status for admitted patients in any area of the hospital.
Our work focuses on reuse of a large part of these data, automatically recovered and shared at the same time with professionals. The format for data representation is a visualization at a glance, that reflects the information related to a real map of beds that generates an added value of those data. We have an over ten years data repository, and in recent years we have incorporated specific data warehousing techniques and strategies for accessing data in near real time and optimize Visual Analytics. The purpose was to identify the more relevant data, determine where and how to obtain it, and get the necessary tools and resources for its treatment and dissemination. In this way, value is created for all interested and authorized professionals.
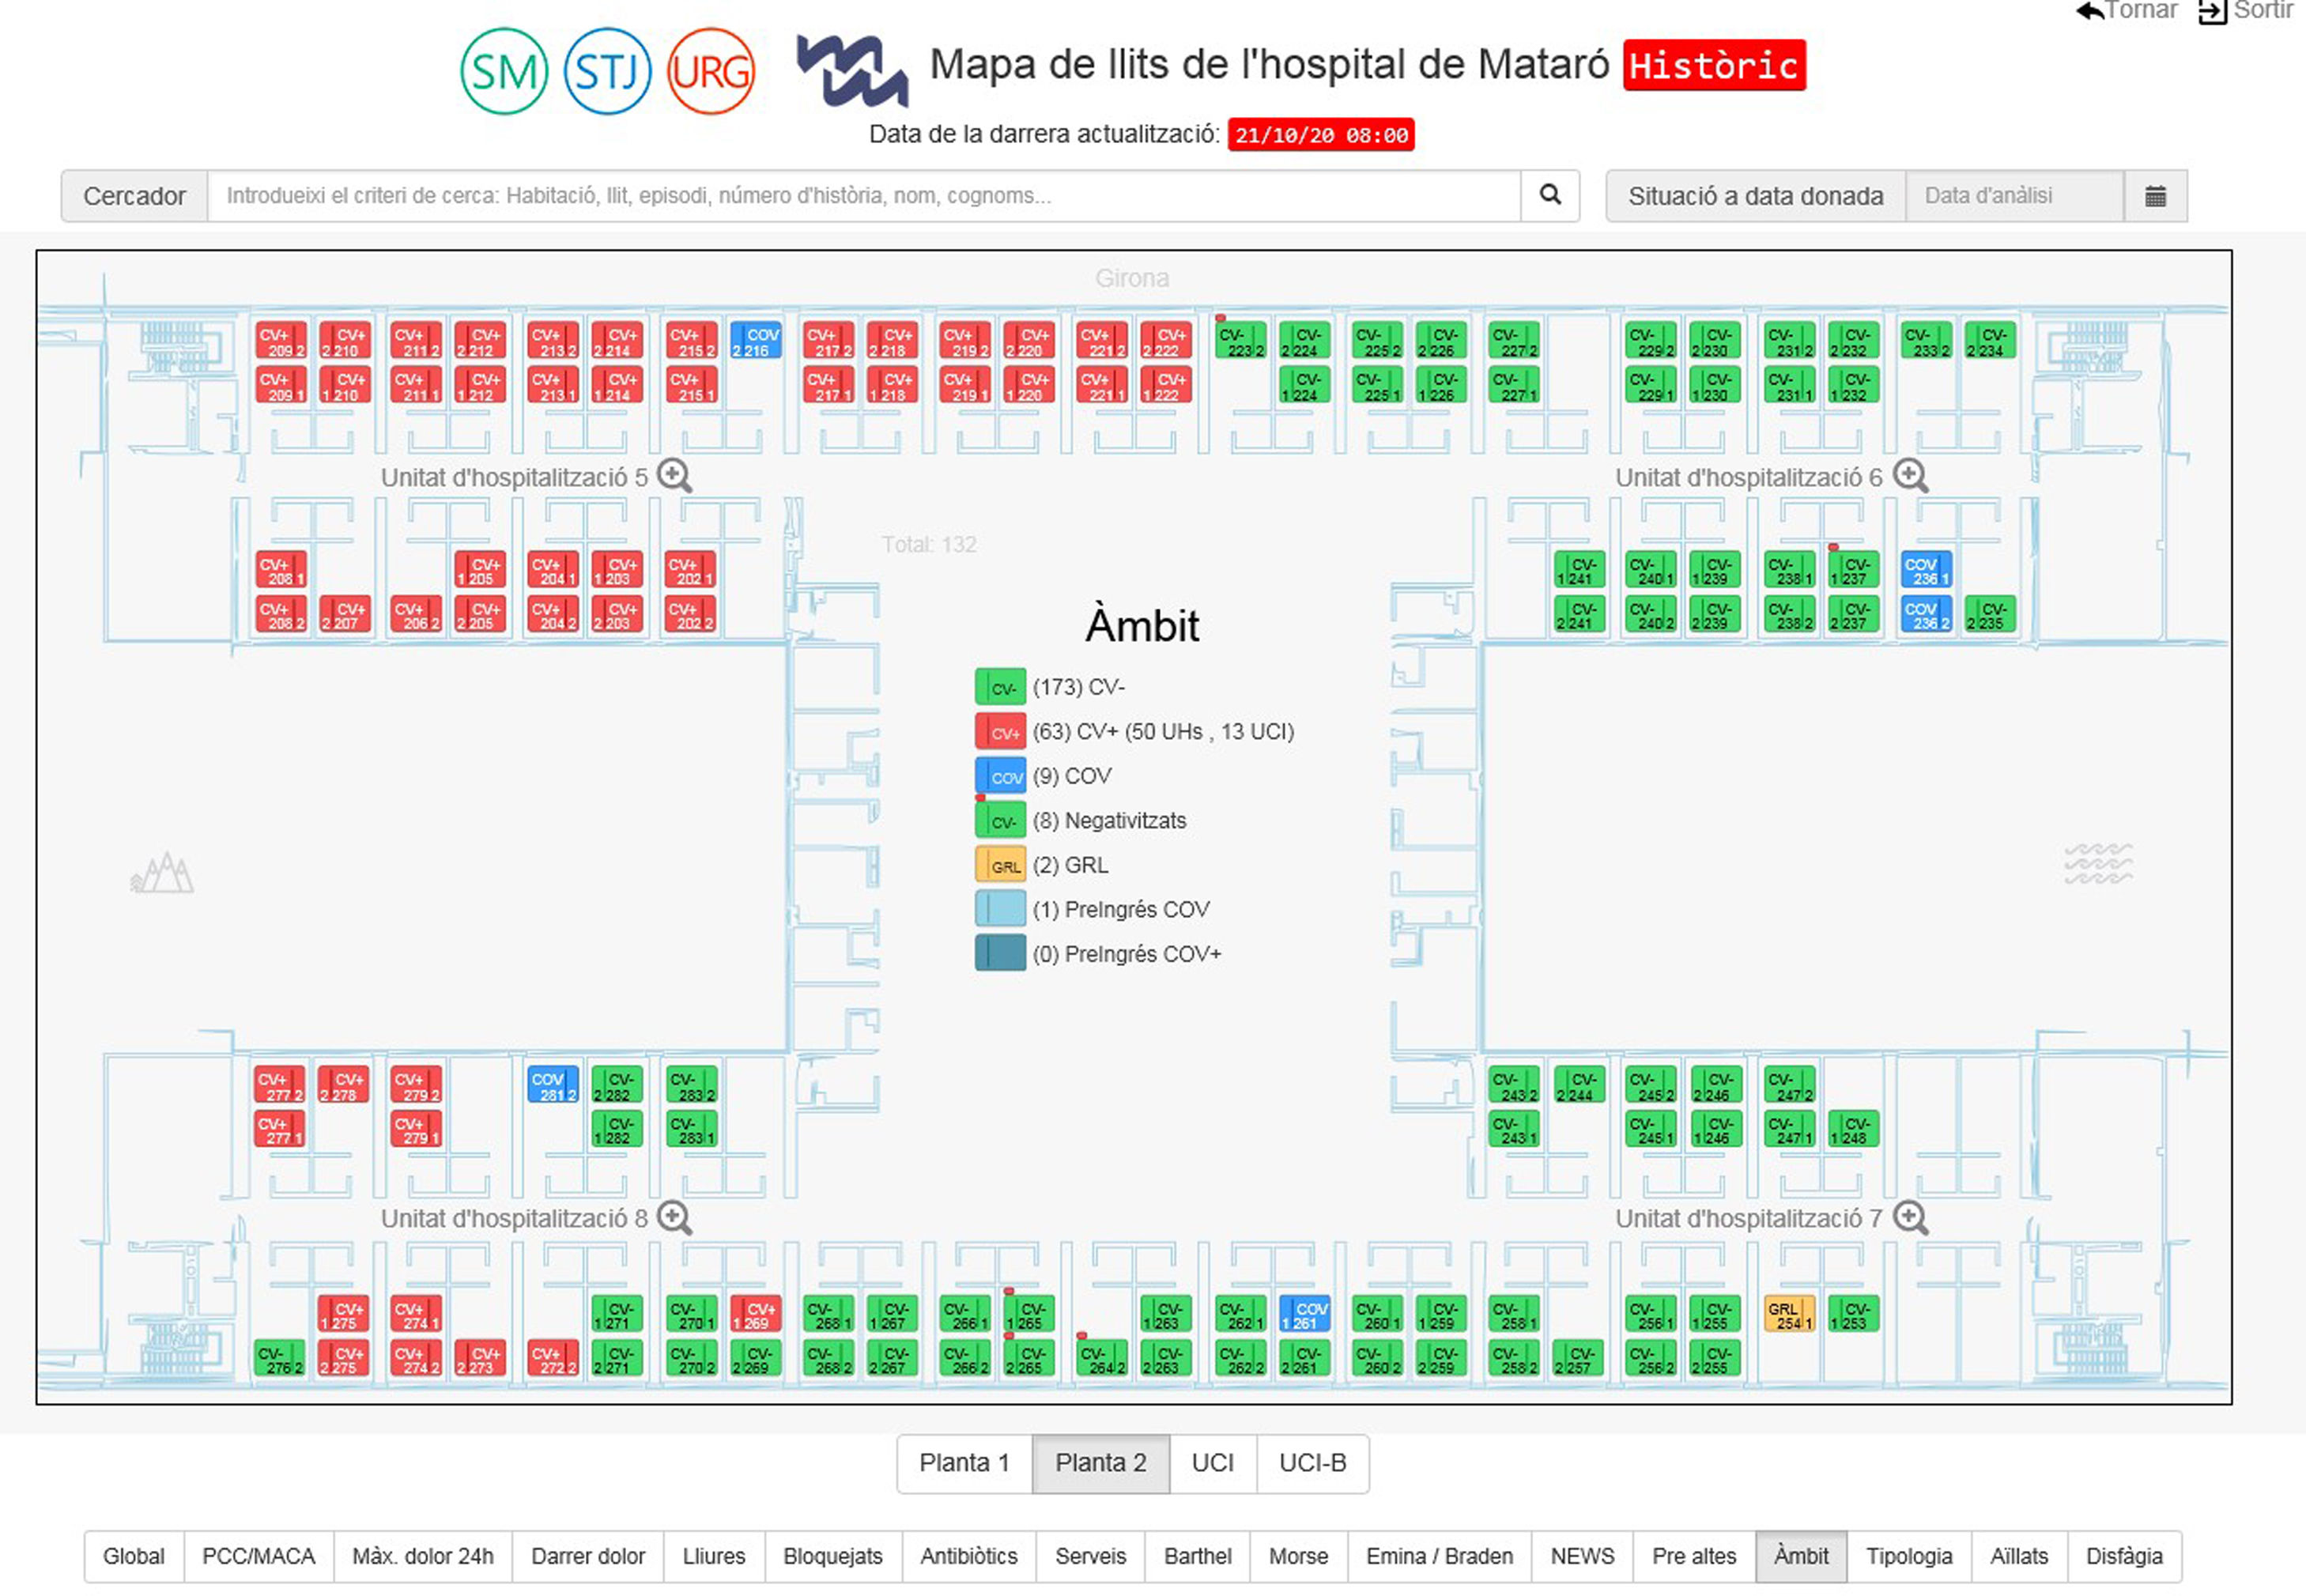
The starting point of the beds map has been just the structural information of each bed of all hospitalization units, each one identified to their corresponding floor or building through the building plans and symbols that enables the user to be oriented (Fig. 1).

Nowadays, a reduced group of professionals really has been reused only a small amount of data, usually for statistical and research purposes or government requirements. So, there is still a long way to run especially in the clinical management and care processes.
Decisions are needed in real time. Therefore, clinicians are able to turn data in clinical decisions with this tool; data become useful. Changing and challenging clinical situations need to be detected quickly and accurately; anticipation will prevent adverse events.
This tool also enables a link to cost analysis, which in turn can detect early unjustifiable deviations in spending, for instance in antibiotic use.2
Specially in the COVID-19 pandemic, the bed map as a decision support tool has been determinant to be more efficient in bed management, easily and successfully, and became essential for clinicians, nurses and managers.3
We cannot yet provide objective and definitive results of bed map implementation; this will be the reason for future papers, but we have a preliminary analysis about the increasing use of the tool as the pandemic evolved.
We are developing more prospective analysis about its adequacy. However, the real improvement in bed management perceived by clinicians, nurses and managers encourage us to continue the tool development to make easier and quicker the decision processes.
In conclusion, we must valorize the development of our bed map as a decision support tool, specially in the COVID-19 pandemic which has been extremely useful and decisive in a fast and effective way for the daily management of hospital beds and the ICU department.
Moreover, we continue with the operational deployment of the tool in other areas such as control of nosocomial infection and antimicrobial therapy, different clinical scales of complexity or the early detection of vital risk.
Our aim is to support professionals of health in their daily work to achieve a true value-based healthcare.
Authors’ contributionsJosep-Maria Ibáñez-Romaguera is the Corresponding Author. All authors contributed to the study conception and design. Data collection and analysis was performed by Ángel Lavado-Cuevas supported by Juan Camacho-del Valle and supervised by Jordi Valls-Soler. The first drafts of the manuscript and the final edition have been written by Josep-Maria Ibáñez-Romaguera and all authors have contributed with their comments. All authors read and approved the final manuscript.
FundingThis research has not received any specific aid from public sector agencies, commercial sector or non-profit entities.
Conflict of interestNone.
