


Background. Although several prognostic models have been proposed for cirrhotic patients listed for transplantation, the performance of these scores as predictors of mortality in patients admitted for acute decompensation of cirrhosis has not been satisfactorily investigated.
Aims. To study MELD, MELD-Na, MESO, iMELD, Refit-MELD and Refit MELD-Na models as prognostic predictors in cirrhotic patients admitted for acute decompensation, and to compare their performance between admission and 48 hours of hospitalization to predict in-hospital mortality.
Material and methods. This cohort study included cirrhotic patients admitted to hospital due to complications of the disease. Individuals were evaluated on admission and after 48 h of hospitalization, and mortality was evaluated during the present admission.
Results. One hundred and twenty-three subjects with a mean age of 54.26 ± 10.79 years were included; 76.4% were male. Mean MELD score was 16.43 ± 7.08 and 52.0% of patients were Child-Pugh C. Twenty-seven patients (22.0%) died during hospitalization. Similar areas under the curve (AUROCs) for prognosis of mortality were observed when different models were compared on admission (P > 0.05) and after 48 h of hospitalization (P > 0.05). When models executed after 48 h of hospitalization were compared to their corresponding model calculated on admission, significantly higher AUROCs were obtained for all models (P < 0.05), except for MELD-Na (P = 0.075) and iMELD (P = 0.119).
Conclusion. The studied models showed similar accuracy as predictors of in-hospital mortality in cirrhotic patients admitted for acute decompensation. However, the performance of these models was significantly better when applied 48 h after admission when compared to their calculation on admission.
Liver fibrosis stage is probably the most robust prognostic factor in several liver diseases.1 Cirrhosis is the end-stage of every chronic liver disease.2 Its natural history is characterized by an asymptomatic phase, named “compensated cirrhosis”, and followed by the development of complications of portal hypertension and/or liver dysfunction, named “decompensated cirrhosis”.3 Decompensated cirrhosis is defined by the presence of ascites, variceal bleeding, encephalopathy, and/or jaundice.4 Transition from a compensated to a decompensated stage occurs at a rate of approximately 11% per year.5 Ten years after diagnosis, the probability of developing decompensated cirrhosis is 58%, whereas ascites is the most frequent complication (47%).6 Once patients have developed the first episode of decompensation, life expectancy is markedly reduced.7 The course of cirrhosis is extremely variable from patient to patient due to several factors. Hence, it is very difficult to define prognosis in individuals with end-stage liver disease.8
Traditionally, prognosis of cirrhosis has been determined by the Child-Turcotte-Pugh (CTP) and/or Model for End-Stage Liver Disease (MELD) scoring systems, despite the fact that they were initially validated for assessing survival in patients undergoing surgery for portal hypertension and transjugular intrahepatic portosystemic shunts, respectively.9–11 The name “Child-Pugh” refers to a currently applied modified score system from the original CTP.12 Many known limitations of the Child-Pugh score exist, including the reliance on subjective interpretation of qualitative variables and the empirical choice of the five variables.13
MELD score is based on bilirubin, international normalized ratio (INR) and creatinine. The three variables were selected based on statistical analysis rather than by empirical means, as with the Child-Pugh score.14 MELD score became a reliable marker of early mortality and has been adopted for organ allocation to patients listed for liver transplantation in the United States since 2002 and in Brazil since 2006.14–16
The MELD score-Na (MELD-Na) incorporated serum sodium (SNa) into the equation by adding additional scores to the original MELD in patients with SNa between 120 mEq/L and 134 mEq/L. Recent studies have shown that the incorporation of SNa to MELD calculations can improve the prediction of short-term mortality in patients with cirrhosis.17–20
Posteriorly, further studies also assessed the prognosis of cirrhotic patients with MELD-based models, such as iMELD (integrated MELD) and MESO index (MELD to sodium index), and likewise, both scores included the SNa within their equations to improve their prognostic power.21,22 Additional modifications of the MELD score were proposed for optimization of the model.23 These versions, called Refit MELD and Refit MELDNa, incorporate coefficients and restore lower and upper bounds for the variables MELD and MELD-Na, respectively. Refit MELD and Refit MELDNa have been shown to be more efficient than the original model as prognostic predictors in patients listed for liver transplantation.23
Although several prognostic models have been proposed for cirrhotic patients on the transplantation list, the performance of these scores as predictors of mortality in patients admitted for acute decompensation of cirrhosis has not been satisfactorily investigated. The aim of this study was to evaluate the models MELD, MELD-Na MESO, iMELD, Refit MELD, and Refit MELD-Na as prognostic predictors of in-hospital mortality in cirrhotic patients admitted for acute decompensation, and to compare their performance on admission and 48 h after admission.
Material and MethodsPatientsThis cohort study included consecutive patients admitted to the emergency department of a tertiary Brazilian hospital for acute decompensation of liver cirrhosis. Acute decompensation was defined by the acute development of hepatic encephalopathy, large ascites, gastrointestinal bleeding, bacterial infection, or any combination of these. Exclusion criteria from this study included the following: individuals admitted for elective procedures, admissions unrelated to liver cirrhosis complications or those that lasted less than 48 h, absence of laboratory tests for calculating the prognostic models at admission and/or 48 h after, and refusal from patient or caregiver or inability to understand the terms of the informed consent. If a patient was admitted more than once during the study period, only the most recent was considered.
Diagnosis of cirrhosis was established histologically (when possible), or clinically by combining imaging, clinical, and laboratorial findings, as well as evidence of portal hypertension.
The study protocol was approved by the Ethics Committee on Human Research of the Federal University of Santa Catarina (UFSC).
ProceduresIndividuals with suspected infection at hospital admission were submitted to clinical examination to confirm this diagnosis and to establish the primary source of infection. A diagnostic paracentesis was performed in all patients with ascites at admission. Spontaneous bacterial peritonitis (SBP) was diagnosed when the neutrophil count of the ascitic fluid was ≥ 250 neutrophils/mm3 in the absence of intraabdominal source of infection, regardless of negative culture.24 All patients with SBP received ceftriaxone plus weight-based intravenous albumin in the first and third day after the diagnosis. Hepatic encephalopathy was graded according to the West-Haven criteria (and, if present, a precipitant event was actively investigated, lactulose was initiated, and the dose adjusted as needed).25 All subjects with acute variceal bleeding received intravenous octreotide and an antibiotic (oral norfloxacin or an intravenous option, ciprofloxacin or ceftriaxone) and underwent urgent therapeutic endoscopy after stabilization. Esophageal varices were treated with band ligation whenever technically feasible or with sclerotherapy in the remaining cases. Secondary prophylaxis with propranolol (if not contra-indicated) was started on the 6th day of hospitalization, and the patients were scheduled for follow-up endoscopies with band ligation.26 All patients were initially admitted in the emergency room. The decision to transfer the patient to the ward or the intensive care unit (ICU) was made at the discretion of the attending physician according to the severity of the acute decompensation.
Patients were evaluated within the first 12 h of admission by one of the involved researchers, and the following clinical variables were collected: age, gender, etiology of cirrhosis, and current and previous decompensation. Current alcoholism was defined as an average consumption of 21 or more alcoholic drinks per week for men and 14 or more alcoholic drinks per week for women during 4 weeks prior to inclusion in the study (a standard dose of alcohol is equivalent to 12 g of absolute alcohol).27 All patients underwent laboratory evaluation within 12 h of hospital admission and 48 h after admission, and the following variables were considered for the study: creatinine, sodium, total bilirubin and INR. Patients were observed during hospitalization for definition of the studied outcome (in-hospital mortality). CTP classification was used for characterization of the patients.28
Prognostic modelsThe following prognostic models were calculated based on tests performed on admission and 48 h after admission: MELD,29 MELD-Na,30 MESO,21 iMELD,22 Refit MELD, and Refit MELD-Na.23 See annex 1 for calculation formula of prognostic models.
Statistical analysisKolmogorov-Smirnov Testing was performed to evaluate the normality of the distribution of each variable. Continuous variables were compared using the Student’s “t” test, for normal distributions, or Mann-Whitney, for the remaining cases. Categorical variables were evaluated using a chi-square or Fisher’s exact test as needed. The accuracy of prognostic models was analyzed by receiver operating characteristics (ROC) curves and by calculating the sensitivity, specificity, and positive and negative predictive values for the chosen cutoffs. Comparisons of ROC curves were performed by MedCalc software version 12.4 (MedCalc Software, Mariakerke, Belgium) by the technique described by Hanley & McNeil.31 Calibration of the models was assessed by the Hosmer-Lemeshow goodness-of-fit test. All the remaining tests were two-tailed and were performed by the statistical software SPSS, version 17.0 (SPSS, Chicago, IL, USA). P-Values of less than 0.05 were considered statistically significant.
ResultsPatient characteristicsFrom December 2010 to November 2012, 199 admissions for acute decompensation of liver cirrhosis were performed. However, some patients had more than one hospitalization during the study period and, in this case, only the most recent admission was considered. Though, 140 patients were evaluated for inclusion. Thirteen patients who remained hospitalized for less than 48 h were excluded. Also, an additional four individuals were excluded due to absence of laboratory tests. Thus, 123 patients were eligible for the study (Figure 1).

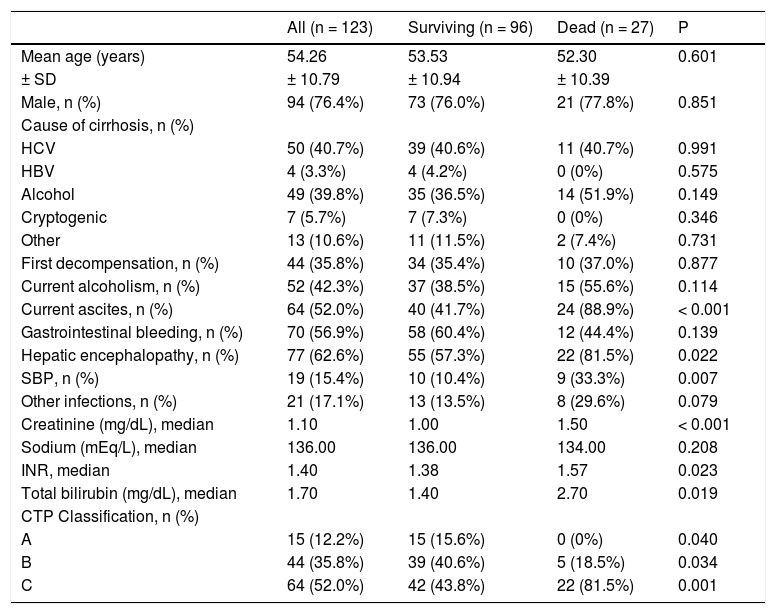
The included patients had a mean age of 54.26 ± 10.79 years, and were mostly male (76.4%) and Caucasian (56.9%). Current alcohol consumption was reported by 42.3% of patients. The main causes of liver cirrhosis were hepatitis C virus and alcohol in 50 (40.7%) and 49 (39.8%) patients, respectively. Previous episodes of decompensated liver disease was reported by 79 patients (64.2%), and 52.0% were classified as Child-Pugh C.
Upon admission, present complications included ascites (52.0%), upper gastrointestinal bleeding (56.9%), and hepatic encephalopathy (62.6%). Regarding infections, SBP was present in 15.4% of cases, and other infections were present in 17.1% of the sample (Table 1). Renal disfunction (creatinine levels ≥ 2 mg/dL) was observed in 16.3% of the patients.
Characteristics of 123 individuals admitted for acute decompensation of liver cirrhosis.
| All (n = 123) | Surviving (n = 96) | Dead (n = 27) | P | |
|---|---|---|---|---|
| Mean age (years) | 54.26 | 53.53 | 52.30 | 0.601 |
| ± SD | ± 10.79 | ± 10.94 | ± 10.39 | |
| Male, n (%) | 94 (76.4%) | 73 (76.0%) | 21 (77.8%) | 0.851 |
| Cause of cirrhosis, n (%) | ||||
| HCV | 50 (40.7%) | 39 (40.6%) | 11 (40.7%) | 0.991 |
| HBV | 4 (3.3%) | 4 (4.2%) | 0 (0%) | 0.575 |
| Alcohol | 49 (39.8%) | 35 (36.5%) | 14 (51.9%) | 0.149 |
| Cryptogenic | 7 (5.7%) | 7 (7.3%) | 0 (0%) | 0.346 |
| Other | 13 (10.6%) | 11 (11.5%) | 2 (7.4%) | 0.731 |
| First decompensation, n (%) | 44 (35.8%) | 34 (35.4%) | 10 (37.0%) | 0.877 |
| Current alcoholism, n (%) | 52 (42.3%) | 37 (38.5%) | 15 (55.6%) | 0.114 |
| Current ascites, n (%) | 64 (52.0%) | 40 (41.7%) | 24 (88.9%) | < 0.001 |
| Gastrointestinal bleeding, n (%) | 70 (56.9%) | 58 (60.4%) | 12 (44.4%) | 0.139 |
| Hepatic encephalopathy, n (%) | 77 (62.6%) | 55 (57.3%) | 22 (81.5%) | 0.022 |
| SBP, n (%) | 19 (15.4%) | 10 (10.4%) | 9 (33.3%) | 0.007 |
| Other infections, n (%) | 21 (17.1%) | 13 (13.5%) | 8 (29.6%) | 0.079 |
| Creatinine (mg/dL), median | 1.10 | 1.00 | 1.50 | < 0.001 |
| Sodium (mEq/L), median | 136.00 | 136.00 | 134.00 | 0.208 |
| INR, median | 1.40 | 1.38 | 1.57 | 0.023 |
| Total bilirubin (mg/dL), median | 1.70 | 1.40 | 2.70 | 0.019 |
| CTP Classification, n (%) | ||||
| A | 15 (12.2%) | 15 (15.6%) | 0 (0%) | 0.040 |
| B | 44 (35.8%) | 39 (40.6%) | 5 (18.5%) | 0.034 |
| C | 64 (52.0%) | 42 (43.8%) | 22 (81.5%) | 0.001 |
SD: standard deviation. HCV: hepatitis C virus. HBV: hepatitis B virus. SBP: spontaneous bacterial peritonitis. mg/dL: milligrams per deciliter. mEq/L: miliequivalents per liter. INR: international normalized ratio. CTP: child-turcotte-pugh.
Twenty-one patients (17%) were later transferred to the intensive care unit.
Performance of prognostic models in predicting in-hospital mortalityAmong individuals included in the study, 27 (22.0%) died during hospitalization. Compared to the others, these individuals had higher proportions of ascites (P < 0.001), hepatic encephalopathy (P = 0.022) and spontaneous bacterial peritonitis (SBP) (P = 0.007) at admission. Moreover, those who died were classified as CTP C more frequently (P < 0.001) and had higher creatinine (P < 0.001), INR (P = 0.023) and bilirubin levels (P = 0.019). Also, a trend was found towards higher rates of other infectious complications among those who died compared to others (P = 0.079). No differences were observed for the other variables (Table 1).
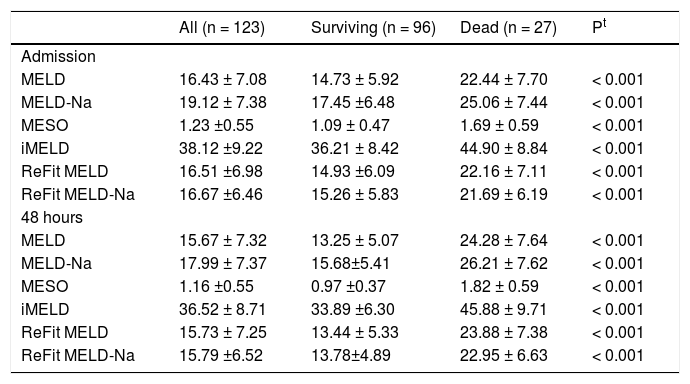
Table 2 shows values of the MELD, MELD-Na, MESO, iMELD, Refit MELD, and Refit MELD-Na models at admission and 48 h after admission. Significantly, higher mean values (P < 0.001) were observed for all models among individuals who died compared to survivors.
Values of prognostic models accordingly to in-hospital mortality.
| All (n = 123) | Surviving (n = 96) | Dead (n = 27) | Pt | |
|---|---|---|---|---|
| Admission | ||||
| MELD | 16.43 ± 7.08 | 14.73 ± 5.92 | 22.44 ± 7.70 | < 0.001 |
| MELD-Na | 19.12 ± 7.38 | 17.45 ±6.48 | 25.06 ± 7.44 | < 0.001 |
| MESO | 1.23 ±0.55 | 1.09 ± 0.47 | 1.69 ± 0.59 | < 0.001 |
| iMELD | 38.12 ±9.22 | 36.21 ± 8.42 | 44.90 ± 8.84 | < 0.001 |
| ReFit MELD | 16.51 ±6.98 | 14.93 ±6.09 | 22.16 ± 7.11 | < 0.001 |
| ReFit MELD-Na | 16.67 ±6.46 | 15.26 ± 5.83 | 21.69 ± 6.19 | < 0.001 |
| 48 hours | ||||
| MELD | 15.67 ± 7.32 | 13.25 ± 5.07 | 24.28 ± 7.64 | < 0.001 |
| MELD-Na | 17.99 ± 7.37 | 15.68±5.41 | 26.21 ± 7.62 | < 0.001 |
| MESO | 1.16 ±0.55 | 0.97 ±0.37 | 1.82 ± 0.59 | < 0.001 |
| iMELD | 36.52 ± 8.71 | 33.89 ±6.30 | 45.88 ± 9.71 | < 0.001 |
| ReFit MELD | 15.73 ± 7.25 | 13.44 ± 5.33 | 23.88 ± 7.38 | < 0.001 |
| ReFit MELD-Na | 15.79 ±6.52 | 13.78±4.89 | 22.95 ± 6.63 | < 0.001 |
MELD: Model for End-Stage Liver Disease. MELD-Na: MELD with serum sodium incorporation. MESO: model for end stage liver disease to sodium index. iMELD: integrated MELD. Refit MELD: revised model for end-stage liver disease. Refit MELD-Na: revised model for end-stage liver disease with sodium. t: Student’s “t” test.
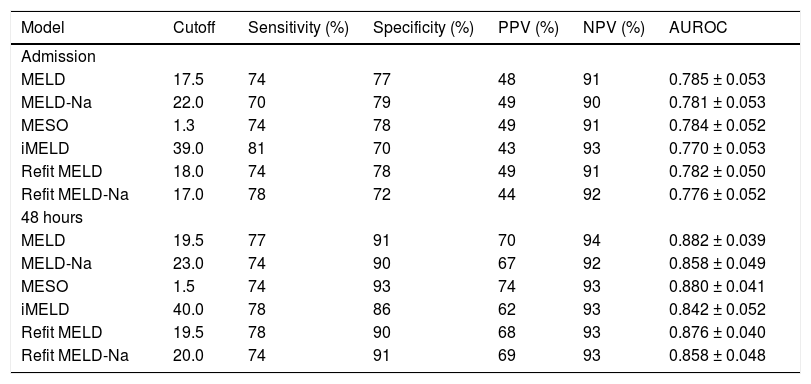
ROC curves of the studied models at admission and 48 h after admission were plotted to evaluate their performance in predicting in-hospital mortality. Upon admission, the values for the area under the ROC curve (AUROC) were 0.785 ± 0.053 (MELD), 0.784 ± 0.052 (MESO), 0.782 ± 0.050 (Refit MELD), 0.781 ± 0.053 (MELD-Na), 0.776 ± 0.052 (Refit MELD-Na), and 0.770 ± 0.053 (iMELD). No significant differences were observed when model equations calculated at admission were compared among each other (P > 0.05). The same models were calculated after 48 h of hospitalization and the resulting AUROC values were 0.882 ± 0.039 (MELD), 0.880 ± 0.041 (MESO), 0.876 ± 0.040 (Refit MELD), 0.858 ± 0.048 (Refit MELD-Na), 0.858 ± 0.049 (MELD-Na), and 0.842 ± 0.052 (iMELD). Again, no differences were observed when comparing the models calculated after 48 h of admission (P > 0.05). However, when admission models were compared to models calculated 48 h after admission, significantly higher AUROC values were observed for MELD-48 vs. MELD-admission (P = 0.015), MESO-48 against MESO-ADM (0.015), Refit-MELD-48 against RefitMELD-ADM (P = 0.011), and Refit-MELD-Na-48 against Refit MELD-Na-admission (P = 0.049). A trend was observed towards greater AUROC values for the MELD-Na-48 model compared with MELD-Na-admission (P = 0.075). No statistical differences were observed when comparing iMELD-48 model against iMELD-admission (P = 0.119).
Based on the ROC curve, best cutoff points were chosen for studied models at admission and 48 h after admission (Table 3). Generally, similar sensitivity was noted at the two moments of model calculation; however, a significant gain in specificity and positive predictive value (PPV) was observed at the 48 h evaluation. Upon admission, very similar performances were observed in many of the models; however, the MELD-Na model showed lower sensitivity (70%) and the iMELD and Refit-MELD-Na models showed lower specificity (70 and 72%, respectively) when compared to the remaining models. The models at 48 h after admission all presented similar performance, except for iMELD, which showed slightly lower specificity than the rest (86%).
Performance of the selected cutoffs and the values for the area under the ROC curve of prognostic models calculated at admission and 48 h after admission in predicting in-hospital mortality.
| Model | Cutoff | Sensitivity (%) | Specificity (%) | PPV (%) | NPV (%) | AUROC |
|---|---|---|---|---|---|---|
| Admission | ||||||
| MELD | 17.5 | 74 | 77 | 48 | 91 | 0.785 ± 0.053 |
| MELD-Na | 22.0 | 70 | 79 | 49 | 90 | 0.781 ± 0.053 |
| MESO | 1.3 | 74 | 78 | 49 | 91 | 0.784 ± 0.052 |
| iMELD | 39.0 | 81 | 70 | 43 | 93 | 0.770 ± 0.053 |
| Refit MELD | 18.0 | 74 | 78 | 49 | 91 | 0.782 ± 0.050 |
| Refit MELD-Na | 17.0 | 78 | 72 | 44 | 92 | 0.776 ± 0.052 |
| 48 hours | ||||||
| MELD | 19.5 | 77 | 91 | 70 | 94 | 0.882 ± 0.039 |
| MELD-Na | 23.0 | 74 | 90 | 67 | 92 | 0.858 ± 0.049 |
| MESO | 1.5 | 74 | 93 | 74 | 93 | 0.880 ± 0.041 |
| iMELD | 40.0 | 78 | 86 | 62 | 93 | 0.842 ± 0.052 |
| Refit MELD | 19.5 | 78 | 90 | 68 | 93 | 0.876 ± 0.040 |
| Refit MELD-Na | 20.0 | 74 | 91 | 69 | 93 | 0.858 ± 0.048 |
PPV: positive predictive valor. NPV: negative predictive value. AUROC: area under the ROC curve- MELD: Model for End-Stage Liver Disease. MELD-Na: MELD with sodium. MESO: Model for End-Stage liver Disease to sodium index. iMELD: integrated MELD. Refit MELD: revised model for end-stage liver disease. Refit MELD-Na: revised model for end-stage liver disease with sodium.
In patients admitted for the first episode of hepatic decompensation, the models evaluated after 48 h performed only slightly better than the admission evaluation, without statistical significance (P > 0.05). However, in patients having a history of previous decompensation, a significantly better performance was noted for models calculated at 48 h as compared to their counterparts calculated at admission (P < 0.05 for all models except MESO, which reached a P-value of 0.094). The AUROCs observed for admission models in those patients were 0.741 ± 0.068 (MELD), 0.745 ± 0.067 (MESO), 0.733 ± 0.066 (Refit MELD), 0.738 ± 0.069 (MELD-Na), 0.734 ± 0.066 (Refit MELD-Na), and 0.721 ± 0.071 (iMELD). The AUROCs for the models at 48 h were 0.874 ± 0.047 (MELD), 0.871 ± 0.049 (MESO), 0.869 ± 0.047 (Refit MELD), 0.841 ± 0.066 (MELD-Na), 0849 ± 0.059 (Refit MELD-Na), and 0.818 ± 0.068 (iMELD).
The P-values for the Hosmer-Lemeshow goodness-of-fit test for the models at admission were: MELD = 0.441, MELD-Na = 0.367, MESO = 0.271, iMELD = 0.247, Refit-MELD = 0.631, Refit-MELD-Na = 0.366. Similar values were observed after 48 h, with the following P-values: MELD = 0.873, MELD-Na = 0.172, MESO = 0.257, iMELD = 0.594, Refit-MELD = 0.655, Refit-MELD-Na = 0.766. These results indicate adequate calibration of the models at both moments.
DiscussionThe determination of prognosis is an essential part in the initial evaluation of any disease. Prognosis is not only the basis for the information that a physician provides to the patient, but also guides clinical approach. Identification of prognostic markers of poor outcome in cirrhotic patients admitted for acute decompensation could allow better risk stratification, and eventually guide the most appropriate therapeutic measures for each case.
The models MELD-Na, MESO, iMELD, Refit MELD, and Refit MELD-Na incorporate to MELD score coefficients and lower and upper limits of individual variables that have been optimized for the patients for which the MELD score is applied. Most of these models assess waiting-list mortality and thus are the most efficient donated organ allocation classification.
Lee, et al. remark that an important issue, perhaps requiring further attention, is that the MELD system was originally created in patients who did not have acute or reversible complications. Whether the MELD system and its derived models can be equally applied as a tool for outcome prediction in different clinical scenarios beyond their original aim requires additional study.32 In contrast to the majority of published studies on this subject, the current work was conducted by evaluation of in-hospital mortality. The present study has compared MELD score to five different prognostic scales (MELD-Na, iMELD, MESO, MELD-Refit, and Refit-MELD-Na), both in admission and after 48 h of hospitalization, to assess in-hospital (short-term) mortality in patients with acute decompensation of liver cirrhosis. Most studies intend to evaluate midterm and long-term mortality.
In 2009, Didier Samuel recognized the importance of improving prognostic scoring systems for cirrhotic patients. He stressed that applying the new scores to a variety of cirrhotic patients and to different etiologies of the disease is vital, as well as determining the prognostic value of the scores in the short, medium, and longer terms.(33) Before the publication of Refit models,18 many studies have compared MELD to the new MELD-based models in combination with SNa. Most studies found that new models with the addition of SNa were superior to traditional MELD scores in predicting short, medium, and long term mortality.16,17,34–36
Kim, et al. evaluated data from 13,940 patients from the U.S. Standard Transplant Analysis and Research, and concluded that assignment of priority according to the MELD score combined with the SNa concentration might have resulted in transplantation and prevented death.17 In Southern Brazil, Marroni, et al. evaluated 558 individuals on the waiting list for liver transplantation, and they observed that SNa-modified MELD scores are able to more accurately predict 3- and 6-month mortality (P < 0.001).16
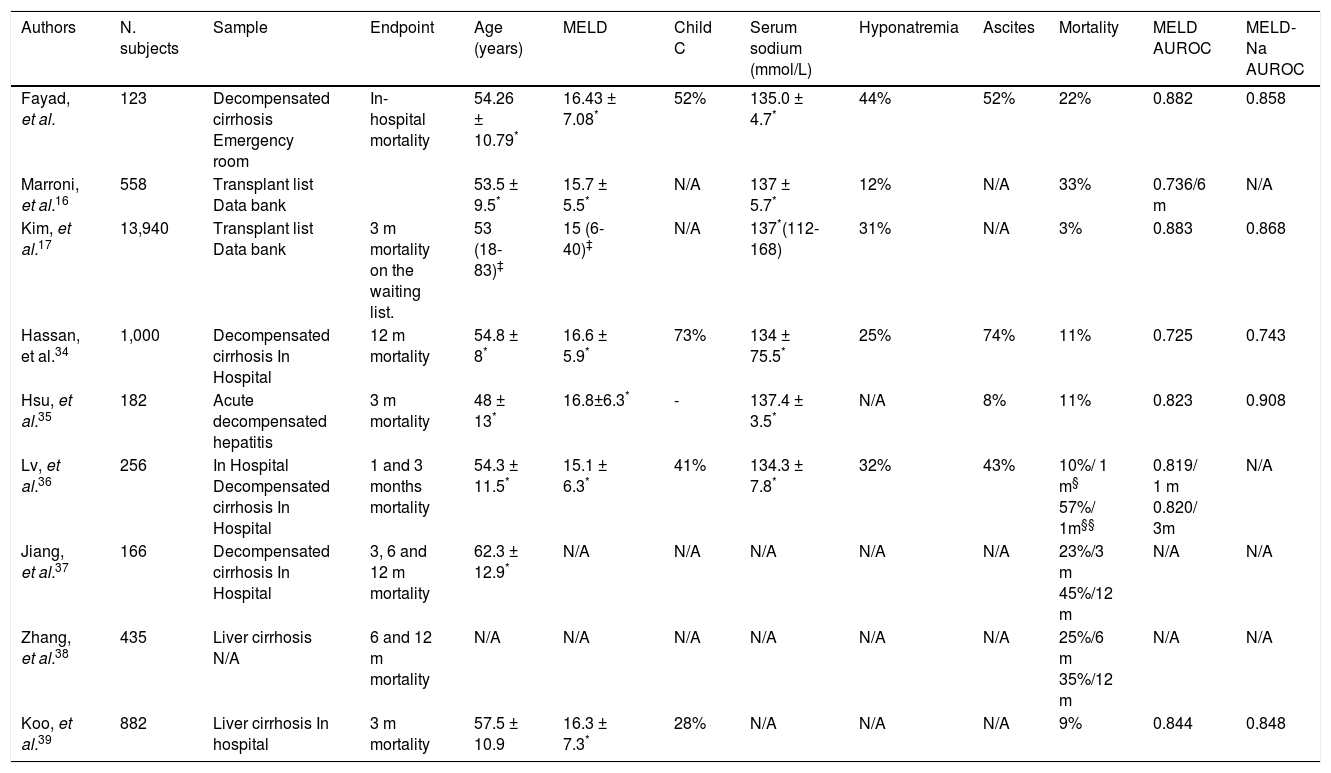
The majority of the studies that evaluate the ability of MELD and its derivatives to predict mortality in cirrhotic patients are retrospective, and aim to evaluate 1-, 3-, 6- or 12-month mortality (Table 4).34,37–39 As far as we are concerned, this is the first study to evaluate in-hospital mortality.
Characteristics of different studies that evaluated MELD and MELD-based models to predict mortality.
| Authors | N. subjects | Sample | Endpoint | Age (years) | MELD | Child C | Serum sodium (mmol/L) | Hyponatremia | Ascites | Mortality | MELD AUROC | MELD-Na AUROC |
|---|---|---|---|---|---|---|---|---|---|---|---|---|
| Fayad, et al. | 123 | Decompensated cirrhosis Emergency room | In-hospital mortality | 54.26 ± 10.79* | 16.43 ± 7.08* | 52% | 135.0 ± 4.7* | 44% | 52% | 22% | 0.882 | 0.858 |
| Marroni, et al.16 | 558 | Transplant list Data bank | 53.5 ± 9.5* | 15.7 ± 5.5* | N/A | 137 ± 5.7* | 12% | N/A | 33% | 0.736/6 m | N/A | |
| Kim, et al.17 | 13,940 | Transplant list Data bank | 3 m mortality on the waiting list. | 53 (18-83)‡ | 15 (6-40)‡ | N/A | 137*(112-168) | 31% | N/A | 3% | 0.883 | 0.868 |
| Hassan, et al.34 | 1,000 | Decompensated cirrhosis In Hospital | 12 m mortality | 54.8 ± 8* | 16.6 ± 5.9* | 73% | 134 ± 75.5* | 25% | 74% | 11% | 0.725 | 0.743 |
| Hsu, et al.35 | 182 | Acute decompensated hepatitis | 3 m mortality | 48 ± 13* | 16.8±6.3* | - | 137.4 ± 3.5* | N/A | 8% | 11% | 0.823 | 0.908 |
| Lv, et al.36 | 256 | In Hospital Decompensated cirrhosis In Hospital | 1 and 3 months mortality | 54.3 ± 11.5* | 15.1 ± 6.3* | 41% | 134.3 ± 7.8* | 32% | 43% | 10%/ 1 m§ 57%/ 1m§§ | 0.819/ 1 m 0.820/ 3m | N/A |
| Jiang, et al.37 | 166 | Decompensated cirrhosis In Hospital | 3, 6 and 12 m mortality | 62.3 ± 12.9* | N/A | N/A | N/A | N/A | N/A | 23%/3 m 45%/12 m | N/A | N/A |
| Zhang, et al.38 | 435 | Liver cirrhosis N/A | 6 and 12 m mortality | N/A | N/A | N/A | N/A | N/A | N/A | 25%/6 m 35%/12 m | N/A | N/A |
| Koo, et al.39 | 882 | Liver cirrhosis In hospital | 3 m mortality | 57.5 ± 10.9 | 16.3 ± 7.3* | 28% | N/A | N/A | N/A | 9% | 0.844 | 0.848 |
N/A: not avaiable. AUROC: area under the curve
Very few studies have assessed prognosis of decompensated cirrhosis in the emergency room. Orloff, et al. evaluated 211 unselected consecutive patients with cirrhosis and bleeding varices to endoscopic sclerotherapy or emergency portacaval shunt. In baseline determinations of MELD versus Child-Pugh, there were no significant differences in predicting survival, recurrent encephalopathy, and rebleeding. The Child-Turcotte score was significantly more effective in predicting survival and time to recurrent encephalopathy.40
No significant differences were observed among the employed scores upon admission and 48 h after admission. We suppose that the similarity encountered among different prognostic models may reflect the finding that admission SNa was not related to mortality in the bivariate analysis and the high proportion of individuals decompensated with hyponatremia. In our series, the median SNa was 135.0 ± 4.7 mEq/mL, 44% of the individuals evidenced hyponatremia, and ascites was present in 52% of the sample. Other studies report a mean SNa level of 134-137 mEq/mL,16,17,34–36 with lower proportions of hyponatremia, varying from 12% to 32%.16,17,34,36 Cirrhotic patients often exhibit dilutional hyponatremia because of portal hypertension and vasodilatation.41 Remarkably, hyponatremia is commonly associated with severe complications in liver cirrhosis, including ascites, hepatorrenal syndrome and liver related mortality.42–45 Previous studies have shown that hyponatremia is a strong predictor of early mortality, independent of MELD score.19,30,46 The majority (90%) of patients with hyponatremia has a history of ascites,30 and ascites is also a predictor of mortality.47 In the present study, when individuals with hyponatremia were compared to those with normal SNa levels, we observed a higher proportion of individuals with ascites among those with hyponatremia (52 vs. 25%, P = 0.002; data not shown).
In the present study, higher AUROCs were observed within 48 h after hospital admission to predict in-hospital mortality when compared to models upon admission. This was the first study assessing this issue. Patients who respond to initial medical management are probably those with better prognosis, which is more clearly evidenced after 48 h of admission. Therefore, the MELD score and its derivatives more precisely represent the current liver function status after treating the acute complications that develop in these patients. Higher values of MELD in patients with fatal outcomes were observed in those who developed ascites, hepatic encephalopathy, spontaneous bacterial peritonitis, and those who presented higher values of creatinine, bilirubin, or INR. The MELD score and its derivatives correlate with residual liver function. They have demonstrated the ability to predict mortality in a broad spectrum of liver diseases. The variation in MELD values over time may correspond to dynamic changes in liver function and its increase may predict liver decompensation, especially in those with onset of hepatic encephalopathy or ascites. The determination of MELD score at two moments provides updated information on the severity of the disease and allows more aggressive therapy. On the other hand, the decrease in serial MELD values could indicate the correction of a reversible element, therefore reflecting a lower risk of mortality. Thus, the MELD score analysis in two different periods of time transmits additional clinical information and should be considered as a predictive factor in patients admitted for decompensated cirrhosis.
We acknowledge some limitations to our analysis. The primary and most obvious shortcoming of single-center studies is their potentially limited external validity, although they allow larger, multicenter studies to be planned appropriately and powered. This study was conducted in a referral center for liver transplantation and the studied sample is comparable to other populations in the world. Secondly, MELD-derived systems exclusively rely on objective laboratory data, and variations in laboratory methods potentially affect its accuracy. For instance, diurectics could influence creatinine levels. Despite their drawbacks, MELD-derived systems have been extensively used as a prognostic marker in cirrhosis. In the present study, all laboratory data were performed in the same institution. Additionally, the determination of the MELD-based equations on admission could eliminate possible bias such as diuretics treatment which could possibly alter creatinine and SNa level and confound the calculation of the scores. And finally, the relatively small number of patients included could limit the interpretation of the results. However, the prospective data collection and initial evaluation in the emergency room give the study elements that reflect the reality of clinical practice.
ConclusionMELD-based models showed similar accuracy as predictors of mortality in cirrhotic patients admitted for acute decompensation. However, the performance of these models was significantly better when applied 48 h after hospitalization when compared to their calculation on admission especially in patients with history of previous hepatic decompensation.
Abbreviations- •
CTP: Child-Turcotte-Pugh.
- •
iMELD: integrated MELD.
- •
MELD: Model for End-Stage Liver Disease.
- •
MESO index: MELD to sodium index.
- •
Refit MELD: Revised Model for End-Stage Liver Disease.
- •
SNa: serum sodium.
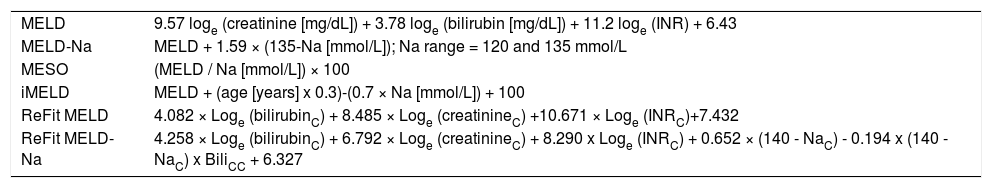
Annex 1.Calculation of prognostic models.
MELD 9.57 loge (creatinine [mg/dL]) + 3.78 loge (bilirubin [mg/dL]) + 11.2 loge (INR) + 6.43 MELD-Na MELD + 1.59 × (135-Na [mmol/L]); Na range = 120 and 135 mmol/L MESO (MELD / Na [mmol/L]) × 100 iMELD MELD + (age [years] x 0.3)-(0.7 × Na [mmol/L]) + 100 ReFit MELD 4.082 × Loge (bilirubinC) + 8.485 × Loge (creatinineC) +10.671 × Loge (INRC)+7.432 ReFit MELD-Na 4.258 × Loge (bilirubinC) + 6.792 × Loge (creatinineC) + 8.290 x Loge (INRC) + 0.652 × (140 - NaC) - 0.194 x (140 - NaC) x BiliCC + 6.327 MELD: Model for End-Stage Liver Disease. MELD-Na: MELD with serum sodium incorporation. MESO: Model for End-Stage Liver Disease to Sodium Index. iMELD: integrated MELD. Refit MELD: Revised Model for End-Stage Liver Disease. Refit MELD-Na: Revised Model for End-Stage Liver Disease with sodium.


