


Background. Obesity, a complex disease determined both by genetic and environmental factors, is strongly associated with NAFLD, and has been demonstrated to have a negative impact on HCV and other chronic liver diseases (CLD).
Rationale. This study assessed the association between type and location of food sources and chronic liver disease (CLD) using Geographic Information Systems (GIS).
Results. CLD patients completed surveys [267 subjects, 56.5% female, age 55.8 ± 12.0, type of CLD: 36.5% hepatitis C (HCV), 19.9% hepatitis B (HBV), 19.9% non-alcoholic fatty liver disease (NAFLD); primary food source (PFS): 80.8% grocery store, secondary: 26.2% bulk food store, tertiary: 20.5% restaurants; fresh food (FF): 83%, pre-packaged (PP) 8.7%, already prepared (AP) 8.3%]. FF consumers had significantly fewer UEH servings/month (p = 0.030) and lived further away from convenience stores (1.69 vs. 0.95 km, p = 0.0001). Stepwise regression reveals the lowest FF consumers were NAFLD patients, subjects with UEH or restaurants and ethnic food stores as their PFS (R = 0.557, p = 0.0001). Eating already-packaged foods and utilizing restaurants or ethnic food stores as the PFS positively correlated with NAFLD (R = 0.546, p = 0.0001). Conclusions. Environmental food source measures, including type and density, should be included when examining areas hyper-saturated with a variety of food options. In hyper-saturated food environments, NAFLD patients consume more prepared food and less FF. CLD patients with UEH also eat significantly more prepared food and frequent restaurants and ethnic food stores as their PFS.
Chronic liver disease (CLD) is a major source of morbidity, mortality and resource utilization, the 10th leading cause of death in the U.S., and an economic burden of 1% of the national health care expenditure.1,2 Obesity is strongly associated with nonalcoholic fatty liver disease (NAFLD), a common type of CLD.3 Additionally, obesity has a negative impact on other CLDs such as viral hepatitis C (HCV).4
From the few epidemiological studies done among CLDs, race and ethnicity appear to play a significant role, as does MS and insulin resistance.5–8 Zelber-Sagi examined the role of leisure time physical activity among those with NAFLD and found that habitual participation in physical activity may assist in protecting against progression of NAFLD. Over the past decade, there is increasing data to suggest that components of metabolic syndrome (MS), especially obesity, can also be associated with more adverse outcomes in three of the most prevalent types of liver disease (i.e. HBV, HCV and NAFLD).9,10,11 The concerning role of alcohol intake on morbidity and mortality coupled with burden of chronic viral liver disease has also been highlighted by the longitudinal Dionysos Study.11–13 In addition to its clinical impact, the true burden of liver disease includes the impact of CLD on patients’ health related quality of life.14
Few studies have examined both physical activity and dietary and nutrition factors related to CLD. In the precursor to this study and one of the first to examine dietary intake among those with CLD by Kim CH, we examined dietary intake data from 233 patients with chronic liver disease.15 As expected, NAFLD patients were found to have a statistically higher incidence of MS and obesity than HCV and HBV patients. There is consensus that specific dietary interventions should focus on decreasing intake of low-nutrient food, high-sodium food and high-fat sources of meat/protein. While there is much agreement on the components of a healthy diet for patients with fatty liver (i.e. rich in vegetables and lean sources of protein, Mediterranean) there is still some debate in terms of specific diet prescription.16–18 Earlier studies have shown relationships between moderate wine consumption and a reduced risk for cardiovascular disease. Dunn found moderate wine consumption was associated with a reduced prevalence of NAFLD.19
This study was designed:
- •
To describe the dietary choices of patients with the CLDs of HBV, HCV, and NAFLD, and
- •
To determine whether the type of food environment (quantified as the mix or high-quality and poor-quality food sources), food type (fresh, prepackaged, already prepared), food serving consumption, socioeconomic neighborhood, and/or shopping frequency are significant factors related to obesity and MS.
In order to accomplish our study goals, we used the Geographic Information Systems (GIS) to explore relationships between social factors, the environment and CLD. While there is limited data regarding the use of GIS with CLD (with the exception of liver transport studies), there is significant literature examining the relationships between the overweight and obese individuals and their access to fresh and affordable fruits and vegetables and recreation areas.20,21 In the United States and Canada, recent studies have explored the impact of “food deserts” on overweight and obese children and adults, particularly in urban communities, where few fresh fruit and vegetable markets exist and there is an excess of fast food establishments. Many of these studies have used advanced GIS methods to understand the relationships between where obese individuals live and their environment. Zhang used GIS to explore the relationships between the physical environments present in a variety of neighborhoods and childhood obesity.16 In the Washington DC study area, previous GIS analysis has found the mixture of food sources to be highly variable around the region.23
Through these analyses GIS studies were able to better select at-risk neighborhoods for interventions. In another study that looked at older adults, ages 50 to 75 years, Li examined the relationships between the local environment, physical activity and obesity and found that higher mixed-land use and a lower density of fast food restaurants were associated with a lower prevalence of obesity.24 Smith found that increasing levels of walk-ability are associated with decreased overweight and obesity indicators.25 Finally, Franco reviewed differential access to healthy foods in Baltimore, Maryland and found that predominantly African-American and lower-income neighborhoods have a lower availability of healthy foods than white and higher-income neighborhoods due to the placement of types of stores as well as the kinds of offerings provided at the stores.26 Thus, the application of this technology to liver disease may provide a better understanding for this challenging socio-medical problem.
Material and MethodsThis cross-sectional study included patients with CLD seen at an outpatient hepatology clinic of a large non-profit hospital system. The majority of patients seen at the clinic have been diagnosed with NAFLD, HBV or HCV. Patients with liver mass, acute hepatitis and post-transplant patients were excluded from the analysis. This study was conducted according to the guidelines laid down in the Declaration of Helsinki and all procedures involving human subjects were approved by the Inova Institutional Review Board. The IRB approved the mailing of the surveys with a cover-letter explaining the study and use of the data collected. Per this letter, return of the completed surveys was taken as intent to study consent.
Surveys were mailed to potential subjects, followed by a reminder postcard, and responses were collected for the next 9 months after the initial mailing. The Liver Nutrition Survey is an 83 question survey containing 13 indices measuring dietary choices and frequency of consumption for a wide variety of foods.15 Indices surveyed, included vegetable sources of protein (4 items), lean sources of protein (2 items), high fat sources of protein (4 items), total vegetable consumption (8 items), low fat milk products (3 items), high fat milk products (5 items), low nutrient dense foods/baking oils, fats, sweets (8 items), high in caffeine (4 items), alcohol (1 items), high sodium (10 items), fruit (6 items), bread and starchy foods (5 items), cereals and grains consumption (3 items). Scores were calculated based on weekly servings and entered into the study database. Each individual food item has seven consumption frequency options (servings per measure of time) ranging from ‘Never’ to ‘Daily’ consumption. When categories contained significant nutritional variance (e.g. milk), selection of individual preferences is available in addition to frequency (e.g. whole milk, 2% milk, 1% milk, skim milk, soy milk, never drink milk). A single standard serving size is listed with each food item, per USDA serving sizes.
Food pyramid servings were also tabulated including:
- •
Fats and oils.
- •
Milk, yogurt, cheese.
- •
Meat, poultry, fish, dry beans, eggs, and nuts.
- •
Fruits.
- •
Vegetables.
- •
Bread, cereal, rice, and pasta; and
- •
Other.
Due to the potential for some food items to fall into multiple categories, all nutrition indices were examined individually; no overall tally was derived from the questionnaire.
Hardcopy completed, returned surveys were used to enter data into our databases and stored in binders in locked cabinets at the study site. Addresses were geo-coded using the streets file from the 2010 Census Tigerline files.27 Information on the location of food stores came from the Dunn and Brad-street Selectory from the time of the survey mailing.28 Distances between addresses and food stores were calculated using Euclidean distance and the Northern Virginia state-plane projection. Maps of the distribution of survey recipients as well as an overview of the number of convenience stores per capita helped to visualize the study area and its relationship to the outpatient liver clinic. For each patient, clinical, demographic and laboratory data were also available.
Physical activity was operationally defined as an adjusted activity score developed from the Human Activity Profile (HAP), a 94 question, well-validated and reliable self-report measure of activity level that measures maximal activity level (MAS), and adjusted (daily) activity level (AAS).29 HAP questions ask subjects about their specific activities, and the energy cost of the activities listed in the HAP can be represented in metabolic equivalents (METs). Questions are arranged in order from the least physically challenging (e.g. question 1 covers ability to get out of bed) to most physically challenging task (i.e. ‘Running or jogging 3 miles in 30 minutes or less’).9,30
In addition to activity we developed an ‘unhealthy eating group’ (UEG). An index of non-healthy foods was developed using foods that were high in salt, fat, sugar, high fructose corn syrup or were fried. All endorsed unhealthy foods counted once towards the non-healthy foods index.
Using GIS, we obtained a number of variables from the patient’s residential area as well as socioeconomic data from the census block group the patient resided within. At the block group level, we use the median income and percentage of households without a vehicle to assess individual’s capability to obtain healthy food (and medical care). Also at the census block level we use the retail food environment (RFE) as a control.31 We use grocery stores, restaurants, and specialty food stores as healthy food sources (NAICS 44511, 7221, and 4452), with convenience stores, pharmacies, and fast food establishments as unhealthy food sources (NAICS 44512, 44611, and 7222). Our last two variables measure distance from the patient’s residence. The first is the distance to the nearest grocery store, while the second is a binary variable that is a 1 if the patient lives closer to a grocery store than to a restaurant or fast food location.
Statistical analysisDescriptive statistics were compiled for each diagnostic group. Analyses comparing the diagnoses, regarding clinical and demographic data, geographic measures and subjects’ self-reports about diet were performed. Parametric measures including analysis of variance (ANOVA) with Bonferroni post hoc analysis were performed comparing diagnoses meeting criteria for additional analysis, followed by t-tests to determine directionality of significant results on ANOVA.32 Regression analysis was conducted to determine correlates of unhealthy eating habits, defined as 70 or more unhealthy food servings per month (high fat, sugar, salt, fried, or high fructose corn-syrup-containing foods). Responses with incomplete surveys were not included in analyses.
Study size was determined by percent of survey response, with a minimum cohort size of 50 subjects required per diagnostic group for additional analysis. Three diagnoses met criteria for additional analyses per number of completed surveys: HBV, HCV, and NAFLD. Demographics of survey responders and a random sample of 85 non-responders (selected via a random number generator) were compared to determine whether self-selection bias was present in response. The number of non-responders selected for the sample bias comparison was calculated from survey response rate in order to achieve an appropriate sample size of non-responders. Given their strong association with nutrition, we included four control variables from clinical data. These data include diagnosis of with viral hepatitis (HBV or HCV), age, and gender. In addition to their functions as controls for behavioral and geography variables, each of these variables was a significant factor for at least one modeled variable.
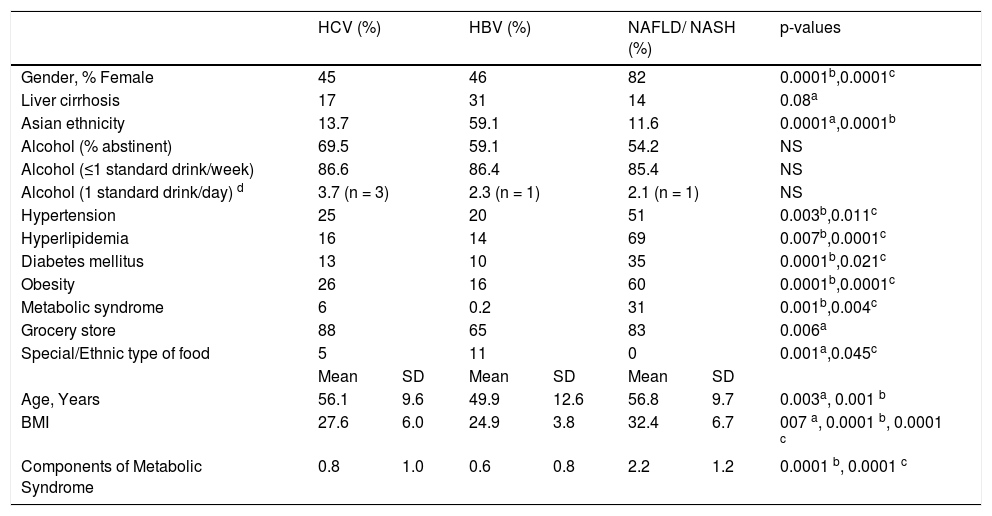
ResultsDescriptive statistics are presented in table 1. Two hundred sixty-seven of 1,633 invited to participate returned completed surveys [56.5% female, age 55.8 ± 12.0, primary diagnosis (36.5% HCV, 19.9% HBV, 19.9% NAFLD/NASH, 23.7% other), 21.8% cirrhosis, 23.8% severe liver disease (bridging fibrosis or cirrhosis), 31.2% hypertension, 34.8% hyperlipidemia, 17.6% diabetes mellitus (DM), 31.4% obese (body mass index, BMI ≥ 30), 10.5% metabolic syndrome (MS, 3 or more symptoms), birthplace (67.5% USA, 6.3% Vietnam, 26.2% other), ethnicity (62.5% Caucasian, 9.3% African American, 19.8% Asian, 3.6% Hispanic, 4.8% other)].
Population differences by diagnosis.
| HCV (%) | HBV (%) | NAFLD/ NASH (%) | p-values | ||||
|---|---|---|---|---|---|---|---|
| Gender, % Female | 45 | 46 | 82 | 0.0001b,0.0001c | |||
| Liver cirrhosis | 17 | 31 | 14 | 0.08a | |||
| Asian ethnicity | 13.7 | 59.1 | 11.6 | 0.0001a,0.0001b | |||
| Alcohol (% abstinent) | 69.5 | 59.1 | 54.2 | NS | |||
| Alcohol (≤1 standard drink/week) | 86.6 | 86.4 | 85.4 | NS | |||
| Alcohol (1 standard drink/day) d | 3.7 (n = 3) | 2.3 (n = 1) | 2.1 (n = 1) | NS | |||
| Hypertension | 25 | 20 | 51 | 0.003b,0.011c | |||
| Hyperlipidemia | 16 | 14 | 69 | 0.007b,0.0001c | |||
| Diabetes mellitus | 13 | 10 | 35 | 0.0001b,0.021c | |||
| Obesity | 26 | 16 | 60 | 0.0001b,0.0001c | |||
| Metabolic syndrome | 6 | 0.2 | 31 | 0.001b,0.004c | |||
| Grocery store | 88 | 65 | 83 | 0.006a | |||
| Special/Ethnic type of food | 5 | 11 | 0 | 0.001a,0.045c | |||
| Mean | SD | Mean | SD | Mean | SD | ||
| Age, Years | 56.1 | 9.6 | 49.9 | 12.6 | 56.8 | 9.7 | 0.003a, 0.001 b |
| BMI | 27.6 | 6.0 | 24.9 | 3.8 | 32.4 | 6.7 | 007 a, 0.0001 b, 0.0001 c |
| Components of Metabolic Syndrome | 0.8 | 1.0 | 0.6 | 0.8 | 2.2 | 1.2 | 0.0001 b, 0.0001 c |
SD: standard deviation. NS: not significant.
A comparison of demographics of survey responders to a random selection of 85 non-responders (N determined by effect size calculation from survey response) was conducted to determine if self-selection bias occurred in survey response. In non-cirrhotic subjects with HCV, responders were older and more likely to have hyperlipidemia (p = 0.001, each). In comparing non-cirrhotic HBV subjects, responders were more likely to be obese and have hyperlipidemia (p = 0.043 and 0.006, respectively). NAFLD non-cirrhotic survey responders were more likely to be older (p = 0.008, ~8 year) and female (0.035; 80 vs. 47%). However, NAFLD responders were less likely to be obese than non-responders (0.013; 56 vs. 90%). Patients who had not returned for follow-up within the past 3 years were less likely to respond to survey.
Alcohol consumption was not significant in this cohort analysis. Consumption rate among survey respondents did not meet the minimal threshold for abuse per the Belletani and Dionysus studies (30 g/ day as lowest intake associated with liver disease or synergistic interaction with HCV).11–13,18 Overall alcohol consumption frequency was low. The majority of respondents abstaining or consuming less than 5 standard drinks per month; 5 subjects reported one standard alcoholic beverage (14 g) daily (Table 1).
The grocery store was the primary source of food for 80.8% Secondary and tertiary choices of food sources varied: 26.2% for bulk food sources was the highest percentage for secondary food source and restaurants with 20.5% had the highest percentage of tertiary food source choices. 61.9% live closer to a grocery store than a convenience store, 52.3% live closer to a restaurant than a fast food establishment and 26.6% live closer to a restaurant or fast food establishment than a grocery store. The majority of respondents reported purchasing fresh food (FF) (83% fresh, 8.7% pre-packaged, 8.3% already prepared). Those choosing FF as their primary food type consumed significantly fewer unhealthy foods per month than those choosing primarily prepared foods (p = 0.030).
Stepwise regression revealed that fresh food as primary food type consumed was negatively associated with restaurants (primary food source), ethnic food stores (primary food source), unhealthy eating habits and NAFLD/NASH (R = 0.557, p = 0.0001). Conversely, already prepared food was positively correlated with restaurants (primary food source), ethnic food stores (primary food source) and NAFLD/NASH (R = 0.546, p = 0.0001). Prepackaged food as primary food type was positively associated with unhealthy eating habits (R = 0.314, p = 0.009).
Figure 1 shows the distribution of survey recipients in the District of Columbia (DC) metropolitan area. Recipients of surveys are heavily concentrated in the counties surrounding the outpatient liver clinic.
 metropolitan area.")
Geographically, respondents were on average closest to restaurants (1.11 km), then fast food establishments (1.17 km), grocery stores (1.22 km) and convenience stores (1.51 km). Some respondents were within 0.161 km (a tenth of a mile) to each, while others were over 8.05 km (5 miles) away from a food source. With regard to densities, two different search diameters were employed. At the 1.61 km (1 mile) radius, patients have an average of 4.5 grocery stores, 2.2 convenience stores, 1.7 pharmacies, 12.0 sit-down restaurants and 7.6 fast food establishments. Widening the circle to 8.05 km (5 miles) gives averages of 86.8 grocery stores, 41.8 convenience stores, 31.8 pharmacies, 208.9 restaurants and 140.8 fast food vendors. The study region is densely developed for a suburban region, with multiple malls and continuous strip mall development. High values include observations of 1,008 restaurants within the 8.05 km (5 mile) circle of their residence, 542 fast food vendors within 8.05 km (5 miles) and 46 grocery stores within 1.61 (1 mile). Respondents who selected fresh food as their primary food type also lived significantly further away from convenience stores (mean = 1.69 km) than those whose primary food type was already prepared foods (mean = 0.950 km, p = 0.0001).
In figure 2, the number of convenience stores per capita is mapped. This variable was chosen both for its importance to the models under study and for the fact that there is substantial spatial variation, with less county-level variation for other food-related establishments such as grocery stores. Convenience stores are not as dense in the poor counties. The densest regions of convenience stores are in the more peripheral counties as well as the independent cities. The next level of convenience store density is in the slightly less-peripheral counties of Virginia as well as one independent city. Two counties and the District of Columbia have middling levels of convenience stores, with the remaining suburban areas having a relatively low level of convenience stores per capita.
Comparison of Clinical and Nutritional Assessment of Patients with HBV and HCV
HCV patients were significantly older than responding HBV patients (p = 0.003) and had a significantly higher BMI (p = 0.007). HBV patients had more liver cirrhosis (p = 0.057) and were significantly more likely to be of Asian descent (p = 0.0001) (Table 1). HBV patients have significantly less distance to travel to reach a grocery store (1.24 vs. 0.805 km, p = 0.033), restaurants (1.34 vs. 0.772 km, p = 0.030) and fast food options (1.30 vs. 0.772 km, p = 0.001) than HCV patients. A significantly higher percentage of HCV patients chose grocery stores as their primary food source, due in part to a higher selection of bulk and ethnic food stores in HBV patients (p = 0.045), with grocery store, bulk, ethnic and restaurants as secondary (p = 0.041) food sources.
Comparison of Clinical and Nutritional Assessment of Patients with HBV and NAFLD/NASHThe NAFLD/NASH group contained a significantly higher percentage of women (p = 0.0001), as well as significantly more hypertension (p = 0.003), hyperlipidemia (p = 0.007) and diabetes mellitus (p = 0.0001) (Table 1).
The HBV group was significantly younger ( p = 0.001), had a higher percentage of Asian subjects (p = 0.002), lower BMI (p = 0.0001), with lower obesity rate (p = 0.0001), lower number of MS components (p = 0.0001) and fewer cases of MS (p = 0.001) (Table 1). HBV and NAFLD/NASH patients did not differ in their choice of primary food source (grocery store), but did differ in their choice of secondary food source (p = 0.014), with HBV subjects mainly selecting grocery and bulk stores as their secondary food source while NAFLD subjects mainly selected bulk stores, restaurants and fast food options. HBV patients also lived closer to grocery stores (0.805 vs. 1.34 km, p = 0.045) than NAFLD/NASH patients.
DiscussionThis analysis represents one of the first studies to examine the geographic factors that may influence obesity in people with CLD. This is important because obesity is prevalent in this population and is a risk factor for disease progression and mortality.33 While some of the findings are consistent with the obesity literature, other results are noticeably different. Consistent with findings from the obesity literature, patients with CLD who choose fresh food over already prepared food and consume significantly fewer servings of unhealthy (high salt, fat/grease, fried, high sugar/fructose corn syrup-containing) foods per month were less likely to have NAFLD/NASH.22 Patients who consumed significantly lower amounts of fresh food also were significantly more likely to have NAFLD, report restaurants as their primary food source, and consume seventy or more unhealthy servings of food (high fat, cholesterol, sodium, or sugary foods) per month. These findings have implications for patient intervention.
In contrast to much of the obesity environment literature, most respondents in this study lived closer to restaurants than fast food establishments and there was a high density of grocery stores, particularly within the 8.05 km (five mile) radius.24 These data may also reflect socioeconomic factors, however, such that there are fewer fast food restaurants in higher socioeconomic environments (the dominant county in the study area is one of the wealthier counties in the nation in terms of per capita income). With regards to the comparison to previous studies regarding the geography of food sources, the patient area surveyed appears supersaturated with food sources, types and options. Also, the area and population served tends to be relatively affluent, while much research into obesity and environment has focused upon the “food deserts” of lower socioeconomic urban areas. While this means that study results may not be generalizable to the wider U.S. population, studying this confluence of saturation and affluence may more accurately elucidate the choices people make in terms of dietary preference when not significantly limited by either food type or source availability or economic limitations in food selection. Hence, the food environment may be an important variable, despite lack of statistical significance in this study. This study was hampered by a relatively small number of participants for a geographic study. A larger sample size may be needed to assure non-significant results are not false negative. HCV genotype was not included in the minimum list of potential identifiers surveyed in the respondents, thus the fatty contribution of genotype cannot be assessed. HCV-1 has been associated with metabolic complications, and HCV-3 has a direct cytopathic effects.34–35 The majority of the HCV subjects seen at the clinic mailing the survey were HCV-1 seeking clinical trial involvement.
Because of the low response rate (267/1633), a comparison of demographic data was made between non-cirrhotic responders and non-responders by diagnosis to assess selection bias. In non-cirrhotic subjects with HCV, responders were older and more likely to have hyperlipidemia. Non-cirrhotic HBV responders were more likely to be obese and have hyperlipidemia. NAFLD non-cirrhotic survey responders were more likely to be older and female and less likely to be obese than non-responders. Importantly, patients who had not returned for follow-up within the past 3 years or longer were much less likely to respond to survey.
Food geography, dietary behavior, and the economic environment appear to exert influence on food choices and health. The impact of geography on dietary choices and sources is not an easily quantifiable factor in areas saturated with many food options. However the combination of saturation of food type and source options without significant economic limitations in food choice selection permits measurement of dietary choices without these influencing factors. UEH were correlated with NAFLD patients’ consumption of more prepared food and less fresh food. CLD patients with UEH also eat significantly more prepared food. Based upon these findings, it is important for health care providers serving a CLD population to investigate a patient’s food environment, fresh food consumption, and primary food source choices and aggressively refer patients for dietetic services for effective life-style change management.36
AcknowledgementsAuthors would like to acknowledge the inter-organizational research support of George Mason University and Inova Health System Research Grant for new inter-organizational research collaborations as well as Liver Research Fund of the Center for Liver Diseases and the Guy & Betty Beatty Center for Integrated Research at Inova Fairfax Hospital. Also, the authors acknowledge the Inova Institutional Review Board for their review and support of this study.
Financial SupportThis study was partially funded by a George Mason University-Inova Health System Research Grant for new inter-organizational research collaborations. This study was also funded by the Liver Research Fund of the Center for Liver Diseases and the Guy & Betty Beatty Center for Integrated Research at Inova Fairfax Hospital. Funding sources were not involved in study design, data collection, analysis, interpretation, writing of article, or the decision to submit for publication.
Abbreviations- •
AAS: adjusted/daily activity level.
- •
ANOVA: analysis of variance.
- •
AP: already prepared.
- •
BMI: 31.4% obese (BMI > 30).
- •
CLD: chronic liver disease.
- •
DC: District of Columbia.
- •
DM: diabetes mellitus.
- •
FF: fresh food.
- •
GIS: geographic information systems.
- •
HAP: human activity profile.
- •
HBV: hepatitis B.
- •
HCV: hepatitis C.
- •
MAS: maximal activity level.
- •
METs: metabolic equivalents.
- •
MS: metabolic syndrome.
- •
MS, 3 or more symptoms: 10.5% metabolic syndrome.
- •
NAFLD: non-alcoholic fatty liver disease.
- •
PFS: primary food source.
- •
PP: pre-packaged.
- •
RFE: retail food environment.
- •
SD: standard deviation.
- •
UEG: unhealthy eating group.
- •
UEH: unhealthy eating habits.


