


Background/Objective: The present study aimed to (1) examine prevalence rates and frequency of dating violence victimization among a representative sample of Quebec high school adolescents and (2) explore possible gender differences in these rates as well as in perceived impact of victimization. Method: A sample of 8,194 students completed questionnaires evaluating dating victimization in the past 12 months as well as perceived impacts. Results: Results show that psychological violence is the most frequent form of dating victimization reported. Girls are more likely to report experiences of psychological, physical, threatening behaviors as well as sexual dating victimization than boys. Analyses on different indicators of the impact of victimization (i.e. feelings of fear, distress and post-traumatic stress symptoms) reveal that teenage girls are more vulnerable to sustaining more pervasive impacts than boys. Conclusions: The findings underscore dating violence as a prevalent public health problem. A significant number of teens report dating victimization with girls more likely than boys to perceive negative impacts associated with the coercive behaviors experienced.
Antecedentes/Objetivo: El presente estudio tuvo como objetivos: a) examinar las tasas de prevalencia y la frecuencia de la victimización de la violencia en parejas en una muestra representativa de adolescentes de Secundaria de Quebec y b) explorar diferencias por sexo en esas tasas, así como en el impacto percibido de la victimización. Método: Una muestra de 8.194 estudiantes respondió cuestionarios que evalúan la victimización en las relaciones de pareja adolescente en los últimos 12 meses, además del impacto percibido. Resultados: La violencia psicológica es la forma más frecuente de victimización en parejas adolescentes. Las chicas fueron más proclives a reportar violencia psicológica, física y comportamientos amenazantes, así como victimización sexual que los chicos. Los diversos indicadores del impacto de la violencia en las relaciones de pareja adolescente (miedo, sentimientos de angustia y síntomas de estrés postraumático) revelan que las mujeres son más vulnerables a sufrir impactos más generalizados que los varones. Conclusiones: La violencia en las relaciones de parejas adolescentes es un problema de salud pública. Un número significativo de adolescentes informó haber sido víctima en sus relaciones de pareja, con las mujeres con más probabilidades que los varones de percibir impactos negativos asociados.
Adolescence is a crucial stage of development associated with a number of challenges related to intimacy and the emergence of early romantic relationships (Connolly et al., 2014; Van de Bongardt, Yu, Deković, & Meeus, 2015). Healthy romantic relationships during adolescence are linked to positive outcomes including higher self-esteem, sense of social competence and skill building for long-term partnership (Fisher, 2016). However, a considerable proportion of teenagers are likely to sustain victimization in the context of their first romantic relationships and experience significant distress. A recent meta-analytic review of 101 studies of teen dating violence (TDV) prevalence revealed rates of physical violence ranging from 1% to 61% and those for sexual violence between less than 1% and 54% with an overall meta-analytic combination rate of 20% for physical TDV and 9% for sexual TDV (Wincentak, Connolly, & Card, 2017). Psychological violence was not considered in the meta-analysis, yet findings from an international review on North-American and European studies reported rates of psychological TDV varying from 17% to 88% (Leen et al., 2013). This wide variability observed among all forms of dating victimization can be attributed to a host of different factors, mainly operational, methodological and sampling discrepancies. Despite these differences, researchers are in accordance that a significant proportion of youths have experienced psychological and physical violence as well as sexual coercion in their first dating relationships.
Although previous studies have provided prevalence rates of TDV, several limitations remain in the current body of research. More specifically, few studies have investigated prevalence estimates of different forms of TDV concurrently, outcomes specifically related to victimization experiences as well as gender differences in representative samples. When assessing TDV victimization experiences, more insidious forms, such as threatening behaviors, are rarely considered separately. However, the presence of threats can be more telling of the nature of abusive behavior in adolescent relationships and are equally important to consider since they often precede more severe acts of violence (Wolfe et al., 2001). Moreover, most surveys failed to assess sexual TDV or often focalized on forced sex using ambiguous terms, omitted sexual assault that didn’t include completed sexual intercourse and neglected alcohol/drug induced sexual coercion (Hamby, 2009).
A number of findings are still at issue, namely the question of gender disparity in the prevalence of victimization as well as in severity of associated outcomes. For instance, no significant gender difference in victimization rates were highlighted in a recent household survey of 1,804 youth ages 12-18 with 19.6% of boys and 15.3% of girls reporting physical TDV in the U.S. (Taylor & Mumford, 2016). Similarly, prevalence of sexual victimization was found to be similar for girls (17.8%) and boys (18.2%). Psychological violence was the form of TDV most frequently reported, with similar disclosure rates among boys (65.7%) and girls (65.3%) (Taylor & Mumford, 2016).
These results are in sharp contrast with the most recent Centers for Disease Control and Prevention 2013 National Youth Risk Behavior Survey in which 9,900 students in dating relationships completed the survey (Vagi, Olsen, Basile, & Vivolo-Kantor, 2015). With the inclusion of sexual TDV for the first time in the CDC national survey, prevalence of distinct forms of TDV in the past 12 months was analyzed. All prevalence rates were found to be higher in teenage girls than for boys, namely physical only TDV (6.6 vs. 4.1%), sexual only TDV (8.0% vs. 2.9%), both physical and sexual TDV (6.4% vs. 3.3%) and either physical or sexual TDV (20.9% vs. 10.4%).
A population-based study conducted in the province of Quebec assessed TDV over the last 12 months among high school students (Pica et al., 2012). Overall, girls (35.9%) were more likely to be victims of at least one form of TDV than boys (24.8%). Girls experienced more psychological (26.6% vs. 16.9%) and sexual TDV compared to boys (14.5% vs. 5.1%). However, teenage boys (13.3%) were found more likely to report physical TDV compared to girls (11%). While this study provided relevant data on the prevalence of TDV in Quebec, it included only two questions on sexual TDV, did not evaluate threatening behaviors which may be characteristic of teenagers’ control tactics in dating relationships nor did it explore the consequences specifically associated with TDV.
Besides possible gender differences related to the prevalence of TDV, the severity and the impact of TDV including possible fear and distress following an incident is rarely analyzed (Hamby & Turner, 2013; Pica et al., 2012). One of the few studies that looked into feelings of fear found that teens who reported feeling abused and afraid in their dating relationships were more likely to have experienced humiliation and physical abuse than those who reported no feelings of fear (Ayala et al., 2014). Another study found gender differences regarding feelings of fear suggesting that girls are more likely to experience fear-inducing physical or sexual TDV (Hamby & Turner, 2013). These findings underscore the significance of considering such variables in the evaluation of TDV outcomes. Finally, the vast majority of studies have solely used dichotomous scores to contrast prevalence rates across genders (for e.g., Boivin, Lavoie, Hébert, & Gagné, 2014; Debnam, Waasdorp, & Bradshaw, 2016; Haynie et al., 2013). Yet a more nuanced picture may emerge if measures of TDV are also analyzed on a continuum using mean frequencies rather than relying on dichotomous variables.
Against this backdrop, the present study aims to fill the gaps identified in the scholarly literature by (1) documenting the prevalence as well as frequency of different forms of TDV in a representative sample of high school students in Quebec, including sexual TDV, and (2) exploring perceived impact of TDV on post-traumatic stress disorder (PTSD) symptoms, fear and feelings of upset following the worst experience of TDV, while exploring possible gender differences. This study will contribute to the literature on TDV by relying on a more exhaustive measure that assesses all forms of TDV through a gender specific lens in order to obtain a more detailed portrait of teen experiences. The reliance on a representative sample of youth in Quebec will allow for gathering more accurate and generalizable data; this represents a strength in the Canadian context, where the majority of studies on TDV have relied on convenience samples.
MethodParticipantsData for this study were drawn from the Quebec Youths’ Romantic Relationships Survey. The primary goals were to document the prevalence of dating violence, explore associated risk factors and mental health outcomes in high school adolescents ages 14 to 18. The survey was completed through a one-stage stratified cluster sampling of high schools in 2011-12. Schools were randomly selected from an eligible pool from the Quebec Ministry of Education. To obtain a representative sample of students in grades 10 through 12, schools were first classified into strata according to metropolitan geographical area, status of schools (public or private schools), teaching language (French or English) and social economic deprivation index.
Data were collected in 34 schools. Depending on the teaching language of the school, the survey was completed by students either in English or in French. A double-translation technique was used to translate English measures into French. Class response rates and the overall student response rate were determined as the ratio between the number of students that accepted to participate and the number of solicited students. Response rate was 100% for the majority (320/329) of classes; while for the remaining, the response rate ranged from 90% to 98%. The rate of partial nonresponse was less than 3.5% for the majority of variables and no additional adjustment was made for nonresponse as bias and loss of power are likely to be inconsequential (Tabachnick & Fidell, 2013). In addition, analyses of the partial nonresponse did not reveal any specific pattern. A total of 8,230 teenagers (Grades 10, 11 and 12) responded to the self-reported questionnaire. After data verification, 36 participants were excluded for invalid or completely missing data for a final sample of 8,194 participants. Participants were given a sample weight to correct biases in the non-proportionality of the schools sample compared to the target population. The weight was defined as the inverse of the probability of selecting the given grade in the respondent's stratum in the sample multiplied by the probability of selecting the same grade in the same stratum in the population. A weighted sample of 6,531 youths resulted and is used in the further analyses.
The questionnaire administered in class required approximately 40minutes to complete. Two research assistants explained the aims of the survey and assisted participants if needed. Students agreed to participate on a voluntary basis and signed a written consent form. Students were provided with a list of resources (phone help lines, websites, community organizations, health services, etc.). The institutional review board of the Université du Québec à Montréal approved this study.
InstrumentsSociodemographic information was collected on gender, age, family structure (living with two parents under the same household, living with two parents in different households (shared custody), living with one parent, other family structure arrangements), main language spoken at home (French, English or other), education level and ethnicity of parents.
Dating violence experienced in the past 12 months was assessed among youth who reported a current or past-year dating relationship. Psychological TDV (3 items), physical TDV (3 items) and threatening behavior (2 items) were assessed with items from an adapted version of the Conflict in Adolescent Dating Relationships Inventory (CADRI). Six (6) of these items were derived from a short version of the CADRI (Wekerle et al., 2009) while the two (2) remaining items were from the long version of the CADRI (Wolfe et al., 2001). Sexual TDV was measured by 9 items adapted from the Sexual Experiences Survey (SES) (Koss et al., 2007). Only acts occurring specifically during a conflict or argument with the dating partner in the last 12 months were surveyed. Response options were: Never, 1 to 2 times, 3 to 5 times, and 6 times or more.
PTSD symptoms and emotional distress following TDV were assessed by asking participants to refer to the most difficult situation they had ever experienced in the past 12 months. PTSD following TDV was measured using 6 items adapted from the Children's Impact of Traumatic Events Scale II (CITES-II) (Wolfe, 2002). Items reflected core dimensions of PTSD including reexperimentation (“I have dreams or nightmares about what happened”), avoidance (“When I’m reminded of what happened I try to think of something else”), hypervigilance (“Loud or sudden noises make me jump or feel afraid”) and distanciation (“I feel distant from other and I do not feel as interested in things I used to enjoy”). Participants indicated whether statements were “Not true”, “Sometimes true”, or “Very/Often true”. A total PTSD score ranging from 0 to 12 was computed. Internal consistency was satisfactory (α=.70).
Two (2) items were used to assess emotional distress following the most difficult situation experienced among the listed behaviors: “I was upset by what had happened to me” and “I was scared”. The first item originates from a study by Sears and Byers (2010), while the second item was designed for the present study. Responses of both items were on a three-point scale: Not true, Sometimes true and Very/Often true. Given the correlation between the two items was low (r=.40), we considered them separately in the analysis. A dichotomized score for each item was computed according to whether the participant reported the statement was sometimes or very true (1) or not (0).
Statistical methodsData analyses were conducted using STATA (StataCorp, 2011) complex survey command and Mplus (Muthén & Muthén, 2015). Prevalence rates with 95% confidence intervals (CI) and TDV chronicity in the past 12 months were computed. Prevalence rates were obtained by dichotomizing items and scale scores (0 vs. at least one occurrence). Second, we computed chronicity scores for both items and scale scores to describe the patterns of TDV recurrence. Chronicity scores indicate how often the set of acts measured by each item and scale occurred. They were obtained by computing the mean of items included in each form of TDV. As suggested by Straus, Hamby, and Warren (2003), chronicity scores were computed for those who reported an episode of victimization.
A zero-inflated regression was used to predict both the expected zero values and the counts of reported dating violence experiences. Counted scores were computed by summing the midpoint for each category, as proposed by Straus et al. (2003). Items were scored 0 (never), 1.5 (1-2 times), 4 (3-5 times) and 10 (6 times or more). Zero-inflated models, deemed more accurate in modeling violence frequency data with a preponderance of zeros (Swartout, Thompson, Koss, & Su, 2014), assume two distinct populations, that is participants who are likely to report TDV and those who are not. A logistic portion of the model aims at identifying the variables that distinguish those reporting TDV than the true-zero TDV group. The count part of the model aims at identifying variables significantly associated with TDV frequency using a Poisson or Negative Binomial regression. Choosing the best model between a zero-inflated Poisson (ZIP) and a zero-inflated Negative Binomial (ZINB) depends on the dispersion of the count data. Teens reported 0 to 30 events of psychological and physical TDV (psychological TDV: Mean=1.46, Variance=11.80; physical TDV: Mean=0.77, Variance=7.33). Threatening behaviors values ranged from 0 to 20 (Mean=0.26, Variance=2.24) and sexual TDV values ranged between 0 to 90 (Mean=1.11, Variance=25.67). Because overdispersion was observed in our data, as evidenced by variance estimates greater than the means in the TDV counted scores, we performed a ZINB model (Preisser, Stamm, Wong, & Kincade, 2012). Lower values of AIC for ZIBN compared to ZIP approaches confirmed that ZINB models provided better fit to the data. A regression model was performed for each form of TDV, including gender (being a girl coded as 1) as the independent variable and the following sociodemographics as controls: mother and father level of education, language spoken at home, family structure, parents’ ethnicity, partner's gender, age and the square of age.
Statistical analyses exploring possible gender differences in PTSD and emotional distress following TDV were also performed. When analyses were conducted on dichotomous variables (dichotomized TDV items and each form of TDV), a design-based test with Fisher statistics was used to examine differences between included variables. For continuous variables (PTSD score), linear regressions were used to examine differences between girls and boys as t-tests are not supported with the complex design command in STATA. Indeed, when considering two variables in which the dependent variable is continuous, linear regressions can be used as an alternative to t-tests.
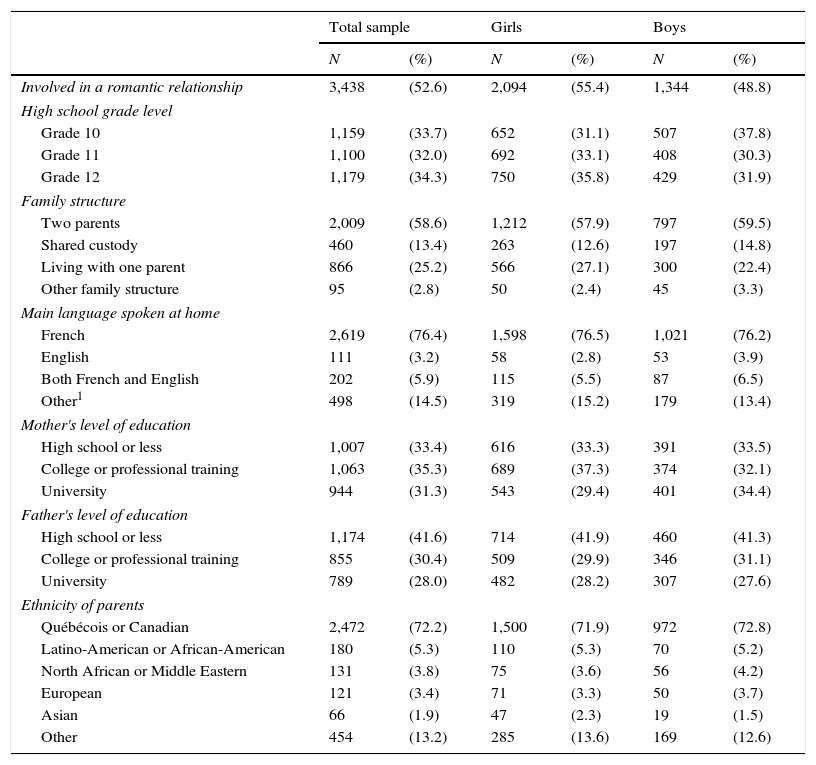
ResultsDemographicsSociodemographic characteristics of participants are presented in Table 1. The majority (76.4%) reported French as the main language spoken at home and close to half (58.6%) lived with both parents, while 38.6% lived either in single-parent families or in shared custody and 2.8% described another living arrangement. A total of 2,094 (55.4%) girls and 1,344 (48.8%) of boys reported having a dating relationship in the last 12 months. Due to missing values, sum of categories may not reach the total of participants.
Sociodemographic characteristics.
| Total sample | Girls | Boys | ||||
|---|---|---|---|---|---|---|
| N | (%) | N | (%) | N | (%) | |
| Involved in a romantic relationship | 3,438 | (52.6) | 2,094 | (55.4) | 1,344 | (48.8) |
| High school grade level | ||||||
| Grade 10 | 1,159 | (33.7) | 652 | (31.1) | 507 | (37.8) |
| Grade 11 | 1,100 | (32.0) | 692 | (33.1) | 408 | (30.3) |
| Grade 12 | 1,179 | (34.3) | 750 | (35.8) | 429 | (31.9) |
| Family structure | ||||||
| Two parents | 2,009 | (58.6) | 1,212 | (57.9) | 797 | (59.5) |
| Shared custody | 460 | (13.4) | 263 | (12.6) | 197 | (14.8) |
| Living with one parent | 866 | (25.2) | 566 | (27.1) | 300 | (22.4) |
| Other family structure | 95 | (2.8) | 50 | (2.4) | 45 | (3.3) |
| Main language spoken at home | ||||||
| French | 2,619 | (76.4) | 1,598 | (76.5) | 1,021 | (76.2) |
| English | 111 | (3.2) | 58 | (2.8) | 53 | (3.9) |
| Both French and English | 202 | (5.9) | 115 | (5.5) | 87 | (6.5) |
| Other1 | 498 | (14.5) | 319 | (15.2) | 179 | (13.4) |
| Mother's level of education | ||||||
| High school or less | 1,007 | (33.4) | 616 | (33.3) | 391 | (33.5) |
| College or professional training | 1,063 | (35.3) | 689 | (37.3) | 374 | (32.1) |
| University | 944 | (31.3) | 543 | (29.4) | 401 | (34.4) |
| Father's level of education | ||||||
| High school or less | 1,174 | (41.6) | 714 | (41.9) | 460 | (41.3) |
| College or professional training | 855 | (30.4) | 509 | (29.9) | 346 | (31.1) |
| University | 789 | (28.0) | 482 | (28.2) | 307 | (27.6) |
| Ethnicity of parents | ||||||
| Québécois or Canadian | 2,472 | (72.2) | 1,500 | (71.9) | 972 | (72.8) |
| Latino-American or African-American | 180 | (5.3) | 110 | (5.3) | 70 | (5.2) |
| North African or Middle Eastern | 131 | (3.8) | 75 | (3.6) | 56 | (4.2) |
| European | 121 | (3.4) | 71 | (3.3) | 50 | (3.7) |
| Asian | 66 | (1.9) | 47 | (2.3) | 19 | (1.5) |
| Other | 454 | (13.2) | 285 | (13.6) | 169 | (12.6) |
Note.1 Other refers to other languages and any mixture of French or English and other languages.
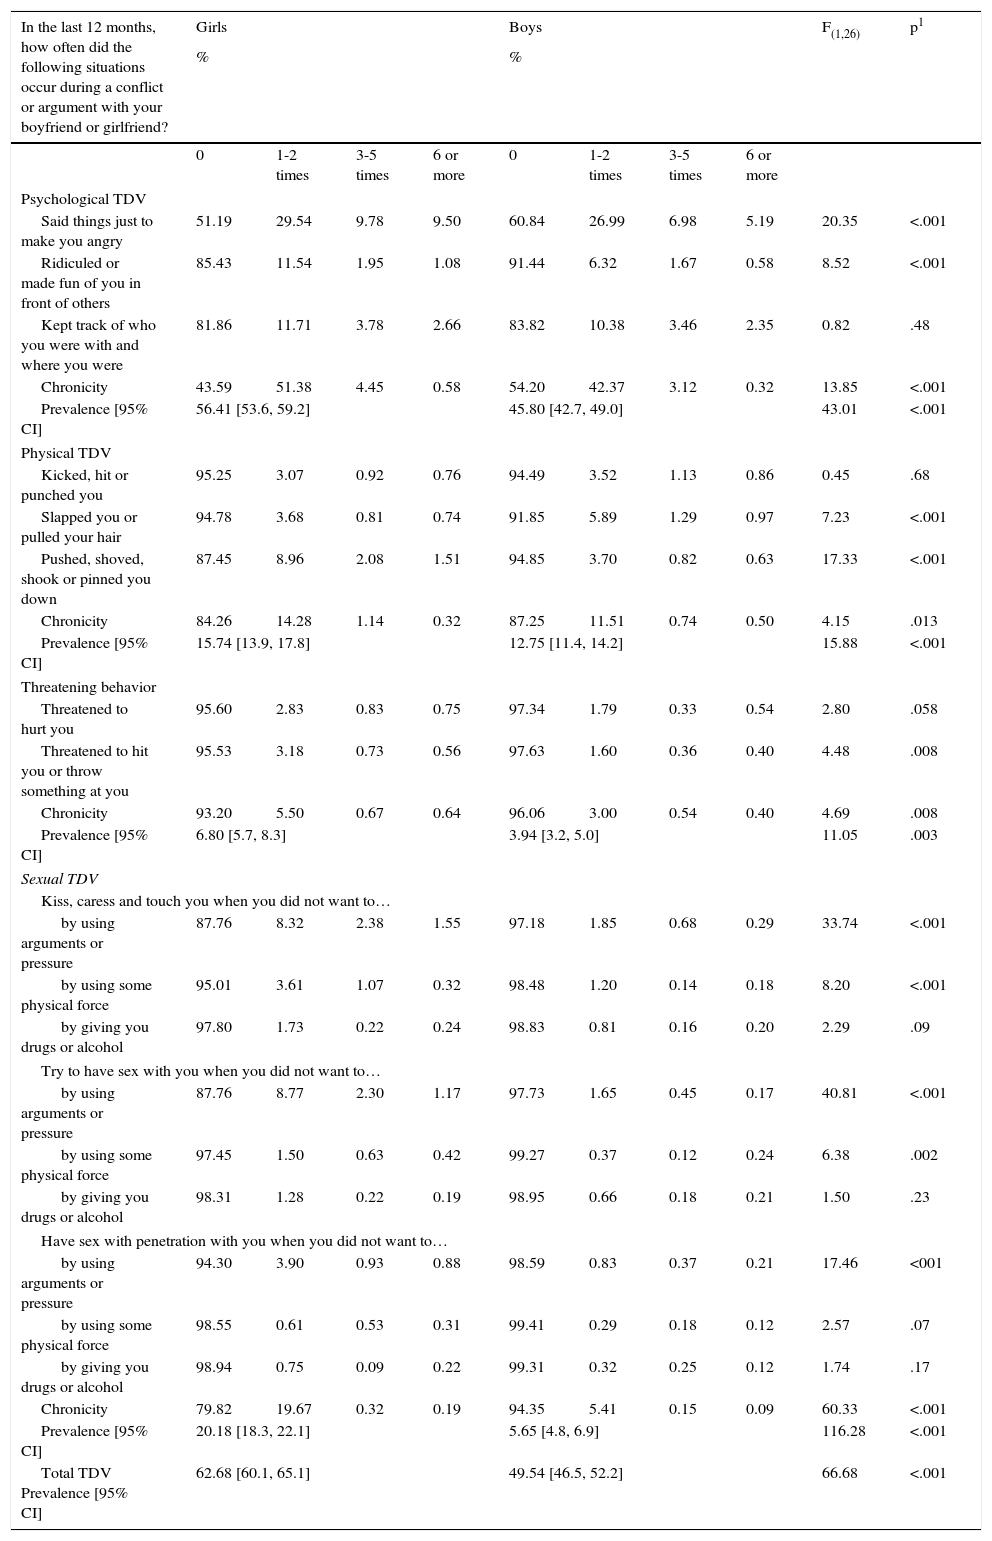
Prevalence and 95% CI of the four different forms of TDV and endorsement for each item for teenage girls and boys are reported in Table 2. Results showed statistically significant differences in prevalence rates according to gender for each form of TDV. Girls were more likely than boys to report experiencing psychological TDV (56.4% vs. 45.8%, F(1, 26)=43.01, p < .001), physical TDV (15.7% vs. 12.8%, F(1, 26) =15.88, p < .001) and threatening behaviors (6.8% vs. 3.9%, F(1, 26)=11.05, p = .003). Gender disparity was especially salient for sexual TDV, with girls nearly 3 times more likely to report being victimized by a dating partner in the last 12 months (20.2% vs. 5.7%, F(1, 26)=116.28, p < .001). The prevalence rate of girls experiencing at least one episode of any form of TDV was also significantly higher (62.7% vs. 49.5%, F(1, 26)=66.68, p < .001).Chronicity scores presented in Table 2 show that girls were more likely to report greater frequency of all forms of TDV experiences, with the only exception being that boys were more likely than girls to report 6 or more events of physical TDV. Table 2 also provides information on specific TDV items contributing to explain the gender patterns in all forms of TDV.
Prevalence and chronicity scores for each form of teen dating victimization (N = 3,438).
| In the last 12 months, how often did the following situations occur during a conflict or argument with your boyfriend or girlfriend? | Girls | Boys | F(1,26) | p1 | ||||||
|---|---|---|---|---|---|---|---|---|---|---|
| % | % | |||||||||
| 0 | 1-2 times | 3-5 times | 6 or more | 0 | 1-2 times | 3-5 times | 6 or more | |||
| Psychological TDV | ||||||||||
| Said things just to make you angry | 51.19 | 29.54 | 9.78 | 9.50 | 60.84 | 26.99 | 6.98 | 5.19 | 20.35 | <.001 |
| Ridiculed or made fun of you in front of others | 85.43 | 11.54 | 1.95 | 1.08 | 91.44 | 6.32 | 1.67 | 0.58 | 8.52 | <.001 |
| Kept track of who you were with and where you were | 81.86 | 11.71 | 3.78 | 2.66 | 83.82 | 10.38 | 3.46 | 2.35 | 0.82 | .48 |
| Chronicity | 43.59 | 51.38 | 4.45 | 0.58 | 54.20 | 42.37 | 3.12 | 0.32 | 13.85 | <.001 |
| Prevalence [95% CI] | 56.41 [53.6, 59.2] | 45.80 [42.7, 49.0] | 43.01 | <.001 | ||||||
| Physical TDV | ||||||||||
| Kicked, hit or punched you | 95.25 | 3.07 | 0.92 | 0.76 | 94.49 | 3.52 | 1.13 | 0.86 | 0.45 | .68 |
| Slapped you or pulled your hair | 94.78 | 3.68 | 0.81 | 0.74 | 91.85 | 5.89 | 1.29 | 0.97 | 7.23 | <.001 |
| Pushed, shoved, shook or pinned you down | 87.45 | 8.96 | 2.08 | 1.51 | 94.85 | 3.70 | 0.82 | 0.63 | 17.33 | <.001 |
| Chronicity | 84.26 | 14.28 | 1.14 | 0.32 | 87.25 | 11.51 | 0.74 | 0.50 | 4.15 | .013 |
| Prevalence [95% CI] | 15.74 [13.9, 17.8] | 12.75 [11.4, 14.2] | 15.88 | <.001 | ||||||
| Threatening behavior | ||||||||||
| Threatened to hurt you | 95.60 | 2.83 | 0.83 | 0.75 | 97.34 | 1.79 | 0.33 | 0.54 | 2.80 | .058 |
| Threatened to hit you or throw something at you | 95.53 | 3.18 | 0.73 | 0.56 | 97.63 | 1.60 | 0.36 | 0.40 | 4.48 | .008 |
| Chronicity | 93.20 | 5.50 | 0.67 | 0.64 | 96.06 | 3.00 | 0.54 | 0.40 | 4.69 | .008 |
| Prevalence [95% CI] | 6.80 [5.7, 8.3] | 3.94 [3.2, 5.0] | 11.05 | .003 | ||||||
| Sexual TDV | ||||||||||
| Kiss, caress and touch you when you did not want to… | ||||||||||
| by using arguments or pressure | 87.76 | 8.32 | 2.38 | 1.55 | 97.18 | 1.85 | 0.68 | 0.29 | 33.74 | <.001 |
| by using some physical force | 95.01 | 3.61 | 1.07 | 0.32 | 98.48 | 1.20 | 0.14 | 0.18 | 8.20 | <.001 |
| by giving you drugs or alcohol | 97.80 | 1.73 | 0.22 | 0.24 | 98.83 | 0.81 | 0.16 | 0.20 | 2.29 | .09 |
| Try to have sex with you when you did not want to… | ||||||||||
| by using arguments or pressure | 87.76 | 8.77 | 2.30 | 1.17 | 97.73 | 1.65 | 0.45 | 0.17 | 40.81 | <.001 |
| by using some physical force | 97.45 | 1.50 | 0.63 | 0.42 | 99.27 | 0.37 | 0.12 | 0.24 | 6.38 | .002 |
| by giving you drugs or alcohol | 98.31 | 1.28 | 0.22 | 0.19 | 98.95 | 0.66 | 0.18 | 0.21 | 1.50 | .23 |
| Have sex with penetration with you when you did not want to… | ||||||||||
| by using arguments or pressure | 94.30 | 3.90 | 0.93 | 0.88 | 98.59 | 0.83 | 0.37 | 0.21 | 17.46 | <001 |
| by using some physical force | 98.55 | 0.61 | 0.53 | 0.31 | 99.41 | 0.29 | 0.18 | 0.12 | 2.57 | .07 |
| by giving you drugs or alcohol | 98.94 | 0.75 | 0.09 | 0.22 | 99.31 | 0.32 | 0.25 | 0.12 | 1.74 | .17 |
| Chronicity | 79.82 | 19.67 | 0.32 | 0.19 | 94.35 | 5.41 | 0.15 | 0.09 | 60.33 | <.001 |
| Prevalence [95% CI] | 20.18 [18.3, 22.1] | 5.65 [4.8, 6.9] | 116.28 | <.001 | ||||||
| Total TDV Prevalence [95% CI] | 62.68 [60.1, 65.1] | 49.54 [46.5, 52.2] | 66.68 | <.001 | ||||||
Note. 1 The Pearson χ2 statistic is corrected for the survey design and converted into an F (Fisher) statistic.
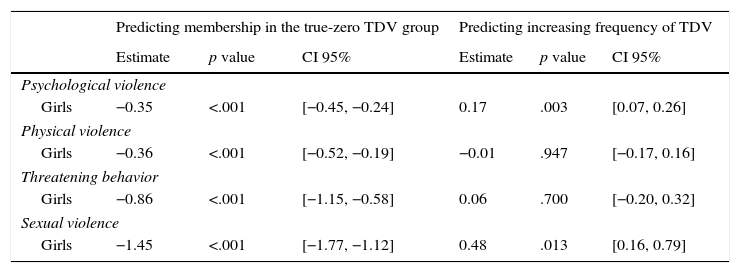
Table 3 presents the regression models estimates controlling for sociodemographic variables. Teen girls were less likely to belong to the true-zero TDV group for psychological TDV (β=-0.35, p<.001), physical TDV (β=-0.36, p<.001) sexual TDV (β=-1.45, p<.001), as well as threatening behaviors (β=-0.86, p<.001). The TDV frequency increased among girls for psychological TDV (β=0.17, p=.003) and sexual TDV (β=0.48, p=.013), while gender did not discriminate frequency of physical TDV (β=-0.01, p=.947) and threatening behavior (β=0.06, p=.700).
ZINB models estimates.
| Predicting membership in the true-zero TDV group | Predicting increasing frequency of TDV | |||||
|---|---|---|---|---|---|---|
| Estimate | p value | CI 95% | Estimate | p value | CI 95% | |
| Psychological violence | ||||||
| Girls | −0.35 | <.001 | [−0.45, −0.24] | 0.17 | .003 | [0.07, 0.26] |
| Physical violence | ||||||
| Girls | −0.36 | <.001 | [−0.52, −0.19] | −0.01 | .947 | [−0.17, 0.16] |
| Threatening behavior | ||||||
| Girls | −0.86 | <.001 | [−1.15, −0.58] | 0.06 | .700 | [−0.20, 0.32] |
| Sexual violence | ||||||
| Girls | −1.45 | <.001 | [−1.77, −1.12] | 0.48 | .013 | [0.16, 0.79] |
Note. Estimates adjusted for the following control variables: partner's gender, mother and father level of education, language spoken at home, family structure and parents’ ethnicity.
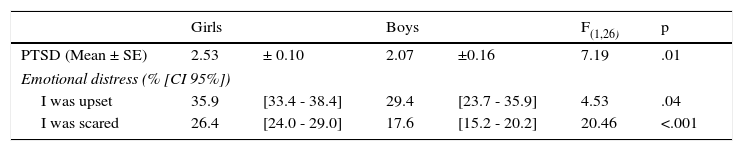
Results on PTSD symptoms and emotional distress associated with the most difficult episode of TDV experienced in the past 12 months are presented in Table 4. Analyses revealed a significant effect for gender, t(26)=2.7, p = .01, with girls (M=2.5, SE=0.1) reporting higher scores of PTSD symptoms associated with TDV than boys (M=2.1, SE=0.16). The percentages of teenagers endorsing “being upset” and “being scared” were respectively 33.8% and 23.5% among participants, with girls endorsing significantly higher prevalence for both items of emotional distress following the most difficult episode of TDV.
DiscussionOur study aimed to document the prevalence of TDV in a representative sample of high school students while considering different forms of victimization (psychological, physical and sexual violence, and threatening behaviors) and to explore feelings of fear, distress and PTSD symptoms associated to the most difficult episode experienced in the past 12 months. Our results reveal that close to 1 out of two teenagers has experienced at least one episode of TDV in the last 12 months. Prevalence estimates are higher for teenage girls compared to boys on all forms of TDV considered, with the largest discrepancy (20.2% vs. 5.7%) present for sexual victimization. As in previous studies of TDV (for a review, see Leen et al., 2013), psychological violence is the most prevalent form of victimization with about half of teenagers reporting at least one episode in the past year.
Comparing prevalence rates across studies remains hazardous since differences in measures and samples can impact prevalence estimates (Wincentak, Connolly, & Card, 2017). In addition, assessing a wider range of behaviors with a more comprehensive set of indicators may offer the opportunity for greater endorsement of items and consequently higher prevalence rates. For instance, our prevalence of sexual TDV centers at 20.2% for girls, which is higher than the 2013 National Youth Risk Behavior Survey in which 8% of girls reported only sexual TDV and 6.4% reported both sexual and physical TDV with only one question.
It is rather disconcerting to find that 1 out of 5 teenage girls report some form of sexual coercion in their early romantic relationships. A closer look into the tactics employed by the dating partner suggests that the use of pressure or arguments as well as physical force are present in the majority of the experiences reported. This rate is somewhat higher than the overall prevalence reported in a meta-analytic review of 31 studies assessing sexual TDV (Wincentak, Connolly, & Card, 2017), which was of 14% among girls. A potential explanation for this variation is that a detailed measure of dating victimization was used in the present study and, therefore, was able to detect a broader range of sexual violence experiences. Coercion tactics involving the use of alcohol or drugs by the dating partner are reported by a minority of teenagers (< 2%) with no gender differences found.
Our study also sought to assess threatening behaviors, which has rarely been evaluated distinctively by other studies. Some authors combined threatening behaviors with psychological violence (Halpern, Oslak, Young, Martin, & Kupper, 2001), while others considered threatening behaviors with use of a weapon as part of physical violence (Wolitzky-Taylor et al., 2008). Yet, there is some indication that both forms of TDV are only modestly correlated, sharing only 36% of the variance (Jouriles, McDonald, Garrido, Rosenfield, & Brown, 2005).
Another contribution of the present study was to analyze both occurrence and frequency of TDV. For all forms of TDV, girls are less likely to report no occurrence of TDV compared to boys. Such results confirm the robustness of gender difference in TDV prevalence scores even when controlling for sociodemographic variables. Yet, the ZINB models confirm the association of gender with chronicity for psychological and sexual TDV (girls reporting greater frequency of TDV events), even when controlling for sociodemographics. However, the greater chronicity observed among girls for physical TDV and threatening behaviors in bivariate statistics was not confirmed in the multivariable models controlling for sociodemographic variables.
While several studies have highlighted that youth victims of TDV are likely to display a number of negative outcomes (higher psychological distress, lower self-esteem, etc.), scholars have rarely addressed issues of perceived emotional distress or symptoms directly linked to TDV victimization experiences. When referring to the worst experience of TDV, important gender differences emerged in the present study. Girls report more PTSD symptoms, greater fear and upset compared to boys. Teen boys also report symptoms of reexperimentation, avoidance, hypervigilance and detachment–core dimensions of PTSD–as well as feelings of being afraid or upset following TDV, albeit to a lesser degree than teenage girls. Girls may be more likely to develop PTSD as they experience more frequent episodes of TDV than boys. Girls are also more likely to sustain sexual coercion, which is more likely to be associated with negative outcomes including PTSD (Vagi et al., 2015).
Several limitations of the study need to be noted. Our data are only generalizable to students who attend high schools and TDV prevalence estimates may in fact be higher among more vulnerable populations, such as high school drop-outs. Our evaluation of TDV did not include cybervictimization, an emerging phenomenon that may take on many forms including cyber-stalking or sexual blackmail and may involve a former dating partner (Zweig, Lachman, Yahner & Dank, 2014). In addition, the in-class survey did not allow for a more extensive follow-up on reported TDV incidents, which could have shed light on the context of the acts experienced. Issues relating to the measurement of intimate violence are numerous (Hamby, 2016) and future studies relying on diverse methodologies (in-depth interviews, dyadic reports, etc.) and on model testing of gender differences (Caldwell, Swan, & Woodbrown, 2012) clearly appear warranted to gain a more comprehensive understanding of TDV. Despite these limitations, the present study contributes to the literature by providing prevalence estimates of TDV with a representative sample of high school students, and providing a more comprehensive assessment of different forms of TDV, including sexual violence which is rarely addressed in TDV research. Moreover, analyzing both the presence/absence of TDV and the frequency of TDV when it occurs offers insights that can inform prevention efforts. In addition, our data helped to gather a clearer understanding of the gender disparity in victimization in the context of early romantic relationships in terms of perceived impact.
Our results underscore that TDV is unfortunately common and that teenage girls are more likely to report experiencing all forms of TDV. Taken together, the different proxies of severity considered (fear, feelings of distress and PTSD symptoms) also underscore that teenage girls are more vulnerable to sustaining continuous and more pervasive forms of TDV than boys.
TDV remains an important issue that undermines youths’ early romantic relationships and can potentially set the stage for later intimate relationships. Thus, programs aiming to prevent TDV and to promote the development of healthy relationships are clearly justified. In addition, school counsellors and other professionals involved with teenagers may play a crucial role in identifying and offering support to youth confronted with this issue. A better documentation of the gender specificity in the experiences of TDV may offer relevant cues for the design of intervention services for youth.
Funding and acknowledgmentsThis research was supported by a grant (# 103944) from the Canadian Institutes of Health Research (CIHR) awarded to the first author. The authors wish to thank the teenagers and the school personnel that participated in the Youths’ Romantic Relationships Survey. Our thanks are also extended to Catherine Moreau for project coordination, and to Mireille Guerrier for consultation on statistical analyses.
