


Background/Objective: The most common used instrument to measure optimism, both in psychological and medical research, is the Life Orientation Test- Revised (LOT-R). A multi-countries study using the future item from the LOT-R, found that level of optimism varied between countries. The provision of population-based norms is necessary, since norms enable the application of the LOT-R in individual diagnosis to compare individuals or special patient groups’ scores with reference data. Method: A representative population based survey was conducted in 2014-2015. Norwegian aged 18–94 years (N=1,792) completed questionnaires assessing sociodemographic, optimism and health and quality of life. Results: The mean age was 53.2 (SD=16.6) and 53% were women. Mean LOT-R score was 17.2 (SD 3.0). There were marginal age and no gender differences. Although optimism was associated with sociodemographic variables, these were considered negligible due to small effect size. Norm data are given for the entire population. Optimism was associated with better health and quality of life. Conclusions: This study provides age and gender specific norm values from a representative sample of the Norwegian population. The normative data may be used in comparisons of optimism between individuals or between different samples of patients or sub-groups of people.
Antecedentes/Objetivo: El instrumento más comúnmente utilizado para medir el optimismo, tanto en la investigación psicológica como en la médica, es el Test de Orientación Vital Revisado (LOT-R). Disponer de normas poblacionales es necesario, ya que permiten comparar los puntajes de individuos o grupos con los datos de referencia. Método: En 2014-2015 se llevó a cabo un estudio poblacional. Noruegos de entre 18 y 94 años (N=1.792) cumplimentaron cuestionarios que evaluaban variables sociodemográficas, optimismo disposicional, salud y calidad de vida. Resultados: La edad media fue de 53,2 (DT=16,6) y el 53% fueron mujeres. La puntuación media del LOT-R fue de 17,2 (DT=3). Se encontraron diferencias marginales en la edad y no hubo diferencias de género. Aunque el optimismo se asoció con variables sociodemográficas, esta asociación no se consideró significativa debido a los pequeños tamaños del efecto, por lo que los datos normativos se refieren a la población general. El optimismo se asoció con mejor salud y calidad de vida. Conclusión: Este estudio proporciona valores normativos específicos en función de edad y sexo a partir de una muestra representativa de la población noruega.
The personality dimension optimism versus pessimism has roots in expectancy-incentive motive theories as well as in folk wisdom. Optimism is considered a psychological resource, widely supported by research indicating associations with improved well-being and physical health (Carver & Scheier, 2014). Optimism has been shown to be a useful predictor for less anxiety and depression in cancer patients (Lam et al., 2016; Orom, Nelson, Underwood, Homish, & Kapoor, 2015; Schou, Ekeberg, Ruland, Sandvik, & Kåresen, 2004; Zenger, Glaesmer, Höckel, & Hinz, 2011) and better sleep quality in healthy community members (Uchino et al., 2016) as well as mitigating the adverse impact of terrorism on mental health and well-being in survivors of a terror attack (Birkeland, Blix, Solberg, & Heir, 2016). Optimism has also been linked to lower levels of inflammation (Roy et al., 2010), better antioxidant levels (Boehm, Williams, Rimm, Ryff, & Kubzansky, 2013a), better lipid profiles (Boehm, Williams, Rimm, Ryff, & Kubzansky, 2013b), lower level of cortisol responses under stress (Jobin, Wrosch, & Scheir, 2013) and stronger immune responses (Kohut, Cooper, Nickolaus, Russell, & Cunnick, 2002; Szondy, 2004). Optimism is associated with better adjustment to pain (Ronaldson et al., 2014) and less pain sensitivity (Hanssen, Peters, Vlaeyen, & Meevissen, 2013). Furthermore, optimism has been associated with reduced risk of coronary heart disease (Kim, Smith, & Kubzansky, 2014), lower mortality (Boehm & Kubzansky, 2012; Kim et al., 2017; Tindle et al., 2009) and with a lower risk of suicidal ideation (Huffmann et al., 2016).
One of the most common used instruments to measure optimism, both in psychological and medical research, is the Life Orientation Test (LOT) and the revised version (LOT-R). The LOT was developed by Scheier & Carver (1985). The original items of the LOT did not all focus as explicitly on expectations for the future as theory dictated. In addition it was claimed that the effects attributed to optimism were indistinguishable from neuroticism. Due to the criticism a revised version of the Life Orientation Test (LOT-R) was developed in 1994. In this version, the two items which related to measuring the personality variable neuroticism were removed. The items included in the LOT-R measure positive and negative expectations strongly linked to the future and are worded in a way so that they are evaluated across all situation and domains (Scheier, Carver, & Bridges, 1994). Studies have also shown that optimism and neuroticism are not interchangeable (Mroczek, Spiro, Aldwin, Ozer, & Bosse, 1993; Scheier et al., 1994). The items in the LOT-R have been found to be able to distinguish people with different levels of optimism and adequately covered the spectrum of the latent trait (Chiesi, Galli, Primi, Borgi, & Bonacchi, 2013; Steca, Monzani, Creco, Chiesi, & Primi, 2015). These findings were based on item response theory analyses that provided evidence of the accuracy of the LOT-R. Slight age and gender differences have been noted in previous studies. Older age groups reported less optimism than younger ones (Glaesmer et al., 2012; Hinz et al., 2017; Zenger et al., 2013). Males were slightly less optimistic than females (Glaesmer et al., 2012; Hinz et al., 2017), or slightly more optimistic than females (Zenger et al., 2013). However, the effect sizes for all these differences were low (d<.20). Steca et al. (2015) assessed the equivalence of the LOT-R items across gender and age; they concluded that the LOT-R appears to be gender and age invariant.
Nearly all research on the LOT-R has been conducted on specific samples, like undergraduate students, college-educated, cancer patients, women or selected age groups. Very few general population-based studies have been conducted. Only three studies; one from Germany, one from Latin America (Colombia) and one from United Kingdom (Glasgow, Liverpool, and Manchester), were identified that report norm values for the LOT-R (Glaesmer et al., 2012; Walsh et al., 2015; Zenger et al., 2013). Thus, reliable information about the influence of gender and education on dispositional optimism is sparse. A recent study addressed the issue whether optimism is universal or that it merely reflects western ideals, or benefit of living in a developed country (Gallagher, Lopez, & Pressman, 2013). Gallagher et al. (2013) used only one item of the LOT-R scale (the future item) to measure optimism in 142 countries. They concluded that most individuals and most countries worldwide are optimistic, and that on average, people who are young, female or highly educated are the most optimistic individuals worldwide. However, the levels of optimism did vary from country to country. Thus, there is a need for more population-based studies from different countries. The provision of population-based norms is necessary, since norms enable the application of the LOT-R in individual diagnosis to compare individuals or special patient groups’ scores with reference data.
The primary aim of the present study was to estimate the level and distribution of optimism in the general population in Norway, providing population-based norms for the LOT-R. Secondly, we wanted to examine whether gender, age and sociodemographic characteristics such as marital status, living with family, living in a city, employment and level of education, were related to optimism. Thirdly, we aimed to investigate the strength of the associations between optimism and self-reported quality of life and health.
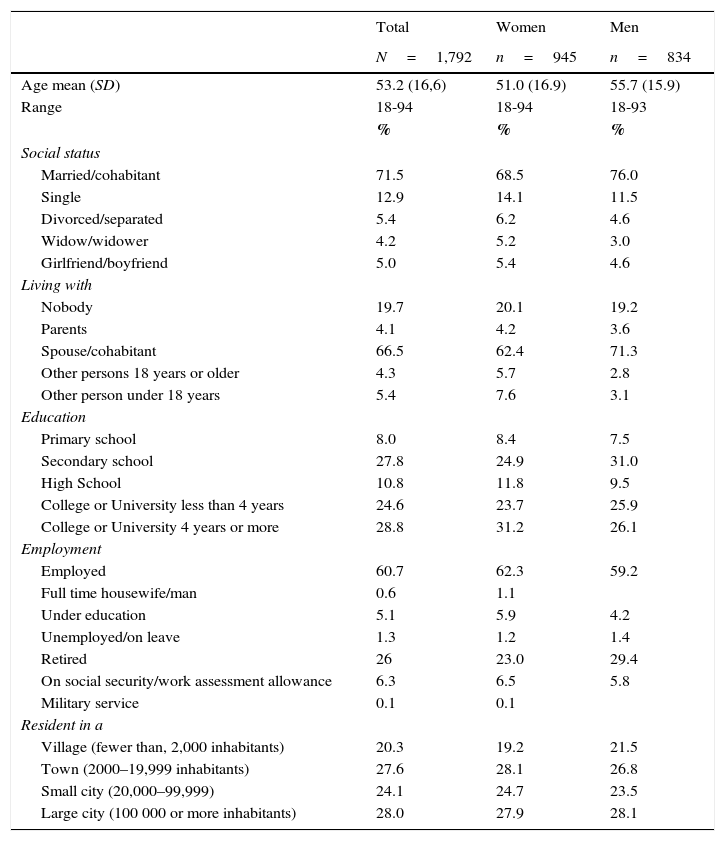
MethodParticipantsThe Norwegian Population Study (NorPop) was designed to gather data for a wide variety of health conditions and provide norm data for many questionnaires (e.g. The LOT-R) used for assessments of symptoms, attitudes and behavior. A representative sample of the Norwegian general population was selected with the assistance of the National Population Register, representative of the entire Norwegian population. Norway is divided into 19 countries. Data collection took place in each of these countries. Persons fulfilling the inclusion criteria (age at or above 18 and registered as a Norwegian citizen) were randomly selected, stratified by age, gender and geographic regions. Due to randomness, the selection included persons dwelling in both urban and rural communities, minimizing biases due to socioeconomic and cultural influences. The data collection took place in 2014–2015. Of the 5,500, nine persons had died, 21 could not fill out the questionnaire because of co-morbidity or old age, 499 envelopes were returned because the address was not valid. Thus the eligible sample consisted of 4,971 individuals. Of these 1,792 subjects (36%) completed the questionnaires Sociodemographic characteristics of the sample are shown in Table 1.
Socio-demographic characteristics of the sample (N=1,792).
| Total | Women | Men | |
|---|---|---|---|
| N=1,792 | n=945 | n=834 | |
| Age mean (SD) | 53.2 (16,6) | 51.0 (16.9) | 55.7 (15.9) |
| Range | 18-94 | 18-94 | 18-93 |
| % | % | % | |
| Social status | |||
| Married/cohabitant | 71.5 | 68.5 | 76.0 |
| Single | 12.9 | 14.1 | 11.5 |
| Divorced/separated | 5.4 | 6.2 | 4.6 |
| Widow/widower | 4.2 | 5.2 | 3.0 |
| Girlfriend/boyfriend | 5.0 | 5.4 | 4.6 |
| Living with | |||
| Nobody | 19.7 | 20.1 | 19.2 |
| Parents | 4.1 | 4.2 | 3.6 |
| Spouse/cohabitant | 66.5 | 62.4 | 71.3 |
| Other persons 18 years or older | 4.3 | 5.7 | 2.8 |
| Other person under 18 years | 5.4 | 7.6 | 3.1 |
| Education | |||
| Primary school | 8.0 | 8.4 | 7.5 |
| Secondary school | 27.8 | 24.9 | 31.0 |
| High School | 10.8 | 11.8 | 9.5 |
| College or University less than 4 years | 24.6 | 23.7 | 25.9 |
| College or University 4 years or more | 28.8 | 31.2 | 26.1 |
| Employment | |||
| Employed | 60.7 | 62.3 | 59.2 |
| Full time housewife/man | 0.6 | 1.1 | |
| Under education | 5.1 | 5.9 | 4.2 |
| Unemployed/on leave | 1.3 | 1.2 | 1.4 |
| Retired | 26 | 23.0 | 29.4 |
| On social security/work assessment allowance | 6.3 | 6.5 | 5.8 |
| Military service | 0.1 | 0.1 | |
| Resident in a | |||
| Village (fewer than, 2,000 inhabitants) | 20.3 | 19.2 | 21.5 |
| Town (2000–19,999 inhabitants) | 27.6 | 28.1 | 26.8 |
| Small city (20,000–99,999) | 24.1 | 24.7 | 23.5 |
| Large city (100 000 or more inhabitants) | 28.0 | 27.9 | 28.1 |
Note. Missing ranged from 0.5% to 4.7% on the sociodemographic characteristics.
The Life Orientation Test - Revised (LOT-R) was used to measure dispositional optimism (Scheier et al., 1994). It is a 10-item self-report measure; four of the items are filler items that are included to disguise (somewhat) the underlying purpose of the test. Of the six scored items, three are phrased in an optimistic and three in a pessimistic direction. Each item was constructed to read in such a way that it did not imply any specific basis for the expectation; that is, whether the reason behind the particular expectation resided in the person, the environment, or luck and change factors. The respondents indicated the extent to which they agreed with each of the items on a 5-point scale from 0 (strongly disagree) to 4 (strongly agree). The time frame used was the present. The total score was calculated by adding the optimism raw scores and the inverted pessimism raw scores. Scores range from zero to 24; higher scores indicate greater optimism and lower scores indicate lower optimism, often referred to as pessimism. The LOT-R was translated into Norwegian using the multiple forward and backward translation technique recommended by Guillemin, Bombardier, and Beaton (1993), and Schou, Ekeberg, Ruland, and Sandvik (2005).
There is an ongoing debate regarding the dimensionality of the LOT-R. However, using the LOT-R as a two-factor scale goes against the original authors’ theoretical definition of the scale, which was described as a continuum in which pessimism and optimism are viewed as polar opposites and not as separate dimensions. In a recent review, the original authors continued to recommend that the LOT-R be used as a unidimensional scale in primary analyses (Carver, Scheier, & Segerstrom, 2010). Furthermore, recent studies have given strong support to the one-dimensionality of the LOT-R, and demonstrated that the bi-factorial structure is an artifact of item wording (Cano-Garcia et al., 2015; Monzani, Steca, & Greco, 2014; Steca et al., 2015). Thus, in the present study, the LOT-R is primarily used as a unidimensional scale. However, we did analyzed optimism and pessimism separately. The scores for the Optimism and Pessimism subscales were calculated by summing up the corresponding three items, resulting in a score range of zero to 12. On a numeric scale from 0 (very poor) to 10 (very good), subject were asked to rate their general state of health and quality of life the last week (two items).
ProcedureAll subjects received written information with regard to the study, an invitation to participate, a comprehensive questionnaire and a pre-stamped envelope by mail. A first attempt was made to invite 5,500 persons. A maximum of three attempts was made to contact the selected persons. The postal survey was carried out anonymously and at request the Regional Committee for Medical and Health Research Ethics required no further formal ethical approval. The principles for conducting research contained in the Declaration of Helsinki were respected.
Statistical analysesData are presented as means with Standard deviation (SD) or percentage. The two-factorial ANOVA was conducted to explore the relationship between gender and age and the levels of optimism, as measured by the LOT-R and to explore if there was an interaction between age and gender. The percentile rank scores were calculated according to Ley (1972). Subjects were divided into six groups according to age (Group 1: 18–30 years, Group 2: 31–40 years, Group 3: 41–50 years, Group 4: 51–60 years, Group 5: 61–70 years, Group 6: 71 years and above). Subjects were divided into three groups according to working status: Group 1 (employed, full time house wife/man, under education, military service), Group 2 not working (unemployed, on social security/work assessment allowance) and Group 3 retired. Student's t-tests were used to compare normally distributed variables. Effect sizes (Cohen's d) for comparison between two mean scores were calculated according to Cohen (1992) using Ellis (2009) “Effect size calculators”. In order to facilitate the comparison with the results of the German and Spanish versions of the LOT-R, the calculation and the presentation of results mainly follow the papers of Glaesmer et al. (2012) and Zenger et al. (2013). All the statistical analyses (except Cohen's d) were conducted using IBM SPSS version 24. The significance level was set to p≤.05. Effect sizes were defined as low, medium and large according to Cohen (1992), i.e. 0.20, 0.50 and 0.80 respectively.
ResultsOf the 1,792 responders 53.1% were women, mean age 51.0 (SD 16.9) and 46.9% were men, mean age 55.7 (SD 15.9). There was 0.3% who did not report their gender, 0.4% who did not report their age and 0.6% who had not filled out the LOT-R. The respondents were fairly evenly distributed with regard to where they were residing, as shown in Table 1. There were no significant differences in mean age or gender proportions between responders and non-responders. However, non-responders were younger (mean age 49.2 years, SD 17.3) and included more men (52.9%).
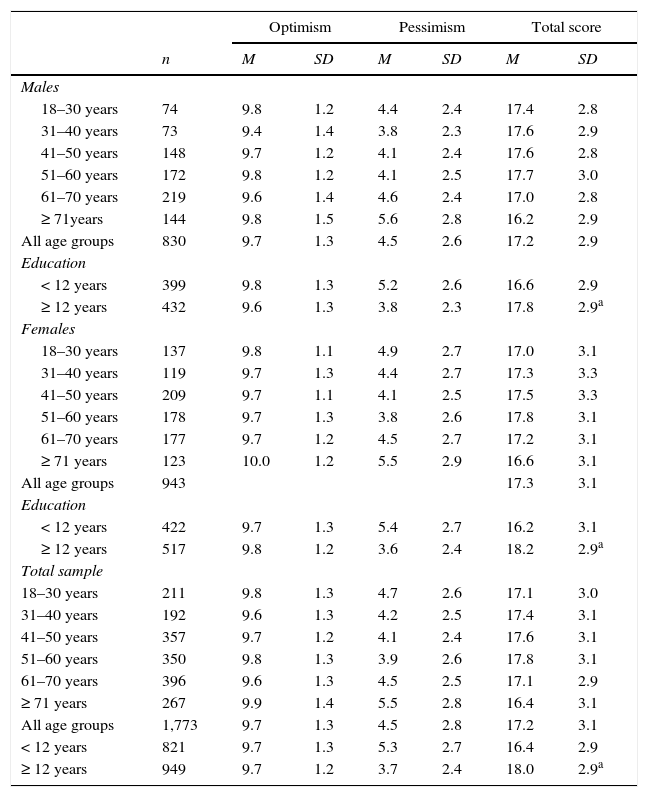
The mean LOT-R score was 17.2 (SD 3.1). There were no statistically significant difference in the mean LOT-R scores between the early responders scores (mean 17.2, SD 3.0), first reminders scores (mean 17.2, SD 3.1) or second reminders scores (mean 17.2, SD 3.2). Likewise, no statistically significant difference was found in the mean age between the early responders (53.3 years (SD 16.4), first reminders (53.1 years (SD 16.4) and second reminders (52.9 years (SD 17.8). The separate mean scores for the subscale optimism (s-optimism) was 9.7 (SD 1.3) and subscale pessimism (s-pessimism) 4.5 (SD 2.8) (Table 2).
LOT-R mean scores, stratified by age group, gender and education.
| Optimism | Pessimism | Total score | |||||
|---|---|---|---|---|---|---|---|
| n | M | SD | M | SD | M | SD | |
| Males | |||||||
| 18–30 years | 74 | 9.8 | 1.2 | 4.4 | 2.4 | 17.4 | 2.8 |
| 31–40 years | 73 | 9.4 | 1.4 | 3.8 | 2.3 | 17.6 | 2.9 |
| 41–50 years | 148 | 9.7 | 1.2 | 4.1 | 2.4 | 17.6 | 2.8 |
| 51–60 years | 172 | 9.8 | 1.2 | 4.1 | 2.5 | 17.7 | 3.0 |
| 61–70 years | 219 | 9.6 | 1.4 | 4.6 | 2.4 | 17.0 | 2.8 |
| ≥ 71years | 144 | 9.8 | 1.5 | 5.6 | 2.8 | 16.2 | 2.9 |
| All age groups | 830 | 9.7 | 1.3 | 4.5 | 2.6 | 17.2 | 2.9 |
| Education | |||||||
| < 12 years | 399 | 9.8 | 1.3 | 5.2 | 2.6 | 16.6 | 2.9 |
| ≥ 12 years | 432 | 9.6 | 1.3 | 3.8 | 2.3 | 17.8 | 2.9a |
| Females | |||||||
| 18–30 years | 137 | 9.8 | 1.1 | 4.9 | 2.7 | 17.0 | 3.1 |
| 31–40 years | 119 | 9.7 | 1.3 | 4.4 | 2.7 | 17.3 | 3.3 |
| 41–50 years | 209 | 9.7 | 1.1 | 4.1 | 2.5 | 17.5 | 3.3 |
| 51–60 years | 178 | 9.7 | 1.3 | 3.8 | 2.6 | 17.8 | 3.1 |
| 61–70 years | 177 | 9.7 | 1.2 | 4.5 | 2.7 | 17.2 | 3.1 |
| ≥ 71 years | 123 | 10.0 | 1.2 | 5.5 | 2.9 | 16.6 | 3.1 |
| All age groups | 943 | 17.3 | 3.1 | ||||
| Education | |||||||
| < 12 years | 422 | 9.7 | 1.3 | 5.4 | 2.7 | 16.2 | 3.1 |
| ≥ 12 years | 517 | 9.8 | 1.2 | 3.6 | 2.4 | 18.2 | 2.9a |
| Total sample | |||||||
| 18–30 years | 211 | 9.8 | 1.3 | 4.7 | 2.6 | 17.1 | 3.0 |
| 31–40 years | 192 | 9.6 | 1.3 | 4.2 | 2.5 | 17.4 | 3.1 |
| 41–50 years | 357 | 9.7 | 1.2 | 4.1 | 2.4 | 17.6 | 3.1 |
| 51–60 years | 350 | 9.8 | 1.3 | 3.9 | 2.6 | 17.8 | 3.1 |
| 61–70 years | 396 | 9.6 | 1.3 | 4.5 | 2.5 | 17.1 | 2.9 |
| ≥ 71 years | 267 | 9.9 | 1.4 | 5.5 | 2.8 | 16.4 | 3.1 |
| All age groups | 1,773 | 9.7 | 1.3 | 4.5 | 2.8 | 17.2 | 3.1 |
| < 12 years | 821 | 9.7 | 1.3 | 5.3 | 2.7 | 16.4 | 2.9 |
| ≥ 12 years | 949 | 9.7 | 1.2 | 3.7 | 2.4 | 18.0 | 2.9a |
Note.
The mean for the LOT-R for the whole population was 17.2 (SD 3.1). The mean scores for the LOT-R, and the total score, stratified by age, gender and education are presented in Table 2. No significant difference was found in the LOT-R scores when comparing all men (mean 17.2) and all women (mean 17.3).
There was a statistically significant main effect for age, F (5, 1756)=7.98, p<.001; however the effect size was small (partial eta squared=.022). Post-hoc comparison using the Tukey HSD test indicated that the mean score for the age group ≥ 71 year (16.4) was significantly different from all the other age groups. However, even the age group (51–60 years) with the greatest difference in mean scores (17.8) from the age group ≥ 71 year, the effect size was small, d=.33. No linear age trend was found. There was no main effect for gender and there was no significant interaction between gender and age groups.
Subjects with ≥ 12 years of education (n=949) were significantly more optimistic than those with less education (n=821), 18.0 and 16.4, respectively, p<.001, effect size d=0 .56. This was true for both genders. Women who reported higher education (≥ 12 years) scored significantly higher on the LOT-R than those with lower educational level, 18.2 vs. 16.2, p<.001. The same applied for men, 17.8 vs 16.6, p<.001.
Dispositional optimism according to marital status, living with family, living in city and employment statusIndividuals who were married or had a boyfriend/girlfriend (n=1,368) were significantly more optimistic than those who were alone (n=413), 17.4 and 16.7 respectively, p<.001, d=0.23. This was true for both genders.
Men who lived with another person (n=597) were significantly more optimistic than men who lived alone (n=140), 17.3 and 16.6 respectively, p=.02, d=0.13. No significant difference in optimism was found between women who lived with another person and women who lived alone, 17.3 and 17.2 respectively
Individuals living in a city (n=918) were significantly more optimistic than those who lived in a village or town (n=863), 17.6 and 16.9 respectively, p<.001, d=0.22. This was true for both genders.
Individuals who were working (n=1,178) were significantly more optimistic than individuals who were not working (n=134), 17.6 and 16.3, p=<.001, d=0.38 respectively, and individuals who were retired (n=458), 17.6 and 16.6 respectively, p<.001, p=< .001, d=0.34. This was true for both genders.
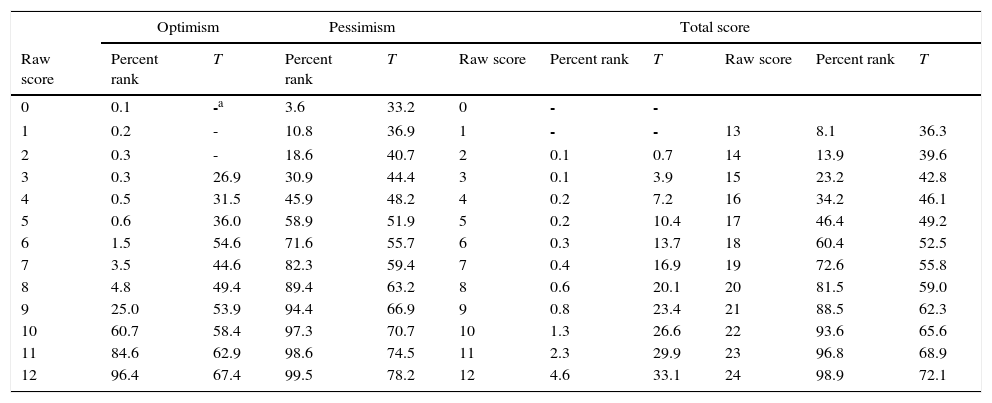
Population-based norms for the LOT-RAlthough some difference was found for age, these were marginal and therefore we calculated norms based on the total sample. To compare an individual's score with scores from the general population reference group, standardized T-scores from Table 3 can be used. Per definition, the mean value of the T-score is 50, and the standard deviation is 10. The percent rank scores were calculated for the whole sample.
Percent rank scores and T-values for the LOT-R.
| Optimism | Pessimism | Total score | ||||||||
|---|---|---|---|---|---|---|---|---|---|---|
| Raw score | Percent rank | T | Percent rank | T | Raw score | Percent rank | T | Raw score | Percent rank | T |
| 0 | 0.1 | -a | 3.6 | 33.2 | 0 | - | - | |||
| 1 | 0.2 | - | 10.8 | 36.9 | 1 | - | - | 13 | 8.1 | 36.3 |
| 2 | 0.3 | - | 18.6 | 40.7 | 2 | 0.1 | 0.7 | 14 | 13.9 | 39.6 |
| 3 | 0.3 | 26.9 | 30.9 | 44.4 | 3 | 0.1 | 3.9 | 15 | 23.2 | 42.8 |
| 4 | 0.5 | 31.5 | 45.9 | 48.2 | 4 | 0.2 | 7.2 | 16 | 34.2 | 46.1 |
| 5 | 0.6 | 36.0 | 58.9 | 51.9 | 5 | 0.2 | 10.4 | 17 | 46.4 | 49.2 |
| 6 | 1.5 | 54.6 | 71.6 | 55.7 | 6 | 0.3 | 13.7 | 18 | 60.4 | 52.5 |
| 7 | 3.5 | 44.6 | 82.3 | 59.4 | 7 | 0.4 | 16.9 | 19 | 72.6 | 55.8 |
| 8 | 4.8 | 49.4 | 89.4 | 63.2 | 8 | 0.6 | 20.1 | 20 | 81.5 | 59.0 |
| 9 | 25.0 | 53.9 | 94.4 | 66.9 | 9 | 0.8 | 23.4 | 21 | 88.5 | 62.3 |
| 10 | 60.7 | 58.4 | 97.3 | 70.7 | 10 | 1.3 | 26.6 | 22 | 93.6 | 65.6 |
| 11 | 84.6 | 62.9 | 98.6 | 74.5 | 11 | 2.3 | 29.9 | 23 | 96.8 | 68.9 |
| 12 | 96.4 | 67.4 | 99.5 | 78.2 | 12 | 4.6 | 33.1 | 24 | 98.9 | 72.1 |
Note.
The reliability coefficients were for the total LOT-R scale: alpha=.75; subscale Pessimism (S-Pessimism): alpha=.77, and subscale Optimism (S-Optimism): alpha=.84. The correlation between S-optimism and S-Pessimism for the total sample was r=-.18, p<.001. The correlations to the total score were r=.74 (S-Optimism) and r=-.75 (S-Pessimism). Standardized T-scores and percentile rank scores for the subscales are presented in Table 3.
Correlations with health and quality of life variables (QoL)The total LOT-R scores were positively correlated with individual's self-reported health r=. 29, and QoL r=.41. S-optimism was correlated with health r=.26 and QoL r=.36. S-pessimism was correlated with health r=-.20 and QoL r=-.27. All correlations were significant with p>.001.
DiscussionThe LOT-R was administrated to a representative population-based sample of 1,792 residents in Norway, across all age groups from ≥ 18 years and all counties. In consistence with Zenger et al. (2013) we found no difference between the LOT-scores of men and women. Glaesmer et al. (2012) and Hinz et al. (2017) found marginal gender differences in the LOT-R scores, but concluded that they were negligible due to the small effect size (d=.08 and d=.12). In consistence with Glaesmer et al. (2012), Hinz et al. (2017) and Zenger et al. (2013), we found an effect of age; the older age group reported less optimism than the younger group. However, we did not see a linear age trend, and the effect size for age was small. Thus, we decided to present normative data for the whole sample. In addition to enhance the comparability of our findings with Glaesmer et al. (2012), Hinz et al. (2017) and Zenger et al. (2013) we presented percentile rank scores of the LOT-R as well. In consistence with Glaesmer et al. (2012), Hinz et al. (2017) and Walsh et al. (2015) the present |study found that people with higher education (> 12 years) were more optimistic than those with less education. The effect size was moderate. Due to the study design we cannot conclude that people who take higher education will become more optimistic or that optimistic persons are more prone to take higher education.
In addition to age, gender and education we also investigated the associations of several other sociodemographic characteristics. Besides the present study only Walsh et al.’s (2015) and Hinz et al. (2017) population studies have investigated if there is an association between marital status, employment status and optimism. In consistent with them we did find that being married and working were both associated with optimism. In addition we found that living with another person was also associated with optimism. However, we consider that these factors are negligible due to the small effect size. In view of the present study's findings and the four previous studies cited (Glaesmer et al., 2012; Hinz et al., 2017; Walsh et al., 2015; Zenger et al., 2013), it appears that sociodemographic variables have minimal associations with optimism.
In consistence with previous research we found that higher levels of optimism were associated with higher level of perceived health and quality of life (Carver & Scheier, 2014; Conversano et al., 2010). One could argue that optimists would report better QoL and better health due to a biased “optimistic” interpretation of their QoL and health. However, a study conducted by De Ridder, Fournier, & Bensing (2004) on chronically ill patients found that optimists did not tend to have a biased perception of their health status and that positive expectancies appeared to encourage self-care behavior (De Ridder et al., 2004). Furthermore, a study by Gallagher et al. (2013) found that the association between higher level of optimism and better perceived health may be universal. According to Carver and Scheier (2014), optimists have better health due to motivational and behavioral reasons. The different ways optimists and pessimists approach the world appear to have a substantial impact on their life. Part of remaining healthy includes doing the right things and avoiding the wrong things and optimists take a proactive approach to health promotion (Carver & Scheier, 2014).
Only a few studies were identified that report normative values for the LOT-R, two from Germany; one of the German general population (Glaesmer et al., 2012) and one of the population of Leipzig (Hinz et al., 2017), one from Latin American (Colombia) (Zenger et al., 2013) and one from the United Kingdom (Glasgow, Liverpool and Manchester) (Walsh et al., 2015). Compared to these studies, the Norwegian population sample scored on average (17.2) one scale point higher than the Latin American population (16.1) and the Leipzig population (16,4), two scale points higher than the German general population (15.2) and the Glasgow and Liverpool population samples (14.7), and three points higher than the population sample from Manchester (13.9). So although we found many similarities between the German, Latin American and Scottish and English version of the LOT-R, there is a meaningful difference in the mean values. Furthermore, in a worldwide study including 142 countries (using only a single item from the LOT-R), differences in the level of optimism were found (Gallagher et al., 2013). Thus the calculation of country specific norm values is required. One possible reason for why Norwegians scored higher on optimism than the above mentioned countries might be that well-being, life satisfaction and health is generally rated higher in Scandinavia and in particular in Norway compared with other regions of the world. According to the Human Development Report (UNOP) 2015, Norway was ranked as number one, followed by Australia and Switzerland. The rankings are based on three basic areas–life expectancy, education and income/standard of living.
When interpreting the results of this study, some limitations should be noted. The analyses are based on cross-sectional survey data, which does not allow for conclusions concerning the direction of the relationship between optimism and sociodemographic variables, but only a description of variables associated with optimism. Any population survey, especially one based on a sample size with an overall 36% response rate, does raise the question if it is entirely representative of its target population. Declining response rates to mailed public health surveys have been reported in recent decades in several countries (Holbrook, Krosnick, & Pfent, 2008). However, lower response rates do not necessarily produce more non-response error. It has been found that lower response rate did not notably reduce the quality of survey demographic estimates (Holbrook et al., 2008). If the response rate to a survey is used as an indicator of the quality of the data it provides, non-response error is a function of non-response and the extent to which the characteristics of responders and non-responders are different. However, in the present study there were no significant differences in mean age or gender proportions between responders and non-responders. Furthermore, the distributions of persons living in rural and urban areas were equal between responders and non-responders, minimizing biases due to socioeconomic and cultural influences. The proportion in active work was 61% in the study group compared to 67% in the general population and there were 17% who lived alone in both groups. There were however, 1.3% without work and 53% with College or University education in the study group compared to general population, 4.4% and 41% respectively (Statistisk sentralbyrå, Statistics Norway, 2015). We consider these differences to be minor and our findings to be fairly representative of the Norwegian population
In summary, as far as we know the present study is the first to provide age and gender-specific norm values from a representative sample of the Norwegian general population. These norm data may be useful for researchers and clinicians in comparisons of optimism between individuals or between different samples of patients or sub-groups of people. Our findings also confirm that there is an association between optimism and better health and quality of life.
