


Chief executive officers (CEOs) play a key role in corporate strategic decisions. This study explores how power, as a prominent CEO characteristic, influences environmental innovation. Building on the approach-inhibition theory of power, the attention-based view (ABV), and the literature on strategic leadership, we propose that CEOs with stronger power are more likely to allocate their attention to environmentally-friendly innovation. Panel data on Chinese listed corporations during the period to 2008–2018 were constructed and used for the empirical analyses. The results support the positive role of CEO power in promoting environmental innovation. Moreover, this positive effect becomes even stronger when the firm has more independent directors and faces greater market competition. These findings contribute to research on the approach/inhibition theory of power, strategic leadership, and growing literature on environmental innovation.
Recent studies on strategic leadership have explored how the attributes of chief executive officers (CEOs) affect corporate decisions and outcomes (Liu et al., 2018; You et al., 2020). As a typical CEO characteristic, power is generally defined as individual actor's capacity to exert their will (Finkelstein, 1992: 506), and has received growing interest from scholars (Muttakin et al., 2018; Sheikh, 2019; Walls & Berrone, 2017). Relevant studies show that CEO power can significantly affect the composition of the board of directors and enterprise performance (Combs et al., 2007), mergers and acquisitions (Chikh & Filbien, 2011), and environmental sustainability (Walls & Berrone, 2017). These studies imply that CEO power is often closely related to managerial risk-taking (Lewellyn & Muller-Kahle, 2012; Sheikh, 2019).
Nevertheless, whether powerful CEOs avoid or approach risk-taking decisions remains an open question (Finkelstein et al., 2009). Agency theory suggests that managers who avoid or are neutral toward risk may be reluctant to invest in risky but high-value ventures (Jensen & Meckling, 1976). An increase in CEO power may reinforce managerial entrenchment by further misaligning the interests of managers and shareholders (Haynes & Hillman, 2010). However, as Adams et al. (2005) noted, powerful CEO's opinions translate more directly into firm outcomes. By contrast, it is difficult for CEOs to take bold actions if they do not have a strong power base (Tang et al., 2011). Environmental innovation, although full of uncertainty and challenges, is important for both firm development and public welfare (Cainelli & Mazzanti, 2013). To take advantage of CEO power's beneficial role in circumventing its negative influence on a firm's sustainable development, this study focuses on the complex mechanism of how CEO power affects environmental innovation.
Environmental innovation refers to the “innovations that consist of new or modified processes, practices, systems, and products which contribute to environmental sustainability” (Oltra & Jean, 2009: 567). Environmental innovation indicates a long-term commitment to changing raw materials or components used and reducing pollution emissions (Berrone et al., 2013; Sumrin et al., 2020). In addition to high uncertainty and risks, environmental innovation can confer externalities such as social benefits (Rennings, 2000). Top executives, particularly CEOs, determine how and when their firms should avoid environmental violations or invest in green technologies (Bendell & Nesij Huvaj, 2018; Berrone & Gomez-Mejia, 2009; Walls & Berrone, 2017; Walls et al., 2012). However, the influence of CEO power on environmental innovation and its boundary conditions has not yet been fully examined. This study aims to fill this gap in the literature.
We grounded our arguments in the approach/inhibition theory of power (Keltner et al., 2003; Magee & Galinsky, 2008) and in the literature on environmental innovation (Fabrizi et al., 2018; Galbreath, 2019). The approach/inhibition theory of power reveals how power influences the relative balance between approach and inhibition tendencies (Keltner et al., 2003), and predicts that power increases individual optimism toward risk, leading to an increased propensity engaging in risk (Anderson & Galinsky, 2006). Since CEOs selectively allocate their attention to issues deemed important (Ocasio, 1997; van Knippenberg et al., 2015), and because the establishment and maintenance of relationships between a focal firm and its stakeholders, society, and the natural environment is a responsibility that lies with top executives (Freeman, 1984; Walsh, 2005), we suggest that powerful CEOs inclined to approach risk are more likely to focus on environmental innovation's potential rewards rather than its cost and risk. In other words, stronger power may inspire CEOs to initiate and allocate more valuable resources to green R&D projects, resulting in better environmental innovation output. Moreover, to reveal the conditions under which CEO power has a stronger or weaker effect on environmental innovation, we focus on three factors: independent directors, environmental information disclosure (EID), and market competition. These factors potentially affect a CEO's managerial focus on the selection of issues (Huang & Chen, 2015; Ibrahim et al., 2003), which in turn moderates the association between CEO power and environmental innovation.
To test these propositions, we empirically analysed panel data including corporate governance records and green technology patent application data of Chinese public companies during the period 2008–2018. The results support our assumption that powerful CEOs are more likely to approach, rather than avoid, environmental innovation. The presence of independent directors, EID, and market competition serve as catalysts that enhance the positive relationship between CEO power and environmental innovation.
This study contributes to the literature in two ways. First, the results extend the approach/inhibition theory of power as well as the literature on environmental innovation by examining the impact of CEO power on it. While prior studies have shown a significant link between powerful CEOs and decision-making in corporate strategies, few studies have specifically outlined how and under what conditions CEO power affects corporate environmental innovation. This study builds a direct link between the two and explores the conditions under which powerful CEOs are more likely to play a beneficial role in researching green technologies. Although the results are not conclusive, they strongly suggest that managerial power can, under the proper circumstances, provide support that offsets the negative impacts that powerful CEOs may have on social responsibility (e.g., Muttakin et al., 2018). Second, it reveals the underpinnings of the relationship between CEO power and environmental innovation by incorporating different contingent factors. The organizational, institutional, and social environments of a firm “govern the allocation of time, effort, and attention focus of organizational decision makers in their decision-making activities” (Ocasio, 1997: 195). As powerful CEOs are more optimistic in terms of risk perception and are more likely to focus on the potential rewards of environmental innovation, we emphasise and reveal the role of independent directors, EID, and market competition in moderating the effect of CEO power on environmental innovation.
Theory and hypothesis developmentCEO characteristics and environmental innovationThe literature on strategic leadership suggests that CEOs play a critical role in shaping strategic decisions (Crossland et al., 2014). Given that environmental performance has a substantial influence on a firm's sustainable development and competitive advantage, allocating organizational resources for environment-friendly research is an important corporate strategy. Prior studies have pointed out that corporate environmental initiatives and behaviours are affected by CEO characteristics. For example, in a study of corporate environmental impact (based on indicators such as greenhouse gas emissions, water abstraction, etc.), Walls and Berrone (2017) found that CEOs with informal environmental expert power reduce corporate environmental impact and that this relationship is reinforced when the CEO also enjoys formal power over the board of directors.
Environmental management requires intensive human resources (del Brío & Junquera, 2003). Researchers have identified CEOs’ psychological or cognitive attributes that influence organizational decision making and, hence, environmental innovation. For instance, Chen and Chang (2013) demonstrated that green transformational leadership can not only directly affect green product development but also indirectly affect it through green creativity. Bendell (2017) showed that business owners with prosocial motivation are likely to reject environmental innovation initiatives, and that they are expressed differently at different levels of customer compatibility. Yang et al. (2019) suggested that managers who perceive stronger business and social pressures are more likely to focus on proactive environmental strategies, which in turn fosters the development of innovation capabilities. Therefore, it is expected to influence environmental innovation. Although prior studies adopting upper echelons theory have explored the effects of CEO demographics on enterprise innovation (Lin et al., 2011), some studies have emphasised CEOs’ psychological or cognitive characteristics (Galasso & Simcoe, 2011). Among these characteristics, CEO power, which gives a CEO the freedom to examine the institutional environment and mobilise resources to direct strategic action, has attracted substantial attention (Blagoeva et al., 2019; Sariol & Abebe, 2017; Sheikh, 2018). More specifically, recent studies on strategic leadership have explored the implications of CEO power from different perspectives, including corporate risk (Sheikh, 2019), corporate social responsibility (CSR) disclosure (Muttakin et al., 2018), corporate environmental sustainability (Walls & Berrone, 2017), and organizational innovation (Sariol & Abebe, 2017). The findings underline the notion that powerful CEOs can change their firms’ strategic direction and influence stakeholders (Daily & Johnson, 1997; Finkelstein, 1992; Mitchell et al., 1997).
In contrast to the advantages that powerful CEOs can bring to their companies, agency theory views CEO power as something that needs to be limited and controlled (Jensen & Meckling, 1976). Agency theory argues that powerful CEOs may pursue an agenda that is against shareholders’ best interests (Finkelstein & D'Aveni, 1994) and may mislead the corporate board and fail to protect stakeholders (Pearce & Zahra, 1991). For instance, Galema et al. (2012) examine the role of CEO power in 280 microfinance institutions and find that the presence of powerful CEOs is associated with lower performance.
A possible reason for the imprecise and inconsistent predictions on the role of CEO power may be rooted in the agency assumption that managers are typically risk-averse or risk-neutral and fail to consider potential contexts under which risk-seeking managers function (Carpenter et al., 2003; Sanders & Hambrick, 2007; Wiseman & Gomez-Mejia, 1998). Building on this theory, emergent corporate governance studies have highlighted the importance of top executives’ psychological processes and how they influence enterprise-level decisions. For example, applying insights from social psychology and agency theory, Lewellyn and Muller-Kahle (2012) show that CEO power is positively related to excessive and unmanaged risk-taking in terms of subprime lending specialists. However, compared with other top-level executive traits, the role of CEO power in environmental innovation remains unclear (Bendell, 2017; Galbreath, 2019; Hao et al., 2019). In particular, as “top-level managers are in a position to shape and influence environmental policies” (Siegel, 2014: 221), CEO power is vital to direct environmental strategy (Chin et al., 2013). Next, we explore how and under what conditions CEO power affects corporate environmental innovation.
The effect of CEO power on environmental innovationThe strategic leadership literature shows that the power of top-level managers may work in conjunction with the attention they pay to influence decision-making (Finkelstein & Hambrick, 1996). Holding a prominent structural position in the upper echelons, CEOs are often expected to be the principal architects of an enterprise's innovation agenda (Berger et al., 2016). We propose that power leads CEO to focus their attention on environmental innovation for the following reasons.
First, pursuing environmental innovation projects is likely to be consonant with a CEO's self-image as socially responsible and confident in handling conflicts among stakeholders (Siegel, 2014). The relationship between an enterprise and its stakeholders, society, and the natural environment is a responsibility that lies with top-level managers (Freeman, 1984; Walsh, 2005; Wiesmeth, 2018). In addition to the positive externalities from knowledge spillovers, environmental innovation within an enterprise may reduce external environmental costs (Rennings, 2000) and contribute to societal well-being (Porter & Linde, 1995). The agency view also suggests that CSR investments bring private benefits to managers (Barnea & Rubin, 2010). Thus, when executives are more powerful, they may focus on environmental innovation projects to secure their personal reputations in their communities and enhance their personal status with stakeholders (Barnea & Rubin, 2010).
Second, powerful CEOs are more optimistic in their risk estimates and thus more inclined to focus on expected payoffs from environmental innovations (Anderson & Galinsky, 2006). CEOs with great power typically have access to vast resources. The experience of power involves awareness that one can act at will without interference or serious social consequences, and that elevated power activates approach-related processes (Keltner et al., 2003). For instance, Maner et al. (2007) found that power generally led decision-makers to make riskier choices unless their status quo was perceived as in jeopardy. Powerful CEOs, who expect a higher chance of success and a lower chance of experiencing risk's downside (Anderson & Galinsky, 2006), are more inclined to focus on environmental innovation's potential rewards rather than its cost and risk. Moreover, the psychological experience of utilising power can lead to overconfidence in the accuracy of one's thoughts and beliefs, which in turn affects decision-making tasks (Fast et al., 2012). If the rewards from successful innovative projects are large, an overconfident CEO has an increased propensity to innovate to offset the negative impacts of suboptimal investment behaviour (Galasso & Simcoe, 2011). Thus, powerful CEOs are more likely to pay more attention to environmental innovation and pursue it with greater vigour.
Third, powerful CEOs tend to believe that they can deal with difficult tasks because they are better at controlling valuable resources and have greater ability to administer rewards and punishments (Anderson & Galinsky, 2006; Keltner et al., 2003). Valuable resources can be concrete, such as access to employment or abstract, such as access to a social group (Inesi, 2010). Powerful CEOs typically have greater access to valuable resources than other organizational members, making them less likely to experience discipline from the full range of corporate control mechanisms (Berger et al., 1997). Moreover, environmental innovation often involves changes in the raw materials or components used in addition to logistical and technical integration with external suppliers (Berrone et al., 2013). Therefore, timely R&D decisions are important for environmental innovation. Powerful CEOs are more likely to facilitate efficient decision-making processes, which, in turn, improves the efficiency of R&D investment and administrative support (Chen, 2014). Furthermore, investing in innovative projects indicates a superior managerial vision (Hirshleifer et al., 2012), and green technology development is typically labelled as an effort to pursue social responsibility (Ambec & Lanoie, 2008; Zhu et al., 2019). Thus, environmental innovations appeal to powerful CEOs.
Taken together, CEOs with stronger power are more likely to be attracted to the potential rewards of environmental innovation, and thus allocate more managerial attention while neglecting the downsides of risks and uncertainties. According to the attention-based view (ABV) of the enterprise, “what decision-makers do depends on what issues and answers they focus their attention on” (Ocasio, 1997). In an enterprise, the allocation of top-level executive attention significantly influences its organizational learning process and innovative projects (Linda et al., 2017). Therefore, we expect that the more attention CEOs pay to environmentally friendly R&D activities, the more likely they are to mobilise valuable resources in this area, which in turn improves firms’ environmental innovation. This leads to:
Hypothesis 1 There is a positive relationship between CEO power and environmental innovation.
If CEO power facilitates environmental innovation, then the follow-up question is, which conditions strengthen or weaken this positive effect? We further explored the potential contingencies that bound this relationship. From an ABV perspective, environmental stimuli play an important role in allocating managerial attention as “in any specific communication or procedural channel, physical, economic, and institutional factors both external and internal to the enterprise impinge upon the environment in which decisions are made and provide a set of stimuli for decision-making’ (Ocasio, 1997: 193).
Therefore, we argue that under certain environments, CEOs are more likely to attend to areas in which they are interested (environmentally-friendly technologies, in this case), thereby enhancing the positive effect of CEO power on environmental innovation. By contrast, when the attention of CEOs shifts to other managerial issues, the CEO power's beneficial role in environmental innovation is undermined. Based on prior studies (Huang & Chen, 2015; Ibrahim et al., 2003), we examined the potential moderating roles of one internal factor (i.e., independent directors) and two external factors (i.e., EID and market competition) in the relationship between CEO power and environmental innovation.
Independent directors refer to board members “who are not dependent on the company for employment, sales, or other benefits” (Hillman et al., 2000: 237). As independent directors typically have no discernible ties to the firm (Mallette & Hogler, 1995), they may facilitate control over the board and effectively reduce agency costs, such as shirking or tunnelling of corporate resources by punishing managers for poor performance (Fama & Jensen, 1983; Holmstrom & Milgrom, 1991; Stiglitz & Weiss, 1983). Thus, charged with overseeing and advising executives, independent board members lead managers to take actions closer to shareholders’ interests. Moreover, compared with executive board members, independent directors are more objective and more concerned about enterprise relationships with different stakeholders, since they do not feel the pressure of competitors so closely (Sonnenfeld, 1981), and their image and reputation may be damaged if they act against what is suggested by the institutional and social contexts (Prado-Lorenzo & Garcia-Sanchez, 2010). Similarly, independent board members are more favourable toward the demands of external stakeholders (e.g. investors, government, and creditors) to improve the firm's ethical behaviour (Johnson and Greening, 1999), and they often enjoy higher incentives for developing ethics codes and more sustainable behaviour (García-Sánchez et al., 2015). Empirically, Ibrahim and Angelidis (1995) affirmed that independent directors exhibit great concern with respect to social demands and find themselves in a better position than internal board members to protect the interests of stakeholders. Drawing on in-depth interviews with top managers, Jamali et al. (2008) find that the presence of independent directors is conducive to voluntary CSR disclosure. Evidence from emerging economies confirms this finding. For example, Khan et al. (2013) find that independent directors have a positive and significant effect on CSR disclosure among manufacturing companies in Bangladesh. Therefore, the presence of independent directors may enhance a firm's objectivity and concern about ethical behaviour and social aspects in strategic decision-making, which in turn requires executives to devote more attention to CSR areas, such as environmental issues. When executives focus on environmental innovation, the main relationship between CEO power and environmental innovation is strengthened. This leads to:
Hypothesis 2 The presence of independent directors strengthens the positive relationship between CEO power and environmental innovation.
As the “third wave” of environmental regulation1 (Tietenberg, 1998), environmental information disclosure (EID) is used to regulate pollutants not covered by traditional regulations and is effective in combating pollution in developing countries (Powers et al., 2011). An environment with high levels of EID may affect demand for goods and provide new information to managers regarding their firms’ pollutant discharges and options for reducing them (Powers et al., 2011). Therefore, CEOs with more environment-related information may pay more attention to environmental aspects when making strategic decisions. Moreover, EID serves as an informal environmental regulation mechanism (Li et al., 2018). It is not uncommon to find that the more information about pollution sources a city discloses, the more likely the public is to participate in public supervision, facilitating the local government to make more efforts to improve environmental quality (Li et al., 2018). With the development of the Internet and social media, environmental information is disseminated from both government and non-governmental organisations (NGOs) and spreads easily, often drawing citizens’ attention (Zheng & Kahn, 2013). Environmental information in the public domain may draw stronger responses from powerful CEOs, where they may become even more aggressive in approaching environmental innovation, as such an approach signals a long-term commitment to reduce polluting emissions, thereby making it more likely for them to reap the social benefits of acquiescence (Rennings, 2000). Thus, the relationship between CEO power and environmental innovation is stronger when EID is high.
Hypothesis 3 Environmental information disclosure strengthens the positive relationship between CEO power and environmental innovation.
We posit that market competition, as an external factor, moderates the relationship between CEO power and environmental innovation. First, under high levels of market competition, CEOs are likely to pay attention to the generation of novel green products or services, because environmental innovation is a principal differentiation tool and has become a (good) response to earn competitive advantage (Li, 2014). Second, to defend market share, incumbent firms should invest in green technologies, as environmental innovation can create “isolation mechanisms” which protect profit margins. In this sense, powerful CEOs consider environmental innovation as an effective way to deal with the challenges posed by rivals (Chang, 2011). Third, given that social responsibility has become an important element of market competition, facilitating environmental innovation is considered a positive and informative signal about top executives’ efforts and capacity, which is a practical way for powerful CEOs to exploit the market and bolster profitability. Furthermore, the industrial structure's characteristics can affect management discretion. Particularly, in a less competitive market, there are various developed rules and interactive norms (Finkelstein & Hambrick, 1996), that may limit the CEO's discretion. When CEO have limited discretion, the impact of CEO's attitudes on green innovation decision-making is not as significant as when the CEO has more discretion. Therefore, we propose the following hypothesis:
Hypothesis 4 Market competition strengthens the positive relationship between CEO power and environmental innovation.
To summarize, the conceptual framework of this study is illustrated in Fig. 1.
MethodologySample and data sources
This study selects manufacturing companies listed on China's Shanghai and Shenzhen Stock exchanges during 2008–2018 as research subjects for the following reasons. First, as an important force of the pillar industry, public manufacturing companies have contributed significantly to China's economy. Manufacturing firms are the primary contributors to environmental pollution. Industrial pollution and energy losses caused by manufacturing negatively affect the ecological environment. Second, compared to other industries, the manufacturing industry faces more severe external environmental pressures. To achieve green and sustainable development, manufacturing companies must perform a series of environmental innovation activities and undertake corresponding corporate environmental responsibilities (Chen et al., 2020).
This study processed the raw data as follows: First, companies with abnormal financial status during the sample period were excluded, such as ST, *ST2; second, companies with incomplete or missing data were excluded; third, the tail values at 1% and 99% of continuous variables were winsorised. Finally, 1616 listed companies were included, with 7912 observations.
MeasuresDependent variable: environmental innovationBased on the literature (Berrone et al., 2013; Li et al., 2018), this study adopts corporate green patents as an indicator of environmental innovation. Python was used to screen and process the data of corporate green patents from the State Intellectual Property Office (SIPO) website for corporate names, including previous names, and the IPC classification information documented in the “International Green Patent List”3 (Qi et al., 2018) was also used. Considering that some companies may have zero patents in certain years, one is added to the number of environmental patent applications and its logarithm value is used for empirical analyses (Berrone et al., 2013; Li et al., 2018; Liao, 2020).
Independent variable: CEO powerThe measurement of CEO power is based on the power measurement model proposed in previous studies. A CEO's core task is to process environmental uncertainty (Finkelstein, 1992). Internal uncertainty is due to internal directors and the company's structure, whereas external uncertainty is due to the business environment and strategic value orientation of the company. The existence of these two types of uncertainties can centralise a CEO's power. Following prior studies (Finkelstein, 1992), we divided CEO power into four dimensions: structural, ownership, expert, and prestige power. the specific definitions and explanations of these four dimensions are shown in Table 1.
① Structural power. This is the basic dimension of power in the organizational structure and is determined by organisation's hierarchical structure. The CEO is at the top of the hierarchical structure and has the unique right to allocate company resources and direct subordinates to conduct production and business. If the CEO concurrently serves as the board chair, his or her power in the company is expanded further. In view of this, if a CEO is also the chairman, then the value of structural power is 1; otherwise, it is 0 (dual). In addition, if the CEO serves as an internal company director, it will also have an impact on the company's production and management. Following prior studies, if the CEO is an internal director, the value of structural power is taken as 1; otherwise, the value is 0 (insider director) (Sariol & Abebe, 2017).
② Ownership power. The CEO has greater power if he or she is also a shareholder, such as being able to appoint or remove directors and making major strategic decisions for the company. It is also more favourable for the CEO to gain a first-mover advantage against other shareholders and managers of the company. These abilities play an important and irreplaceable role within the company, allowing the CEO to consolidate its legal position, reduce the risk of removal by other managers and shareholders, and provide constructive strategic opinions on the company's long-term development (Quan & Wu, 2010).
The dimension index of CEO Power.
Because of the late start of China's equity incentive policies, the level of management executives holding company shares is relatively low. Therefore, this study sets the ownership power of CEOs who hold shares of their company to 1; otherwise, the value is 0 (CEO_share). In addition, in recent years, with the rise of the institutional investment business, institutional investors can coordinate contradictions and conflicts between corporate executives and effectively resolve agency problems within the company as external shareholders. Thus, this study uses the ratio of institutional investor shareholdings as another indicator of CEO ownership power. That is, if the ratio is lower than the industry average, the value of ownership power is set to 1 and 0 otherwise (Institute_share) (Quan & Wu, 2010).
③ Expert power. CEOs with professional qualifications and titles often gain the support and trust of other managers and shareholders in the company, which further promotes and consolidates their power. In addition, CEOs who have been in office longer are more familiar with the company's organizational structure and business operations, which allows for a more independent team organisation and reduced board control. To this end, this study examines whether the CEO has senior professional titles (rank) and the length of the CEO's tenure (tenure) to measure the CEO's expert power (Lewellyn & Muller-Kahle, 2012; Tang et al., 2011).
④ Prestige power. The prestige of a CEO is determined by the external public's recognition of his or her abilities. CEOs with better reputations are more able to help their firms establish a good corporate image and gain favour and support from investors, suppliers, and customers, thus benefiting the company's long-term development. CEOs with higher education levels have a broader vision and deeper understanding. Therefore, a CEO with a high degree of education can often gain the support and trust of company managers and shareholders, which in turn further promotes and consolidates the CEO's power. Therefore, this study uses whether the CEO has a higher degree of education (master's degree and above are marked as 1; otherwise, it is 0) to measure the prestige power (degree). In addition, CEOs with part-time positions in other companies would value their personal reputations and strive to improve their abilities and qualities. This study considers whether a CEO has other part-time positions to measure CEO prestige power. If yes, the value is 1; otherwise, the value is 0 (part-time job) (Sariol & Abebe, 2017).
These four dimensions and eight indicators reflect the characteristics of CEO power from different perspectives. However, each indicator's characteristics are limited, and it is difficult to measure the basic characteristics of CEO power comprehensively. Therefore, this study integrates these four dimensions and eight indicators into a unidimensional indicator of CEO power. To achieve this objective, there are usually two methods for constructing comprehensive indicators: the first is to directly average the scores of the above eight dummy variables, and the average value is between [0 and 1]; the second is to use principal component analysis (PCA), which adopts the first principal component as the comprehensive index of the above indicators. However, before using PCA, the indicator should first pass the Kaiser-Meyer-Olkin (KMO) test (Kaiser & Rice, 1974). The test results show that the KMO value of CEO power is 0.558, which is smaller than the standard R of 0.74. Therefore, it is inappropriate to use PCA to measure the comprehensive indicators. This study adopted the first method to measure CEO power.
Moderating variablesIndependent director: In general, independent directors are externally hired and can play a constructive role in the company's governance mechanism and strategic planning in a fair and objective manner. Larger proportions of independent directors are more likely to influence management's decision-making behaviour, improve decision-making efficiency, strengthen the company's governance capabilities, and promote long-term sustainable development. This study uses the proportion of independent directors on the board of directors to express independent directors’ degree of influence (Duru et al., 2016; Li et al., 2018).
Environmental information disclosure: To measure the extent of environmental information disclosure, we adopted the pollution information transparency index (PITI), jointly released by the Institute of Public and Environmental Affairs (IPE) and the Natural Resources Defense Council (NRDC), which is an evaluation system for the information disclosure status of environmental protection agencies. Covering 120 major large and medium-sized cities in China, PITI evaluates and reports the degree of urban pollution source supervision, pollution treatment work, and public information disclosure (Li et al., 2018). Typically, the more transparent and comprehensive the information, the higher the PITI score. The total score of this measurement was 100, which was logarithmically processed in the present study.
Market competitionMarket competition refers to the degree of aggregation and competition among competitors in the same space. Following prior studies (Tang et al, 2015), this study uses the ratio of the prime operating revenue of the top four enterprises in the industry to the prime operating revenue of the entire industry to measure market competitiveness. The greater the value (i.e., the higher the industry concentration), the lower the degree of market competition. To maintain consistency of direction, this study adopts the reciprocal of this indicator for empirical analyses.
Control variablesTo rule out the possible influence of other organizational factors on environmental innovation, we controlled for several corporate features. First, larger enterprises are able to consolidate more funds and management experience, have a greater ability to manage risks, and receive more attention from the outside world, which results in a higher likelihood of actively engaging in environmental innovation (Stanny & Ely, 2008). This study used the natural logarithm of a company's total assets as a proxy for company size. Second, compared to young firms, mature enterprises have richer management experience and risk control capabilities and place greater emphasis on their long-term development, resulting in a higher likelihood of investing in R&D activities related to environmental innovation. This study used the number of years since the firm's establishment to calculate firm age (Zhang et al., 2020). Third, as an important indicator of corporate profitability, return on assets (ROA) represents an enterprise's competitiveness and development capabilities, thereby affecting its environmental activities (Adams & Hardwick, 1998). A higher ROA represents a better capability to perform environment-friendly activities, such as energy conservation and environmental protection. Fourth, the lower the debt-to-asset ratio of a firm, the greater its capability to engage in environmental innovation. This study uses the ratio of a firm's total liabilities to total assets to measure its debt-to-asset ratio (Zhang et al., 2020). Fifth, the presence of more people on the board of directors represents a higher likelihood of the enterprise formulating strategic plans for long-term development, which facilitates the promotion of environmental innovation activities (Balsmeier et al., 2017). Sixth, companies with different equity properties may have different choices with respect to environmental innovation activities. This study adopts dummy variables for the nature of enterprises by setting 1 for state-owned firms and 0 for other firms (Li et al., 2018). In addition, influencing factors such as annual, industry, and regional fixed effects have also been added (see Table 2).
Definition of main variables.
Notes: SIPO - State Intellectual Property Office's; CSMAR - China Stock Market & Accounting Research Database; IPE - Institute of Public and Environmental Affairs; NRDC - Natural Resources Defense Council.
To examine the impact of CEO power on corporate environmental innovation, this study used the following equation:
where yit is the dependent variable, xit is the independent variable CEO power, α0 is the constant, α1 is the estimating coefficient of the independent variable CEO power, Zit is the control variable, λ is the estimation coefficient of the control variable, yeart is the time effect variable, industryi is the industry effect variable, areai is the regional effect variable, and εit is the error term.
To analyse the moderating effects of independent directors, environmental information disclosure, and market competition on an enterprise's environmental innovation, this study uses the following cross-product model:
where mit denotes the moderating variables (i.e., independent directors, EID, and market competition), α2 is the estimating coefficient of the multiplication of the moderating variable and the independent variable, α3 is the estimating coefficient of the moderating variable, and other variables and coefficients are the same as in Eq. (1).ResultsDescriptive statistics and correlation analysis
Table 3 lists the descriptive statistics and Pearson's correlation analysis. The maximum value of the variance inflation factor (VIF) is only 1.820, which is less than 10, indicating that no serious multicollinearity effect exists between the independent variables. Together with the correlation coefficients among the independent variables, it is suitable for conducting a regression analysis.
Descriptive statistics and correlation analysis.
Notes: * p < 10%, ** < 5%, *** < 1%, two-tailed test.
This study employs a generalised estimation model to conduct an empirical analysis. This method is often used to analyse unbalanced panels or repeated measurement data. As our panel dataset is unbalanced, the generalised estimation model was used to test specific hypotheses. Moreover, to reduce the potential undermining influence of multicollinearity, the explanatory variable (i.e., CEO power) and moderating variables were standardised before generating the interaction terms. The estimation results are presented in Table 4, where Models 1 to 4 correspond to Hypotheses 1, 2, 3, and 4, respectively.
Generalized estimating equation results.
Notes: t-statistics in parentheses, *** p < 0.01, ** p < 0.05, * p < 0.1.
Specifically, the results of Model 1 show that the CEO power coefficient is 0.045 and is significantly positive at the 1% level, indicating that the greater the CEO power, the higher the likelihood that the CEO will facilitate green patents. The strategic planning of sustainable development stimulates enterprises’ internal motivation to engage in environmental innovation activities, which is conducive to green production transformation and green R&D activities and improves the environmental performance of enterprises. Therefore, there is a positive relationship between CEO power and environmental innovation, lending support to hypothesis 1.
Model 2 uses independent directors as a moderator of the relationship between CEO power and environmental innovation. The results show that the interaction term between independent directors and CEO power is 0.016 and significantly positive at the 10% level. Independent directors, external experts hired by the company, have no direct conflicts of interest with the company's senior management; hence, they can more objectively and effectively coordinate internal conflicts between the company's senior management and correct the CEO's corporate governance and strategic choices.
Model 3 uses EID as a moderating variable to study the impact of CEO power on environmental innovation. The results show that the interaction term between EID and CEO power is insignificant, implying that EID does not have a significant moderating effect on the relationship between CEO power and environmental innovation. Therefore, Hypothesis 3 was not supported.
Model 4 shows that the interaction term between market competition and CEO power is 0.056 and is significantly positive at the 1% level, indicating market competition’s positive role in reinforcing CEO power's positive effect on environmental innovation, thereby supporting Hypothesis 4. The fiercer the market competition, the greater the pressure on the environmental legitimacy faced by the CEO. Against this background, environmental violations may cause serious damage to a CEO's reputation and corporate profits. To consolidate the personal position in the organizational structure and enhance the board's bargaining power, environmental innovation activities, such as green process transformation and environmental protection equipment introduction, are preferred by the CEO to achieve long-term green and sustainable development goals. Model 5 integrates all interaction items into one regression model. The results of Model 5 are similar to those of the previous four models.
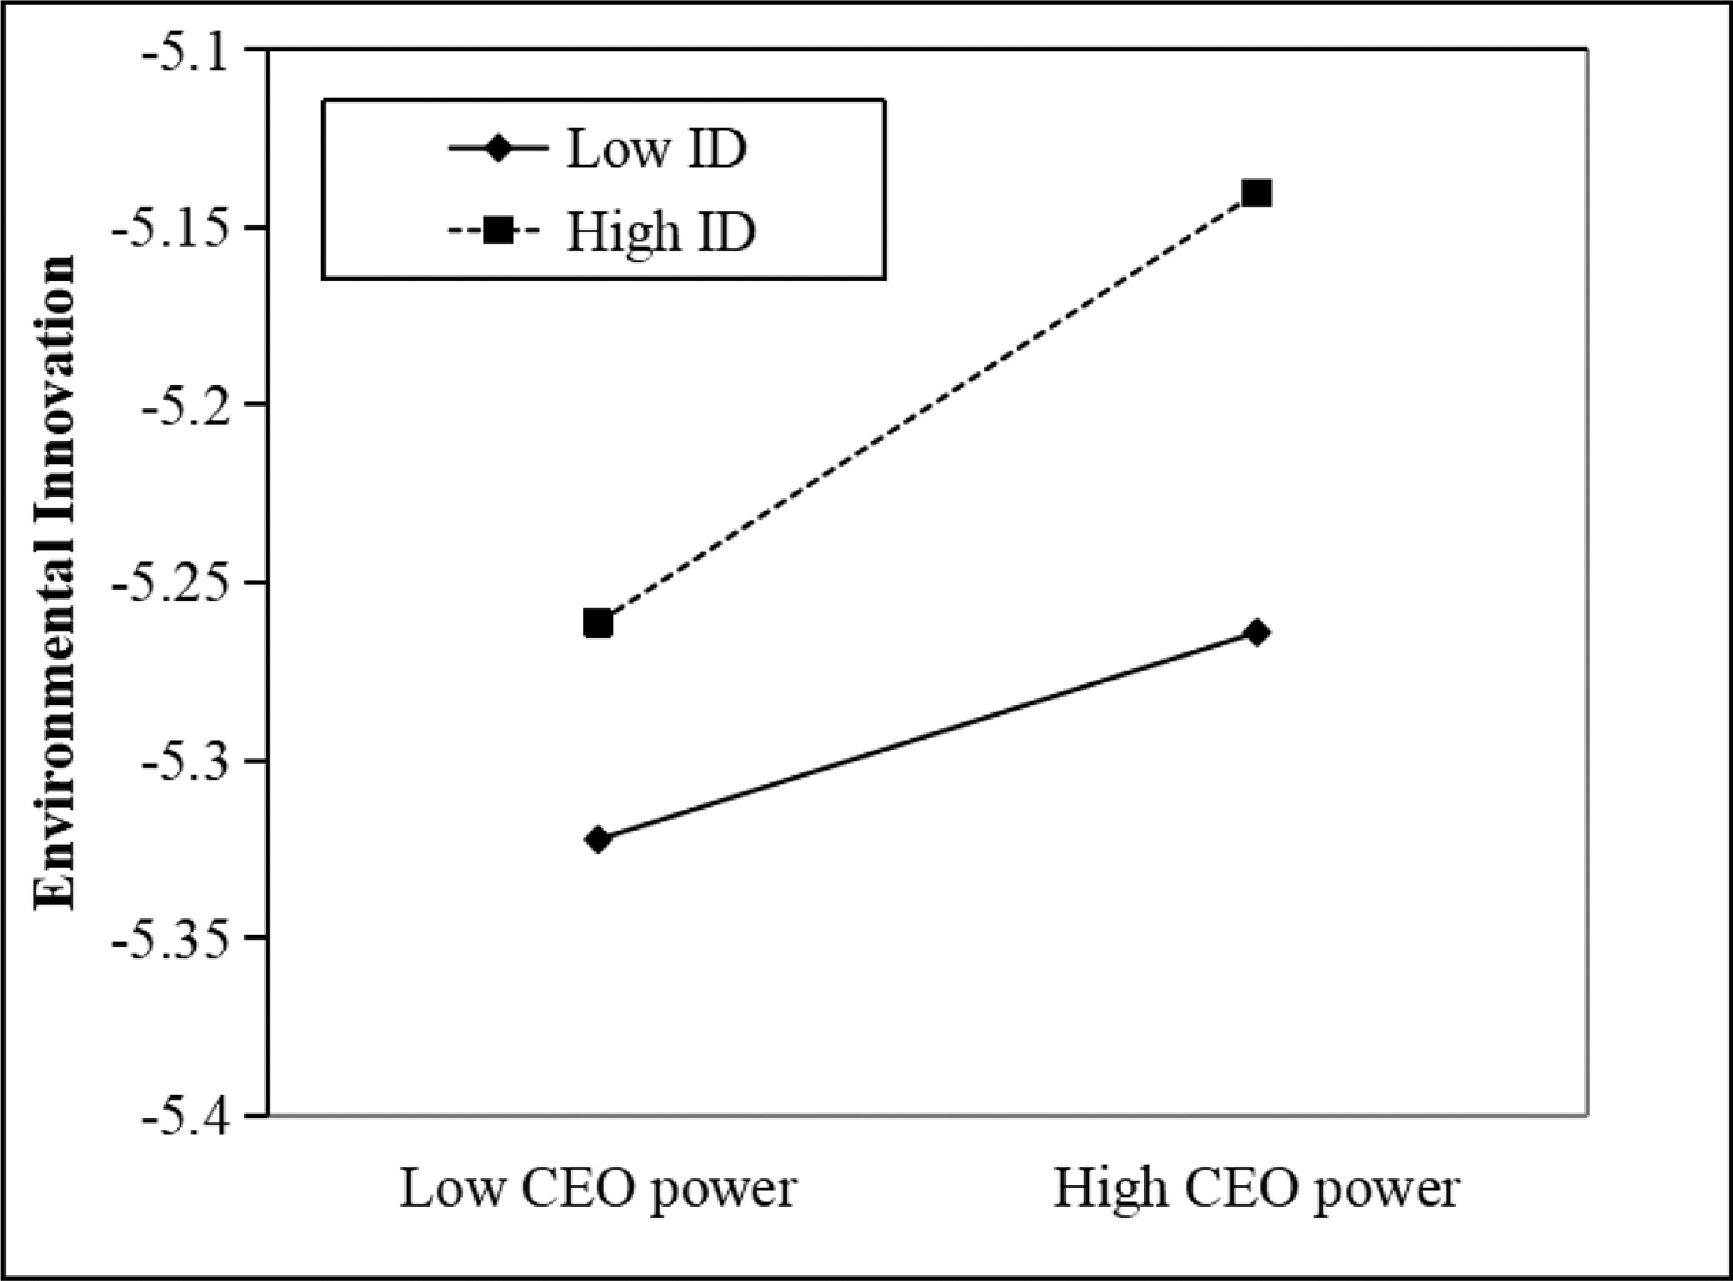
To intuitively illustrate the moderating variables’ effect, this study draws moderation plots by adding to and subtracting one standard deviation from the mean value of the independent variable and the moderating variable to obtain two sets of high and low combinations. As Fig. 2 shows, when the proportion of independent directors is low, CEO power has a small effect on environmental innovation. By contrast, when the proportion of independent directors is high, CEO power has a larger effect on environmental innovation. Similarly, as shown in Fig. 3, compared to a low degree of market competition, CEO power has a stronger positive effect on environmental innovation when a firm faces fiercer competition.
Robustness tests and endogeneity concernsRobustness test based on replacing the explained variable.")
.")
In the main regression analysis, the number of green patent applications was used to measure environmental innovation. To check the robustness of our findings, we used the number of environmental patent authorisations (EI_auth) as an alternative proxy for environmental innovation. Specifically, the number of environmental patent authorisations was added to one and logarithmically processed for regression analysis. Table 5 shows that the signs and significance of the variables of interest are consistent with those in Table 3, indicating that the analysis results are robust.
Robustness test with environmental patents authorized as a dependent variable.
Notes: t-statistics in parentheses, *** p < 0.01, ** p < 0.05, * p < 0.1.
Because green patent applications have a certain time lag, this study uses the lag period of green patent applications as an alternative dependent variable to check our findings’ robustness. As Table 6 shows, the empirical results are similar to the coefficients reported in Table 3 without material changes, further supporting our estimations’ robustness.
Robustness test with environmental patent application lag one period.
Notes: t-statistics in parentheses, *** p < 0.01, ** p < 0.05, * p < 0.1.
To alleviate the problem of inappropriate setting of the estimating function, this study uses PSM for robustness testing. In the case of PSM matching, logit regression of the control variables was carried out with the treatment variable, and the tendency score was obtained. The samples in the control group, which tended to obtain the closest scores, were the experimental group's paired samples. Using this method, the systematic differences between the experimental and control groups can be minimised; thus, the estimation error can be reduced. Before estimating the other methods after PSM matching, it is necessary to test the balance hypothesis of the covariables. That is, whether the variables become balanced between the experimental and control groups after matching, and whether there is a significant difference in the mean value of covariables between the experimental group and the control group after matching. If there is no significant difference, then further model estimation is supported. From a specific point of view, we divide the sample firms according to the median of the CEO Power and set the sample firms greater than or equal to the median CEO Power as 1 and the other sample firms as 0. Before the balance test, we use the 1:3 nearest-neighbour matching method to match the sample firms. After matching, we must test whether the matched samples meet the balance hypothesis, that is, whether there is no significant difference in the matching covariables between the experimental and control groups. According to the balance test results in Table 7, the deviation of the matched variables is less than 10%, and the t value is much greater than 10%, indicating that PSM has passed the balance test and effectively solved the problem of incorrect setting of the function form. In this study, Table 8 shows that the matched samples are regressed again, and the results are consistent with the principal regression analysis, which further confirms the robustness of the hypothetical relations.
Comparison of sample mean before and after matching.
Robustness test based on PSM samples.
Notes: t-statistics in parentheses, *** p < 0.01, ** p < 0.05, * p < 0.1.
Considering the possible selection bias in the sample when verifying CEO power's impact on environmental innovation, we adopted the Heckman two-stage method to correct for sample selection bias (Heckman, 1979). The first step is regression analysis of the probit model to obtain the inverse Mills ratio (IMR) (Katmon & Farooque, 2017). The second step is to use the calculated IMR value as a control variable in the regression model of an enterprise's environmental innovation. Table 9 lists the results of the Heckman's two-stage regression model. Part A of Table 9 presents the first-stage regression analysis using the probit model. We set the dependent variable as an “environmental innovation dummy variable”. During the period 2008–2018, if the company obtained environmental patents, then the value was set as 1, and 0 otherwise. The explanatory variables include company size, company age, return on total assets, growth rate of operating income (Grow), company value (Tobin), and financing constraints (Fincons). Part B of Table 9 presents the regression results for the second step. All IMRs were significantly negative at the 1% level. Although the model may suffer from sample selection biases, the signs and significance levels of the main variables in the corrected regression analysis are similar to those in the main regression analysis results, indicating an acceptable level of robustness of our findings.
Results with Heckman two-stage test.
Notes: t-statistics in parentheses, *** p < 0.01, ** p < 0.05, * p < 0.1.
To further distinguish the heterogeneity of environmental innovation, this study divides patents into environmental invention patents and environmental utility patents according to their classification as environmental patents (Liao, 2020). Table 10 shows that CEO power and its contingent variables (proportion of independent directors, EID, and market competition) have different effects on environmental invention patents (Models 1–5) and environmental utility patents (Models 6–10). Specifically, the coefficient and significance of CEO power and the moderating variables (the proportion of independent directors and market competition) on environmental invention patents are higher than those of utility patents, while the interactive term of the proportion of CEO power and independent directors is not significant for environmental utility patents. This may be due to the longer protection period of environmental invention patents, their broader scope of protection, and the higher level of novelty of technology, creativity, and practicability, which are conducive to maintaining environmental innovation competitiveness. By contrast, an environmental utility patent is related only to the products’ shape and structure. Although the cost is relatively less and the application time shorter, it has limited effects on the scope of protection, protection period, and promotion of sustainable development. Therefore, compared to environmental utility patents, CEOs and independent directors pay more attention to the novelty and sustainability of products, thereby increasing R&D and investment in environmental invention patents.
Heterogeneity of environmental innovation.
Notes: t-statistics in parentheses, *** p < 0.01, ** p < 0.05, * p < 0.1.
In this study, we establish a link between CEO power and environmental innovation by theoretically proposing and empirically evaluating the direct effect of CEO power on environmental innovation. The results demonstrate CEO power's significantly positive role in facilitating corporate environmental innovation, as measured by the number of green patents. Moreover, to reveal the conditions under which the positive role of CEO power is strengthened or weakened, we further explored three contingency factors (independent directors, EID, and market competition). Empirical analyses suggest that these factors positively moderate the relationship between CEO power and environmental innovation, although the moderating effect of EID is insignificant.
A possible reason for the EID's less pronounced moderating role is that it is a rough indicator of the general environmental concern regarding the local environment rather than a direct disclosure of an enterprise's pollution information. A higher level of EID indicates greater regulatory pressure on institutional environments (Ahmad et al., 2019; Tian et al., 2016), which serves as a direct driving force of an enterprise's green behaviour, as our results demonstrated. Nevertheless, top-level executives, such as CEOs, may treat EID as a proxy for environmental concerns of general stakeholders outside of the company, and may attribute its high score as the outcome of competitors’ or other counterparts’ behaviours and outcomes. In this regard, powerful CEOs may pay little attention to their enterprise's environmental issues when EID is high, leading to a minor role played by EID in moderating the positive effect of CEO power on environmental innovation. Another potential explanation is that powerful CEOs may have a propensity to behave in distinctive and non-conforming ways (Brauer, 2001; Guinote et al., 2002). For example, Guinote et al. (2002) found that members of high-power groups behave more distinctly than members of low-power groups, who behave similarly to each other. Thus, even if EID is high, powerful CEOs may not focus on environmental issues that normally attract other executives’ attention. Meanwhile, we found that the presence of independent directors has a direct influence on an enterprise's environmental innovation; it also plays an essential role in enhancing the positive effect of CEO power on environmental innovation. This finding indicates that independent board members can not only facilitate an enterprise's environmental innovation on their own but are also able to do so when a powerful executive manager is present on the board.
ConclusionsThe findings of this study contribute to the literature on this topic. First, it contributes to the environmental management literature by establishing a direct link between CEO power and an enterprise's environmental innovation. Traditionally, research on environmental innovation suggests that the reasons companies facing similar pressures exhibit heterogeneous green innovation efforts are mainly focused on macro-level factors, such as pollution intensity (Berrone & Gomez-Mejia, 2009), and organizational factors, such as organizational changes (Horbach, 2008). Recently, scholars have analysed the micro-foundations of a firm's environmental behaviour by focusing on the characteristics and preferences of the enterprise's top executives (Chen & Chang, 2013; Walls & Berrone, 2017). However, these two streams of literature are being independently developed, and few studies have integrated them to draw a comprehensive picture of CEOs. Insightful as these two research streams have been, the explicit question of how CEO power influences environmental innovation remains. This study helps answer this important question by showing that the effective implementation of an environmental innovation strategy substantially depends on the power of firms’ top-level executives.
Second, this study's theory and empirical findings contribute to corporate governance research by shedding new light on the psychological aspects of CEO power, thus providing important implications and extensions of agency theory. Traditional agency theory, with its emphasis on the divergent interests of management and owners, argues that CEOs pursue an agenda reflecting their interests when power shifts away from the board and where they avoid risk. Our theory, in alignment with agency theory, argues that powerful CEOs focus on decisions that largely reflect CEOs’ desires. However, by utilising the approach/inhibition theory of power, we postulate that power affects CEOs’ risk preferences, as the experience of power involves awareness that one can act at will without inference or serious social consequences (Keltner et al., 2003). Elevated power activates the CEO's approach system more than the inhibition system, resulting in unduly optimistic appraisals of the possible consequences of strategic decisions (e.g. environmental innovation) (Lewellyn & Muller-Kahle, 2012). Thus, our study contributes to an emerging stream of research (Adams et al., 2005; Chin et al., 2013; Tang et al., 2014; Zhang et al., 2020) that highlights the psychological characteristics and processes of top executives and how they play a role in strategic decision-making.
Third, by identifying the conditions under which managerial power may work to the advantage of an enterprise in areas such as environmental innovation, this study enriches the understanding of the nuanced relationship between CEO power and an enterprise's environmental management. The field has recently called for more research on the allocation of managerial attention and its influence on decision-making in the information age, with van Knippenberg et al. (2015:654) suggesting that “a useful direction for future research would be to explore how and when to structure environments in which the quality of attention allocated to a given task is as high as possible, even if its quantity is not great”. We answer this call by incorporating the firm's ABV into our theoretical understanding and find significant roles played by independent directors and market competition in enhancing CEO power's positive effect on environmental innovation.
Additionally, our research enriches the environmental innovation literature in the challenging context of China's emerging markets, where environmental innovation is an essential social concern (Zhang & Xie, 2020). In contrast to Liu et al. (2015), who found that institutional pressures, as opposed to internal managerial concerns, have a stronger effect on environmental strategies in China than in Western countries, our findings suggest that CEO power exerts a stronger influence on corporate environmental innovation than EID, which indicates the pressure of local institutions.
This study's findings have several practical implications. First, the positive relationship between CEO power and environmental innovation suggests the importance of empowering high-level managers. Environmental innovation is critical to an enterprise's sustainable development and market advantages. To successfully produce environmental innovations, the literature suggests CEOs be rewarded with strong power to freely scale institutional environments (Mitchell et al., 1997) and mobilise valuable resources to direct strategic actions (Daily & Johnson, 1997), such as pursuing green technological developments. Thus, it may be advisable to avoid having a hamstrung CEO (Tang, 2019); instead, board directors and senior executives should be aware of powerful CEOs’ important role in achieving the goal of sustainable development and in dealing with conflicts among various stakeholders (Barnea & Rubin, 2010; Jones-Christensen et al., 2013). Second, our results show that, in some cases, CEOs are more likely to exert power over environmental innovations. For instance, the presence of independent directors amplifies CEO power's instrumental effect on environmental innovation, indicating that the introduction of outside directors is not only conducive to alleviating agency problems, but also helpful in improving the enterprise's ethical behaviour. This is particularly important for policymakers in emerging markets where the presence of independent directors is relatively low (Firth et al., 2016). In addition, more attention should be paid to the role of market competition, as powerful CEOs are more likely to focus on green technological development when their firms face severe challenges from their rivals. Thus, policymakers may consider regulations or policies that facilitate anti-monopoly in manufacturing industries and encourage benign market competition, which, in turn, will more effectively motivate companies to invest in environmental innovations (Tang & Tang, 2016).
Several avenues can be explored further. First, although measuring corporate environmental innovation using environmental patents is reliable, it is advisable that environmental innovation should encompass other innovation aspects such as environmental certification, environmentally-beneficial products, environmental commendations, and other innovation-related actions. Second, CEO power is only one aspect of their characteristics; future research should consider other characteristics (such as narcissism, arrogance, and confidence). Third, different internal and external governance factors also have heterogeneous impacts on CEO power. In the future, factors such as environmental enforcement, equity, and compensation incentive mechanisms can be considered moderating or intermediary variables to study CEO power and its impact on environmental innovation. Additionally, this study empirically examines CEO power's role in Chinese listed manufacturing companies. It behoves future studies to extend our research by focusing on sample firms in a broader range of industries of other nations.
This research is funded by the Social Science Foundation General Project of Hunan Province (grant no. 20YBA095); by the National Science Foundation of China (grant no. 71502056); by the Hunan Provincial Science and Technology Department (grant no. 2020JJ3017, 2020JJ5114, 2018JJ3083). The usual disclaimer applies.
The other two waves of environmental regulation are the command-and-control and market-oriented strategies.
Listed companies that have abnormal financial conditions or other conditions, resulting in their risk of terminating listing of their shares. Shanghai and Shenzhen Stock exchanges give a risk warning to the company's stock trading.
The "List" has classified the green patent classification codes (IPC classification codes) of the seven categories, including waste management, energy conservation, alternative energy production, administrative supervision design, transportation, agriculture and forestry, and nuclear power regeneration. This study has identified and tallied the number of patents (the number of green patent applications) that are consistent with the IPC classification codes included in the "List" among the patents applied by listed companies in each year. The list is based on the United Nations Framework Convention on Climate Change, which can be found on the website of the world intellectual property organization. https://www.wipo.int/classifications/ipc/en/green_inventory/.
KMO metrics: 0.9 or higher is very suitable, 0.8 is suitable, 0.7 is average, 0.6 is not suitable, and below 0.5 is extremely unsuitable.